Copy the code as it is. No coding needed.
View the full code
//@version=6
// ─────────────────────────────────────────────────────────────────────────────
// Volume Profile Lite — ProEA Lab
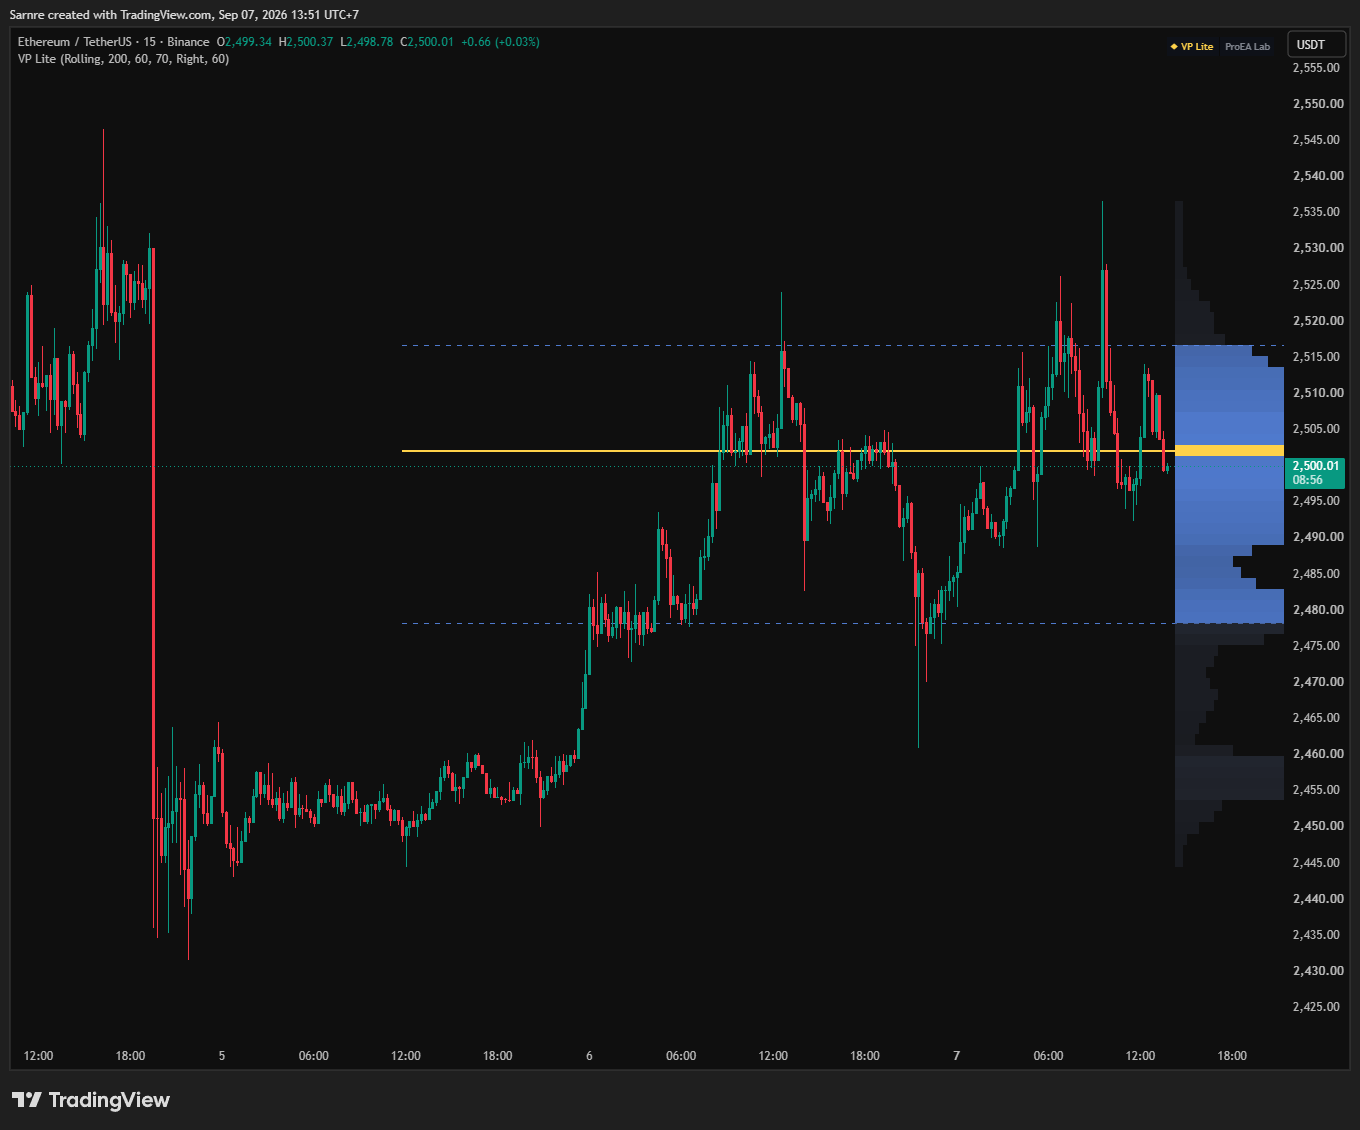
// Free & open-source volume-at-price: the value-area histogram with POC,
// VAH and VAL, in Session or Rolling mode.
//
// Honest by design:
//  · Engine = bar-distribution: each bar's volume is spread across its
//    [low, high] range into price rows — an approximation, not tick data.
//  · The profile redraws as the live bar develops; closed-bar history is
//    read as-is and never rewritten.
//  · Context, not signals — it shows where volume traded, never what price
//    will do.
//
// © ProEA Lab — source available for download.
// ─────────────────────────────────────────────────────────────────────────────
indicator("Volume Profile Lite — ProEA Lab", "VP Lite", overlay = true, max_boxes_count = 200, max_lines_count = 50, max_labels_count = 20)

// ───────────────────────── Inputs ─────────────────────────
gP = "Profile"
inMode     = input.string("Rolling", "Mode", options = ["Rolling", "Session"], group = gP, tooltip = "Rolling = the last N bars. Session = the current day's profile.")
inLookback = input.int(200, "Rolling lookback (bars)", minval = 20, maxval = 500, group = gP)
inBins     = input.int(60, "Rows (bins)", minval = 10, maxval = 120, group = gP, tooltip = "Price resolution of the histogram.")
inVApct    = input.float(70, "Value Area %", minval = 50, maxval = 90, group = gP) / 100.0

gS = "Style"
inAnchor   = input.string("Right", "Profile side", options = ["Right", "Left"], group = gS, tooltip = "Right = profile to the right of the last bar. Left = overlays the start of the window.")
inWidth    = input.int(60, "Profile width (bars)", minval = 10, maxval = 150, group = gS)
inShowLvls = input.bool(true, "Show POC / VAH / VAL lines", group = gS)
inShowTags = input.bool(true, "Show price tags", group = gS)

// ───────────────────────── Fixed Aurora palette ─────────────────────────
color cVA  = #5B8DEF       // value-area rows
color cPOC = #FFD24A       // point of control
color cOut = #3A4257       // rows outside the value area
color cTxt = #C9CEDA
color cPnl = #0E1118
color cInk = #0B0E14

// ───────────────────────── History buffer ─────────────────────────
// 2000 bars covers a full 1-minute session (~1440 bars); the Session loop is
// hard-capped to the same depth so lower timeframes degrade gracefully.
max_bars_back(high, 2000)
max_bars_back(low, 2000)
max_bars_back(volume, 2000)

float rHi = ta.highest(high, inLookback)
float rLo = ta.lowest(low, inLookback)

// session tracking
bool newDay = ta.change(time("D")) != 0
var float sHi = high
var float sLo = low
var int   sStart = bar_index
if newDay
    sHi := high
    sLo := low
    sStart := bar_index
else
    sHi := math.max(sHi, high)
    sLo := math.min(sLo, low)

// ───────────────────────── Pools + header chip ─────────────────────────
var array<box>   g_boxes = array.new<box>()
var array<line>  g_lines = array.new<line>()
var array<label> g_lbls  = array.new<label>()
var table hdr = table.new(position.top_right, 2, 1, border_width = 1, border_color = #00000055)

f_clear() =>
    for b in g_boxes
        box.delete(b)
    array.clear(g_boxes)
    for l in g_lines
        line.delete(l)
    array.clear(g_lines)
    for t in g_lbls
        label.delete(t)
    array.clear(g_lbls)

// ───────────────────────── Build + render on the last bar ─────────────────────────
if barstate.islast
    f_clear()
    bool  sess  = inMode == "Session"
    float gHi   = sess ? sHi : rHi
    float gLo   = sess ? sLo : rLo
    int   loopN = sess ? math.min(bar_index - sStart + 1, 2000) : math.min(inLookback, bar_index + 1)
    float rng   = gHi - gLo
    if rng > 0 and loopN > 0 and not na(volume)
        float binSz = rng / inBins
        array<float> vol = array.new_float(inBins, 0.0)

        // Fast engine: distribute each bar's volume across its [low, high] span,
        // overlap-weighted per row (the same binning contract as the full engine).
        for i = 0 to loopN - 1
            float bl = low[i]
            float bh = high[i]
            float bv = nz(volume[i])
            if bv > 0 and bh >= bl
                if bh == bl
                    int idx = math.max(0, math.min(inBins - 1, int(math.floor((bl - gLo) / binSz))))
                    array.set(vol, idx, array.get(vol, idx) + bv)
                else
                    int b0 = math.max(0, math.min(inBins - 1, int(math.floor((bl - gLo) / binSz))))
                    int b1 = math.max(0, math.min(inBins - 1, int(math.floor((bh - gLo) / binSz))))
                    float span = bh - bl
                    for b = b0 to b1
                        float binLo = gLo + b * binSz
                        float ov = math.min(bh, binLo + binSz) - math.max(bl, binLo)
                        if ov > 0
                            array.set(vol, b, array.get(vol, b) + bv * ov / span)

        // totals + POC
        float maxV = 0.0
        int  pocIdx = 0
        float totV = 0.0
        for b = 0 to inBins - 1
            float v = array.get(vol, b)
            totV += v
            if v > maxV
                maxV := v
                pocIdx := b

        // value area: expand row-by-row around the POC toward the richer side
        float acc = array.get(vol, pocIdx)
        int up = pocIdx
        int dn = pocIdx
        float target = totV * inVApct
        while acc < target and (up < inBins - 1 or dn > 0)
            float vUp = up < inBins - 1 ? array.get(vol, up + 1) : -1.0
            float vDn = dn > 0 ? array.get(vol, dn - 1) : -1.0
            if vUp >= vDn
                up += 1
                acc += math.max(vUp, 0.0)
            else
                dn -= 1
                acc += math.max(vDn, 0.0)

        float vah = gLo + (up + 1) * binSz
        float val = gLo + dn * binSz
        float poc = gLo + (pocIdx + 0.5) * binSz

        int gap   = 2
        int xBase = inAnchor == "Left" ? math.max(0, bar_index - loopN - gap) : bar_index + gap
        int xl    = math.max(0, bar_index - loopN)
        int xrr   = bar_index + inWidth + gap

        // histogram — solid rows, value-area highlight, POC in gold
        if maxV > 0
            for b = 0 to inBins - 1
                float v = array.get(vol, b)
                if v > 0
                    int len = int(math.round(inWidth * v / maxV))
                    if len >= 1
                        float binLo = gLo + b * binSz
                        float binHi = binLo + binSz
                        float ratio = v / maxV
                        bool inVA = b >= dn and b <= up
                        color c = b == pocIdx ? cPOC : inVA ? cVA : cOut
                        int  tp = b == pocIdx ? 0 : math.min(90, inVA ? int(14 + (1 - ratio) * 26) : int(48 + (1 - ratio) * 30))
                        array.push(g_boxes, box.new(xBase, binHi, xBase + len, binLo, border_color = na, bgcolor = color.new(c, tp)))

        // POC / VAH / VAL lines
        if inShowLvls
            array.push(g_lines, line.new(xl, poc, xrr, poc, color = cPOC, width = 2))
            array.push(g_lines, line.new(xl, vah, xrr, vah, color = color.new(cVA, 15), style = line.style_dashed))
            array.push(g_lines, line.new(xl, val, xrr, val, color = color.new(cVA, 15), style = line.style_dashed))

        // price tags
        if inShowTags
            int xt = xrr + 1
            array.push(g_lbls, label.new(xt, poc, "POC " + str.tostring(poc, format.mintick), style = label.style_label_left, color = color.new(cPOC, 8), textcolor = cInk, size = size.small))
            array.push(g_lbls, label.new(xt, vah, "VAH " + str.tostring(vah, format.mintick), style = label.style_label_left, color = color.new(cVA, 30), textcolor = #ffffff, size = size.tiny))
            array.push(g_lbls, label.new(xt, val, "VAL " + str.tostring(val, format.mintick), style = label.style_label_left, color = color.new(cVA, 30), textcolor = #ffffff, size = size.tiny))

        // header chip
        table.cell(hdr, 0, 0, "◆ VP Lite", text_color = cPOC, text_size = size.small, text_halign = text.align_left, bgcolor = cPnl)
        table.cell(hdr, 1, 0, "ProEA Lab", text_color = color.new(cTxt, 40), text_size = size.small, text_halign = text.align_right, bgcolor = cPnl)