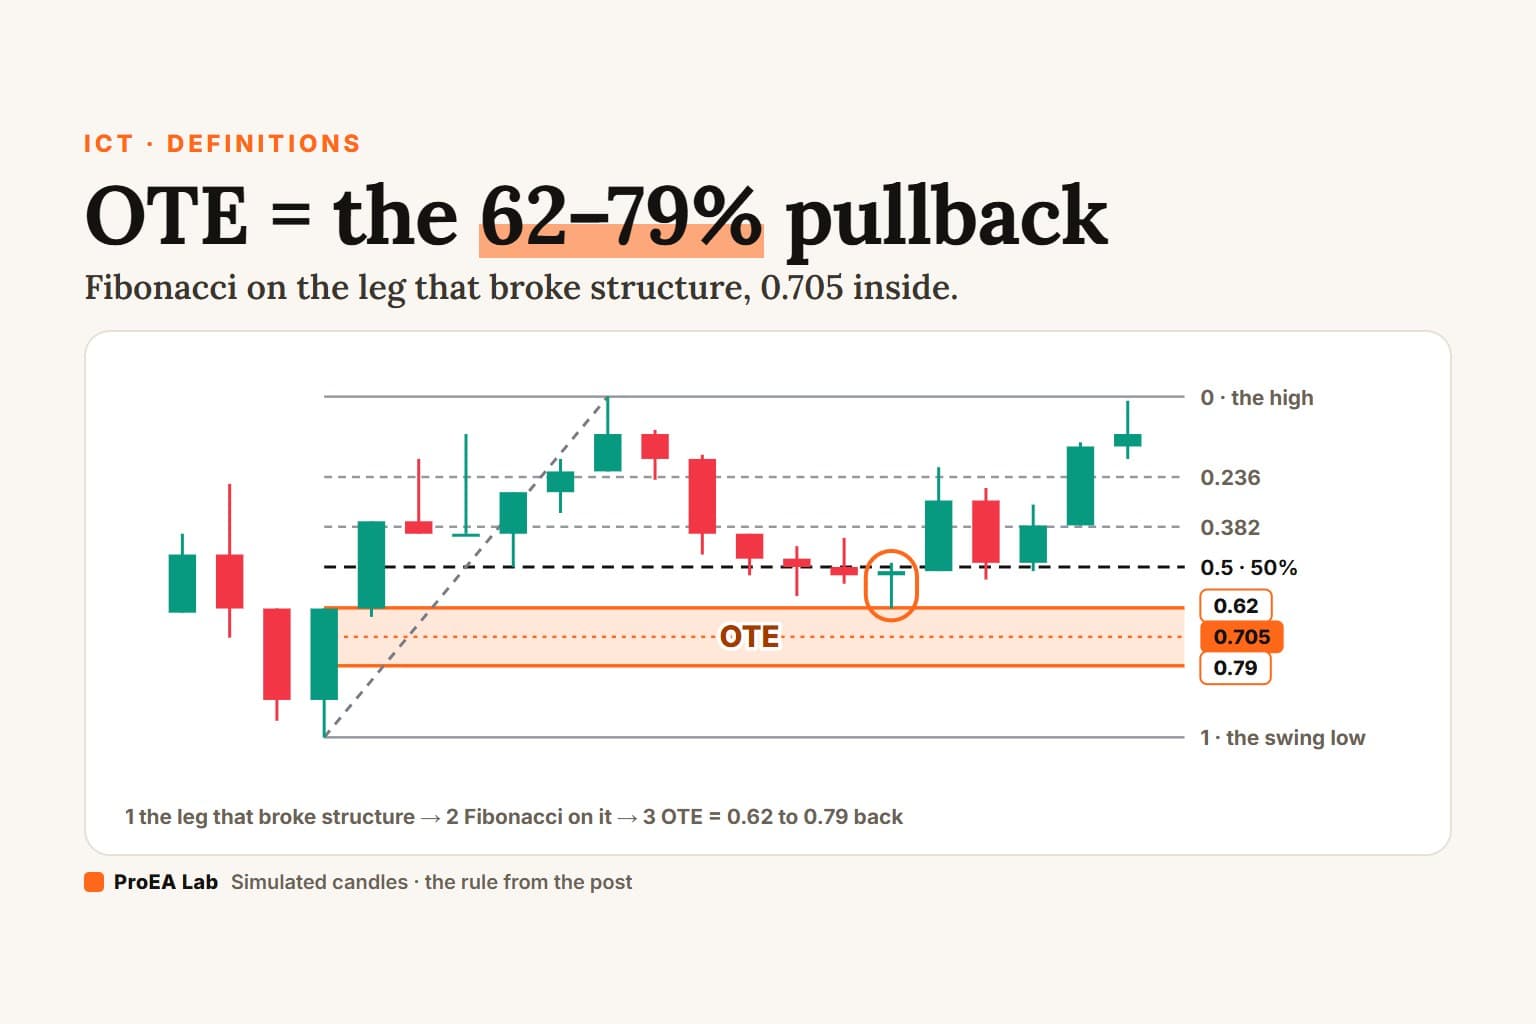
ICT's optimal trade entry (OTE) is the 62% to 79% retracement of a price leg, with 70.5% as its sweet spot. Draw a Fibonacci retracement on the leg that last broke structure, from its swing low to its high for a long, and OTE is the band from 0.62 to 0.79 back down from the high: past the 50% line, deep in discount. For a short, it's the same band back up from the low. ICT's 0.62 and 0.79 are Fibonacci's 0.618 and 0.786, rounded.
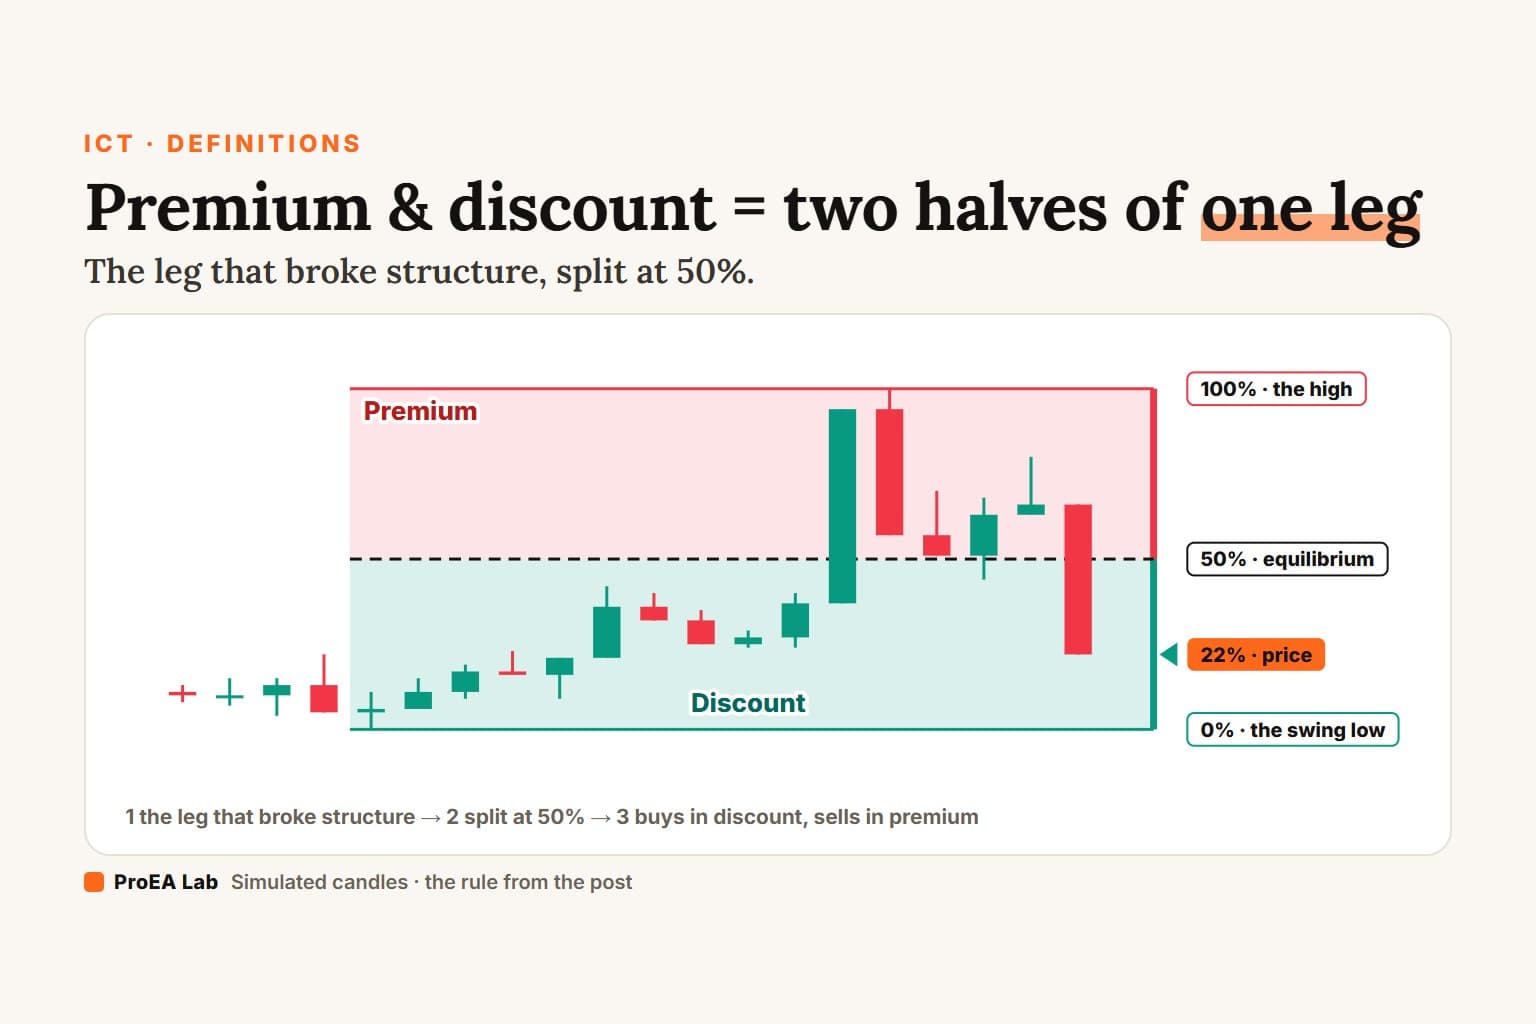
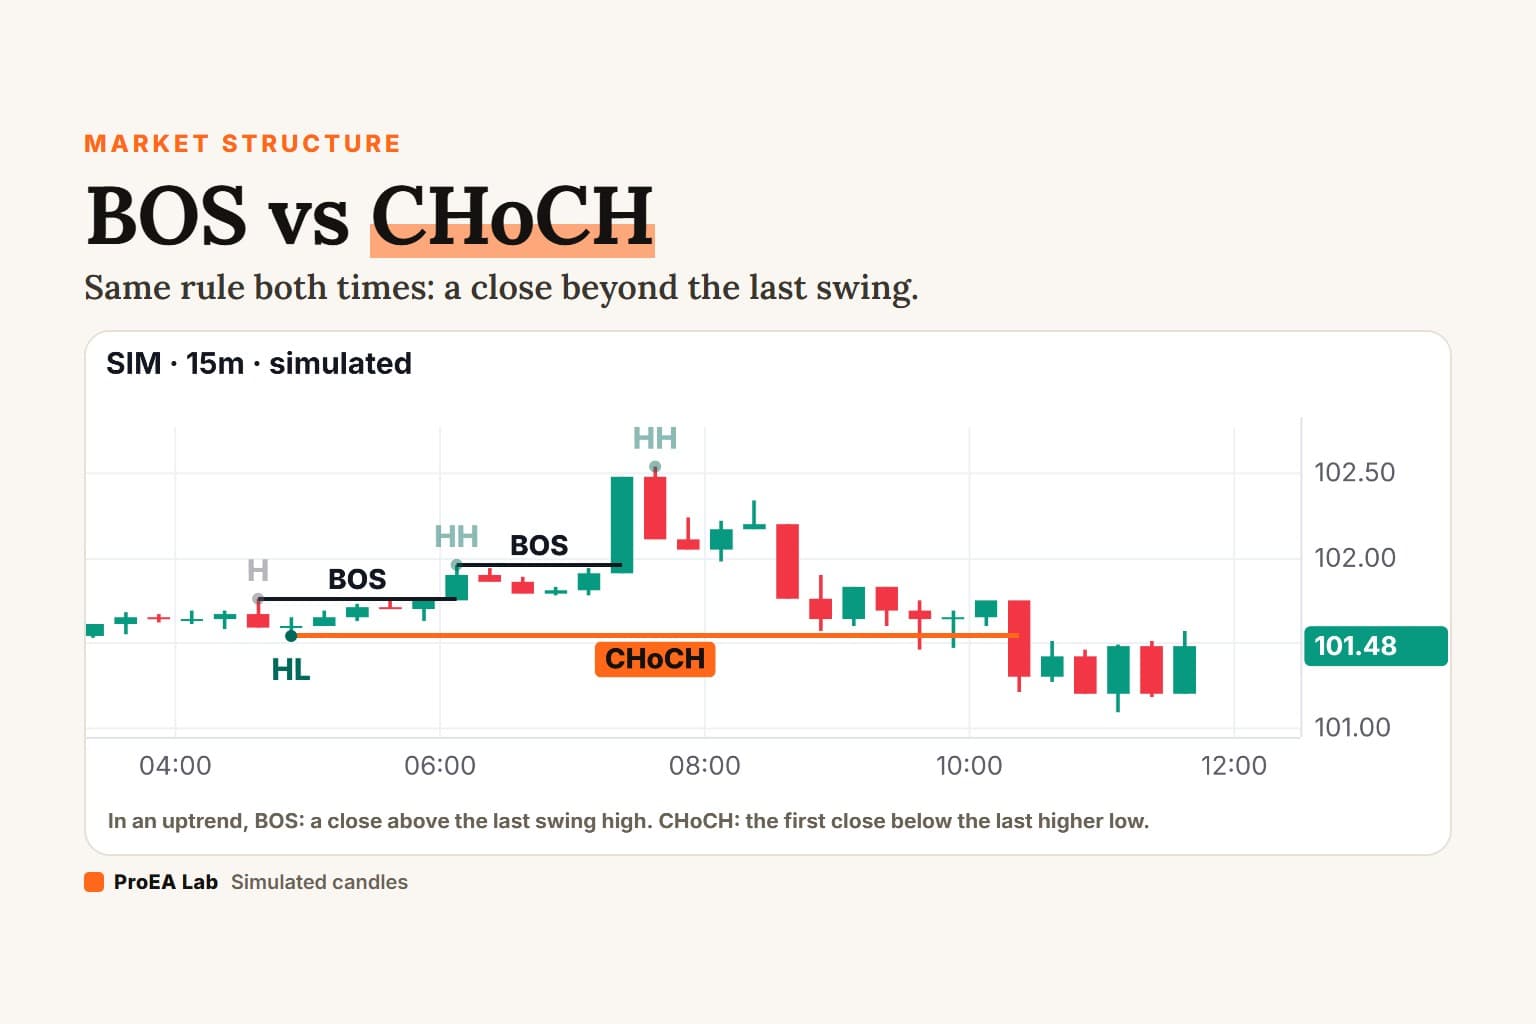
The levels are arithmetic. The leg is the hard part, so this page uses one written rule for it, and every chart below is a replay of simulated candles read by that rule. The leg is the dealing range from our premium and discount page, with the same 50% line and the same OTE. It builds on BOS vs CHoCH.
What is OTE in ICT trading?
An entry zone inside a pullback. ICT, the Inner Circle Trader, teaches it as a retracement of the last move. innercircletrader.net defines it as "the fibonacci retracement zone between an established high and low from which I expect price to reverse" and adds: "The precise OTE level is 0.705. Any value between 0.62 and 0.79 still sits inside the OTE range and is tradable." (ICT OTE guide, published 26 Oct 2024, last updated 3 May 2026, checked 2026-10-04).
The idea is the one behind every pullback entry: don't buy the move that already happened, buy it back cheaper. OTE says how much cheaper.
Simulated 15-minute candles, not market data. Swings are confirmed by 3 candles on each side; the leg is this article's rule, the one that made the last break. Grey: the Fibonacci levels charting tools draw. Orange: ICT's OTE levels, 0.62, 0.705 and 0.79.
Read as text
- A candle closes above the last swing high at 85.50: a BOS. The leg that did it starts at the last swing low, 84.89.
- The leg's high, 85.71, is confirmed as a swing high 3 candles after it printed. From that close the levels count: the leg runs from 84.89 to 85.71.
- A Fibonacci retracement drawn on that leg puts 0.236 at 85.52, 0.382 at 85.40, 0.5 at 85.30, 0.618 at 85.20 and 0.786 at 85.07.
- OTE is 0.62 to 0.79 of the leg, back from the high: 85.20 to 85.06, with 0.705 at 85.13. The 50% line, equilibrium, is 85.30. 0.62 is 0.00 from 0.618 here, and 0.79 is 0.00 from 0.786.
- 3 candles after the levels began to count, a wick reaches 85.20: the first tap of OTE, 62.2% of the way back. In this bullish leg, buys are looked for there. The film ends 5 candles after the tap, wherever price is.
How this window was chosen: The first 15-minute window after the premium-and-discount article's windows in which a bullish leg at least 4 average candles tall, whose origin is the lowest price between that swing low and the break, has its high confirmed as a swing high, and a later candle, not the one that confirms the high, is the first to trade into the OTE band, at least 5 candles before the window ends.
Use itWait for the leg's high to be confirmed, then draw from the swing low to that high. OTE is 0.62 to 0.79 back down.
Watch outA wick into the band is a tap, not a reversal. Price is free to keep going, through 0.79 and past the low.
Fibonacci retracement levels vs ICT's OTE levels
Mostly the same lines. A Fibonacci retracement tool splits a leg at fixed ratios. ICT keeps 0.5, rounds two ratios, and adds one:
| Level | Fibonacci tools | ICT | Bullish leg: up from the low |
|---|---|---|---|
| 0.236 | yes | 76.4% | |
| 0.382 | yes | 61.8% | |
| 0.5 | yes | equilibrium | 50% |
| 0.618 | yes | 0.62, where OTE starts | 38% |
| 0.705 | no | the sweet spot | 29.5% |
| 0.786 | yes | 0.79, where OTE ends | 21% |
| 1 | the leg's start | the stop goes beyond it | 0% |
What the tools and guides say, all checked 2026-10-04:
- Investopedia (updated 26 Sep 2026): "Most trading platforms feature Fibonacci retracement tools that automatically generate key levels, including 38.2%, 50%, 61.8%, and 78.6%."
- TradingView's help center names "key levels of 23.6%, 38.2%, 61.8% and 100%", and its tool takes up to 24 levels, custom ratios included.
- ictkillzone.com (published May 2026) on 70.5%: "Not a standard Fibonacci level — must be manually added to your charting platform."
- LuxAlgo's library (no date shown) writes the band from 61.8% and adds: "Some templates round to 62% and 79% or plot 0.786 explicitly."
The rounding barely matters: 0.62 is 0.2% of the leg away from 0.618, and 0.79 is 0.4% away from 0.786. On a leg 100 points tall, that's 0.2 and 0.4 points.
OTE is a Fibonacci retracement with two levels rounded and one added. What ICT adds that matters is the leg.Which leg do you draw the Fibonacci on?
The leg that broke structure, from where it started to how far it has gone. The guides agree on that in words and split on the anchor:
- innercircletrader.net: "The dealing range must use the most recent established high and low — not arbitrary swing points."
- LuxAlgo: "Pick the impulse leg: a displacement that breaks structure in the intended direction, with an unambiguous swing low and swing high."
- ictkillzone.com: "The 100% Fibonacci anchor must be the liquidity sweep wick extreme — not a candle body, not an arbitrary preceding swing."
- Forexbee (updated 7 Sep 2026): "wait for the price to pull back into it after the leg high forms."
Investopedia names the problem for every Fibonacci user: "the biggest challenge is the subjectivity in selecting swing points, as different traders choose different high and low points, leading to conflicting retracement levels."
So here is one rule.
The rule
OTE rule
15-minute candles; a swing is confirmed 3 candles a side.
1. The leg: after a close beyond the last confirmed swing
   (a break of structure), from the last confirmed swing on
   the other side (the origin) to the furthest price since
   (the extreme). Every new extreme moves the extreme.
2. The levels: a retracement k sits k of the way back from
   the extreme toward the origin. OTE = 0.62 to 0.79, with
   0.705 inside. 0.5 = equilibrium.
3. The levels count once the extreme is confirmed as a swing.
   Before that, every new extreme moves every level.
4. The tap: the first candle from that close on whose wick
   reaches 0.62, measured on the levels as they stood at the
   close before it.
5. The leg ends at the next break of structure, either way,
   or at a close beyond the origin, whichever comes first.
   Its levels end with it.
Steps 1 and 2 are the premium and discount page's range, word for word, so this page's 0.5 is that page's equilibrium. Step 3 is the guides' "established high", made checkable: confirmed by 3 candles a side, as on the BOS vs CHoCH page. Step 5 takes LuxAlgo's "a move beyond the leg's origin invalidates the setup" as a close, the way ictkillzone.com does ("A candle BODY close beyond 100% = OTE invalidated"), and adds the next break of structure, which replaces the leg.
Why do the OTE levels move?
Because the extreme moves. Draw the Fibonacci the moment the leg breaks structure and every new high drags the whole band up with it. A wick that looked like an OTE tap on the early drawing can end up somewhere else on the leg.
Simulated 15-minute candles, not market data. Swings are confirmed by 3 candles on each side; the leg is this article's rule, the one that made the last break. The faint steps show where the band stood after each close.
Read as text
- A candle closes above the last swing high at 132.59: a CHoCH. The leg that did it starts at the last swing low, 132.08.
- Drawn at that close, the leg runs from 132.08 to 132.62, so OTE is 132.29 to 132.19.
- The next candle's wick reaches 132.27, inside that band. On a chart drawn at the break, that looks like an OTE tap.
- Then the leg makes 4 new highs, up to 133.17. Every new high moves every level: OTE ends up at 132.49 to 132.31.
- The high is confirmed 3 candles after it printed. Measured on the leg the rule draws, the early wick was 82.6% of the way back, past OTE.
How this window was chosen: The first window in which a bullish leg at least 4 average candles tall makes new highs on at least 2 candles after the break, a candle trades to the 0.62 level of the leg as it stood before the leg's high printed, and that high is then confirmed as a swing high. Each film's window starts after the windows of the films above it, so no two films share candles.
In our simulated year, 1,812 legs had their extreme confirmed. In 1,654 of them, the extreme moved after the candle that broke structure, and half of those were at least 1.68 times as tall by the time it was confirmed as they were at that close. That's random prices, so it says nothing about how often real legs extend; it shows how easily an early drawing goes stale.
Use itDraw once the extreme is confirmed. Until then, treat every level as a guess that the next high will move.
Watch outForexbee: entering before the retracement 'is considered too early in this approach'. Drawing before the high is the same mistake one step earlier.
OTE vs the 50% line
OTE is the deep half of discount. The 50% line is where discount starts; OTE starts at 0.62. The difference is geometry. With a stop beyond the leg's low and its high as the first target, the high is as far away as the low from 50%, 1.6 times as far from 0.62, 2.4 times from 0.705 and 3.8 times from 0.79.
Simulated 15-minute candles, not market data. Swings are confirmed by 3 candles on each side; the leg is this article's rule, the one that made the last break. The × figures are distances inside the leg, not odds.
Read as text
- A candle closes above the last swing high at 126.33: a BOS. The leg that did it starts at the last swing low, 125.83.
- The leg's high, 126.65, is confirmed as a swing high 3 candles after it printed. From that close the levels count: the leg runs from 125.83 to 126.65.
- OTE is 0.62 to 0.79 of the leg, back from the high: 126.14 to 126.00, with 0.705 at 126.07. The 50% line, equilibrium, is 126.24.
- A wick reaches the 50% line at 126.24: price is in discount. From there, the high is as far away as the low (1.0×). At 0.62 it is 1.6× as far, at 0.705 2.4×, at 0.79 3.8×. That's geometry, not odds.
- 3 candles later a wick reaches 0.62, 126.14: the tap. 3 candles later, a candle closes below the swing low at 125.83: a CHoCH. The leg is gone, and so is its OTE. The film ends 5 candles after the tap.
How this window was chosen: The first window in which a bullish leg at least 4 average candles tall has its high confirmed, one candle reaches the 50% line and a later candle is the first to reach the 0.62 level, at least 5 candles before the window ends. Each film's window starts after the windows of the films above it, so no two films share candles.
The price of that geometry is that price has to come further. In the simulated year, the pullback reached 50% in 638 of the 1,812 legs and 0.62 in 503. So 135 pullbacks turned in discount without filling OTE, and 87 of those legs then broke structure the same way. Past 0.79 went 354; a wick reached the leg's origin in 253. These counts depend on how we built the simulation and say nothing about real markets.
And a bigger target isn't free. In prices with no memory and no drift, a random walk, the chance of reaching the high before the low equals the distance to the low as a share of the leg: from 0.705, 29.5%. That exactly pays for a target 2.4 times as far, so every level breaks even before costs. Any edge OTE has would have to come from the market, not from the ratios. LuxAlgo puts it plainly: "The ratios themselves have no mechanical force".
Our Location Desk draws the same leg's 50% line. Its continuation band is 5% either side of it, 45% to 55% back, so it doesn't overlap OTE at all.
What happens after the OTE tap?
The tap is where OTE says to look, not a result. After it, the rule waits for the leg to end: a break the same way starts a new leg with new levels; a break the other way, or a close beyond the origin, ends the leg and its OTE.
Simulated 15-minute candles, not market data. Swings are confirmed by 3 candles on each side; the leg is this article's rule, the one that made the last break. Once the leg ends, its levels turn grey.
Read as text
- A candle closes above the last swing high at 168.62: a BOS. The leg that did it starts at the last swing low, 167.38.
- The leg's high, 169.40, is confirmed as a swing high 3 candles after it printed. From that close the levels count: the leg runs from 167.38 to 169.40.
- OTE is 0.62 to 0.79 of the leg, back from the high: 168.15 to 167.80, with 0.705 at 167.98. The 50% line, equilibrium, is 168.39.
- 1 candles later a wick reaches 168.15: the tap, 66.8% back. Price keeps going: past 0.79, 96% back at the deepest.
- 19 candles later, a candle closes above the swing high at 169.40: a BOS. That break ends this leg and starts a new one, with new levels.
How this window was chosen: The first window in which a bullish leg at least 4 average candles tall has its high confirmed, a later candle, not the one that confirms the high, is the first to reach the 0.62 level, and a later candle ends the leg with a close above a swing high (a BOS), at least 5 candles before the window ends. Each film's window starts after the windows of the films above it, so no two films share candles.
In the simulated year, 503 legs tapped OTE. For 165 of them the next break went the same way; for 324 it went the other way (a CHoCH), and 14 closed beyond the origin first. In 202 of the 503, the tap came on the very candle that confirmed the extreme: the pullback reached the band while the levels were still being confirmed. These counts come from random prices with no orders behind them, and say nothing about how often OTE holds in a real market.
Use itWrite down what ends the idea before the tap: a close below the leg's origin, or a close below the last swing low, whichever comes first.
Watch outinnercircletrader.net calls OTE 'one of the most reliable models in the ICT toolkit' and shows no data for it. Neither does any guide above.
Does OTE need a killzone?
Not by definition. innercircletrader.net: "There is no specific time of day for OTE itself. That said, kill-zone times deliver the cleanest setups because volatility is concentrated there." Our rule has no clock. If you add one, the ICT killzones page has the hours in New York time and on your own clock, daylight saving time included.
How to trade OTE, step by step
- Fix the timeframe and the swing length before you look.
- Find the last break of structure, on a close.
- Draw the leg: the last opposite swing to the furthest price since the break.
- Wait for the extreme to be confirmed as a swing. Then draw the Fibonacci, with 0.62, 0.705 and 0.79 added.
- Bullish leg: OTE is below 50%, in discount. Bearish leg: above it, in premium.
- Pick what you enter on inside the band, before price gets there: a close, an order block or a CHoCH on a lower timeframe.
- Stop beyond the leg's origin. Redraw at the next break of structure.
Common mistakes
- Drawing before the high is confirmed. The next high moves every level.
- Drawing on a leg that didn't break structure. Any two points make a Fibonacci; only one makes this rule's leg.
- Keeping an old leg after a new break of structure. Its levels are just lines.
- Treating 0.705 as a floor. In 354 of the 503 simulated legs that tapped OTE, price went on past 0.79.
- One leg for the Fibonacci, another for premium and discount. Two legs, two 50% lines, two answers.
- Reading the ratio as odds. 2.4 times as far is distance, not probability.
Does OTE work?
Which tools draw OTE or Fibonacci levels?
None of ours. We read the Pine source of every free desk and every indicator we sell: none draws a Fibonacci retracement or the 0.62, 0.705 and 0.79 levels.
The leg on your own chart, free. Location Desk draws this page's 50% line as "Leg 50 %": the middle of the leg from the swing the break started at to the extreme reached since, on by default. Its panel prints the leg's two ends. Its swings take 5 candles a side by default (this page uses 3). Put TradingView's own Fibonacci retracement on the same two points and add 0.62, 0.705 and 0.79 as custom levels. Signal Desk labels the BOS and CHoCH that start and end each leg, on closed candles.
ICT Levels Desk splits a different range at 50%: the previous day's high and low. The SMC AI-Scored Toolkit (v1.4.2) doesn't draw OTE or Fibonacci levels either; it scores order blocks and fair value gaps.
More concepts, each with one rule and its own replays: smart money concepts. For the reversal that often comes before an OTE leg, see the liquidity sweep.
Disclosure
We build Location Desk, Signal Desk and ICT Levels Desk and give them away; we sell other indicators, including the SMC AI-Scored Toolkit. We have no relationship with innercircletrader.net, LuxAlgo, ictkillzone.com, Forexbee, Investopedia or TradingView. Nothing here is financial advice.
Use these animations on your site.