
Strategy twin
signal-desk-strategy.pine
The same rules with costs, in TradingView's Strategy Tester; Basic allows two indicators per chart, so give it a second chart.
It grades every trigger, skips the chase, and plans the exit before you enter.
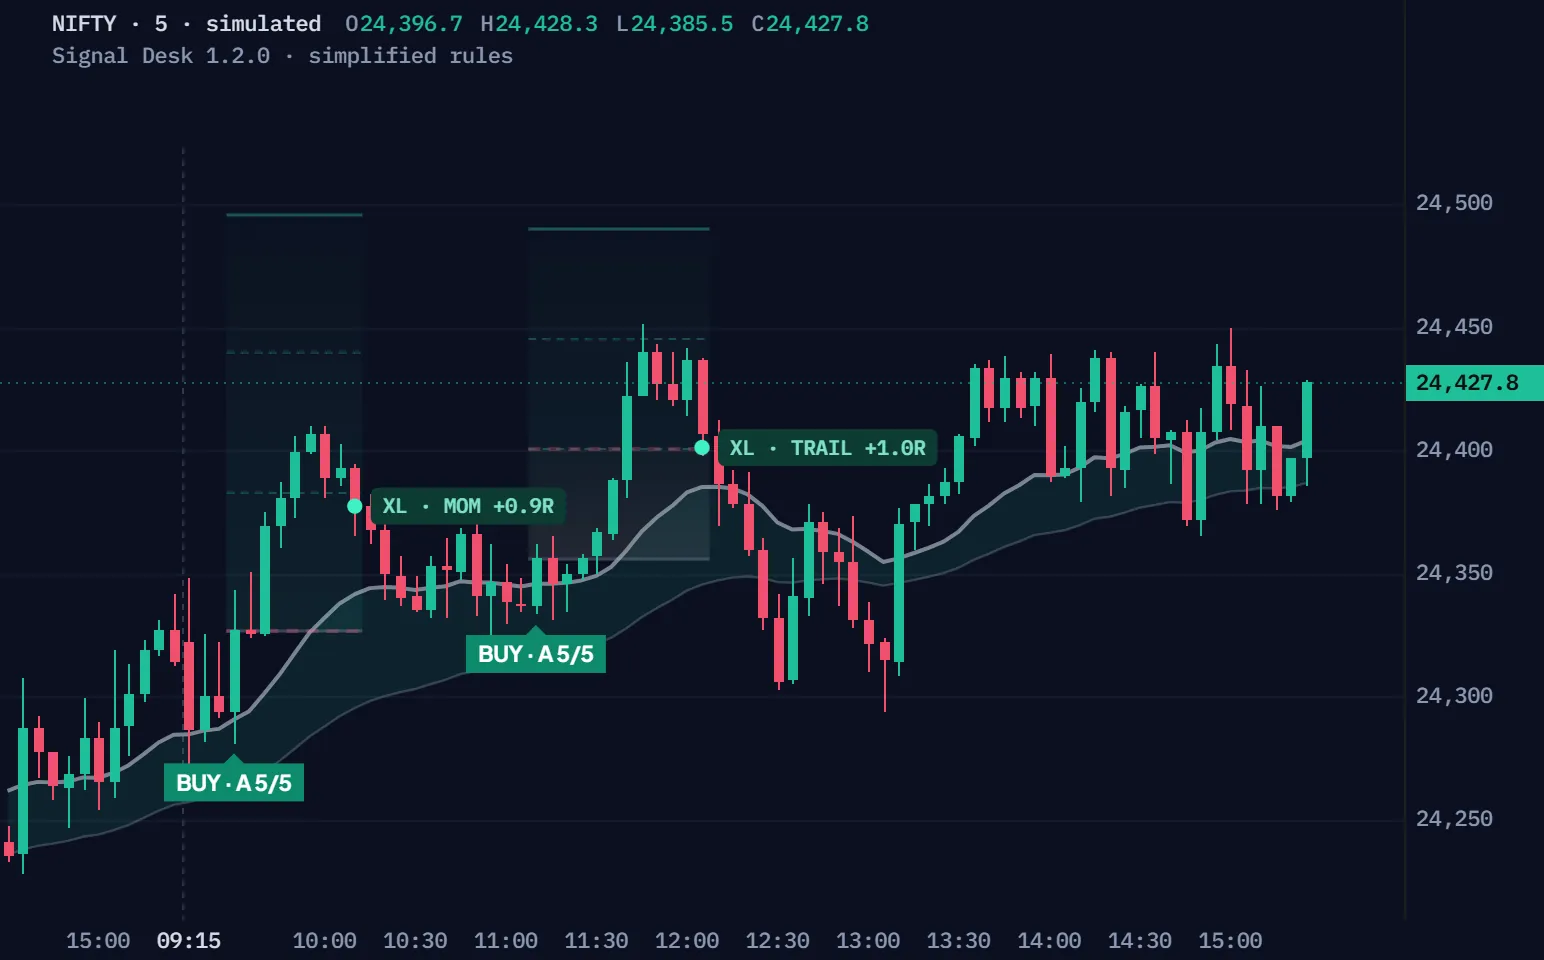
Session 1 · first to reach TP1
Simulated 5-minute bars, not a real market, run through Signal Desk's rules, simplified for the browser. Quiet bars run as a time-lapse; the bars that matter slow down. Session 1 is the first simulated session whose first signal reaches TP1, so every step shows; Another session plays the next simulated sessions with a signal that closes that day, win or loss.
| Time | Event | Prices |
|---|---|---|
| 09:30 | BUY · A 5/5 (all five pass) | Entry 24,326.9 · stop 24,270.5 · TP1 24,383.2 · TP2 24,439.6 · TP3 24,495.9 |
| 09:45 | TP1 · stop to breakeven | TP1 24,383.2 |
| 10:10 | XL · MOM +0.9R · RSI losing its average | Exit 24,377.3 |
| 11:10 | BUY · A 5/5 (all five pass) | Entry 24,356.3 · stop 24,311.6 · TP1 24,401.1 · TP2 24,445.8 · TP3 24,490.6 |
| 11:40 | TP1 · stop to breakeven | TP1 24,401.1 |
| 11:45 | TP2 · stop to TP1, trail on | TP2 24,445.8 |
| 12:05 | XL · TRAIL +1.0R · the trail | Exit 24,401.1 |
Full Pine v6 source in Pine Pro Library. It draws on your chart; you place the trades.
Five checks grade every trigger: five is an A, four is a B, and below B it stays quiet.
4 of 5, no chase. It fires.
Simulated 5-minute bars, simplified rules; the checks read for longs and mirror for shorts. The session is the first simulated one with a refused trigger in the 30 bars before a taken signal.
B is the default minimum; a grade counts agreement, not a probability.
Price touches the fast EMA within three candles, then closes back beyond it as momentum turns.
The panel shows them as information; by default they never block an entry.
0 to 100, learned from practice brackets on your own chart, and information only by default.
Built for the trader tired of entering right after an oversized candle: whatever the grade, the gates can still say no.
This is the 12:20 sell from the grade film. Drag it bigger.
A trigger on a candle that big is skipped, whatever its grade.
A close too far from the fast EMA is a chase.
A move that already happened is left alone.
Entries 09:30 to 14:45, a 6-candle cooldown after each exit, square-off at 15:00.
Every entry arrives with a stop and three targets: at TP1 the stop jumps to your entry, and at TP2 it locks in one R.
TP1 moved the stop to entry, TP2 to TP1, then it trailed. TP3 closed it: +3R. Premium, same path: half banked at TP1, half at TP3 → +2.00R.
Drawn paths, not trades, run through simplified stop rules; the Premium line uses Premium's.
The swing plus 0.25 ATR, or 1.5 ATR if the swing is over 2.25 ATR away.
The whole position stays on; only costs and gaps can take it below zero.
One R is locked, then the stop trails 1.5 ATR behind price.
A Supertrend flip, RSI back through its average, or the 15:00 square-off, named on the label.
Two files, the complete v1.2.0, ready for TradingView's Pine Editor.
Every setting can be changed. See the Pine Editor walkthrough
// ═══════════════════════════════════════════════════════════════════════════════// SIGNAL DESK — Options Buyer · Pine Script v6 · v1.2.0// Long / short entries and exits for option-premium and index charts — FEWER, GRADED, and LEARNING.//// WHY IT EXISTS A Nifty options buyer rents two signal tools that fire many times a day and hit the// stop as often as the target — the worst ones right after a big candle. He asked for// "one or two strong calls a day". This is that: every trigger is scored by eight factors// (5 setup + 3 context) into a STRENGTH 0–100, the factor weights are LEARNED from how// trades actually closed on THIS chart (online logistic regression, causal), a chase-veto// skips entries on stretched candles, and a per-day cap + cooldown keep it quiet.// RUNS ON any chart; built for NIFTY option contracts (5-minute) and the index / futures chart// with Options mapping (long = BUY CE, short = BUY PE, ATM strike + expiry in the alert).// STATUS testable draft — compiles clean · confirmed-bar signals (no repaint) · paper P&L has// NO costs · nothing here is a validated edge (see docs/build-report.md). The strategy// twin (signal_desk_strategy.pine) measures the win-% honestly with costs.//// © 2026 ProEA Lab · decision support, never a prediction · built for a Reddit reviewer's feedback// ═══════════════════════════════════════════════════════════════════════════════//@version=6indicator("Signal Desk — Options Buyer", "SigDesk", overlay = true, max_labels_count = 500, max_lines_count = 100, max_boxes_count = 100) // ─────────────────────────────────────────────────────────────────── INPUTS · tradegT = "Trade"inDir = input.string("Both", "Direction", options = ["Both", "Long only", "Short only"], group = gT, tooltip = "On an OPTION premium chart use Long only (you buy the option whose chart signals a long). On the index / futures chart use Both — with Options mapping on, a long = BUY CE and a short = BUY PE.", display = display.none)inMode = input.string("Intraday", "Mode", options = ["Intraday", "Positional"], group = gT, tooltip = "Intraday = any open position exits in the square-off window. Positional = no forced square-off (entries still respect the entry window).", display = display.none)inTrigger = input.string("Pullback", "Entry trigger", options = ["Pullback", "Breakout", "Both"], group = gT, tooltip = "Pullback = trend up, price came back to the fast EMA, then a strong close back above it with momentum turning up (calm: fewer, later). Breakout = a confirmed BOS / CHoCH in the trend direction (earlier, more). Both = either.", display = display.none)inMinGrade = input.string("B", "Signal only when grade ≥", options = ["A", "B", "C"], group = gT, tooltip = "Grade comes from STRENGTH (0–100), the learned model's read of the eight factors: 50 = a typical trigger on this chart, higher = a better-than-typical mix of what has paid here. A ≥ the A threshold · B ≥ the B threshold · C ≥ 50. Lower never fires; in the Pro view they show as faint ghost marks so you can see what was filtered.", display = display.none)inGateMode = input.string("Setup count", "Grade from", options = ["Setup count", "Learned strength"], group = gT,
No coding needed.
signal-desk-strategy.pine
The same rules with costs, in TradingView's Strategy Tester; Basic allows two indicators per chart, so give it a second chart.
Long and short entries, A-only entries, exits, TP1 and TP2, plus a JSON payload for webhooks.
Clean, the default, draws the trend cloud; Pro adds the skipped triggers you saw above.
With the mapping on, longs read BUY CE and shorts BUY PE, with the strike and your expiry.
Every measured number, costs included, lives in the lab notes. Read the lab notes
The page, the films and the manual are open to everyone. Both files, the indicator and its strategy twin, are in Pine Pro Library: $49 once for every desk and every update, or included in the Complete Suite. Sign in to copy or download.
Signals commit on the closed candle and stay. Swings confirm five candles late on purpose, and the 15-minute context reads its last closed bar. Readings on a forming candle can still move, and changing inputs recalculates the chart.
We measured one chart in one window and wrote it up in the lab notes, labelled in-sample. Run the strategy twin on your own chart; it charges costs and slippage. Read the lab notes.
We, ProEA Lab, build Signal Desk and Signal Desk Premium. The code is AI-assisted. Charts on this page show simulated bars and simplified rules, not broker fills. Signals are context for your decision, not instructions. Trading involves risk.
Signal Desk Premium · $49 once
Get itEvery rule, setting and check, one topic at a time.
Signal Desk · Pine Pro Library
Count the checks. Apply the limits. Then see the entry and exit plan.
Draws on your price chart. The indicator does not place orders.
Five setup factors give the grade.
Stretched triggers are refused by rule.
Qualified entries and exits with reasons.
Signal Desk is a TradingView indicator in Pine Pro Library that evaluates a pullback or breakout trigger against an entry checklist. It grades five setup checks, applies chase and daily limits, and displays a reference entry and exit plan. The guide also explains its optional index-to-options labels and separate strategy script.
The grade counts setup checks; it does not override the entry gates. The selected trigger, chase limits, session window, daily allowance, cooldown and existing trade state must also permit an entry on the confirmed candle. Read the entry vetoes
No. Learned strength is a relative score, not a measured win probability. With Grade from set to Setup count, it is informational. Selecting Learned strength uses that score to determine the grade used by entry filtering. Read the strength score limits
No. Options mapping formats a strike and expiry label from the index or futures chart. It does not read an option chain, premiums or Greeks. The displayed entry and risk levels remain prices of the charted instrument. Read the options label limits
Built for an options buyer who wanted fewer signals after oversized candles. Follow the checks below.
It closed higher than it opened. That alone does not tell you whether it meets the tool’s rules.
Fictional examples. The last step compares a different candle, not a candle shrinking over time. ATR, averages and momentum are supplied context.
Test visible entry conditions and exit rules consistently. Profit still depends on price, trade size and costs. A passing grade cannot remove losses.
An options buyer wanted fewer signals, especially after oversized candles. We built a checklist, a limit on daily entries and clear exit rules. The default allows at most two entries a day; some days have none.
Switch cases at the same step.
The last two candles pull back. A touch alone is not an entry. Watch the next closed candle.
Same close: 110. Compare cases without losing your place. “Window closed” changes only the clock: 10:00 to 14:45 in Asia/Kolkata, using the candle’s opening time.
ATR 8; fast/slow EMA 106/101; rising momentum, bullish Supertrend and confirmed structure, pivot low 99. One earlier trade, eight candles since its exit, no open position. The current bar touches the EMA area. These snapshots use the default setup-count rules; the short chart excerpt does not calculate that longer context. The full simulator below does more of the calculation.
No. In the default mode it means all five setup checks agree. It is a count, not a probability. The other entry limits still apply.
Read label → plan → panel.
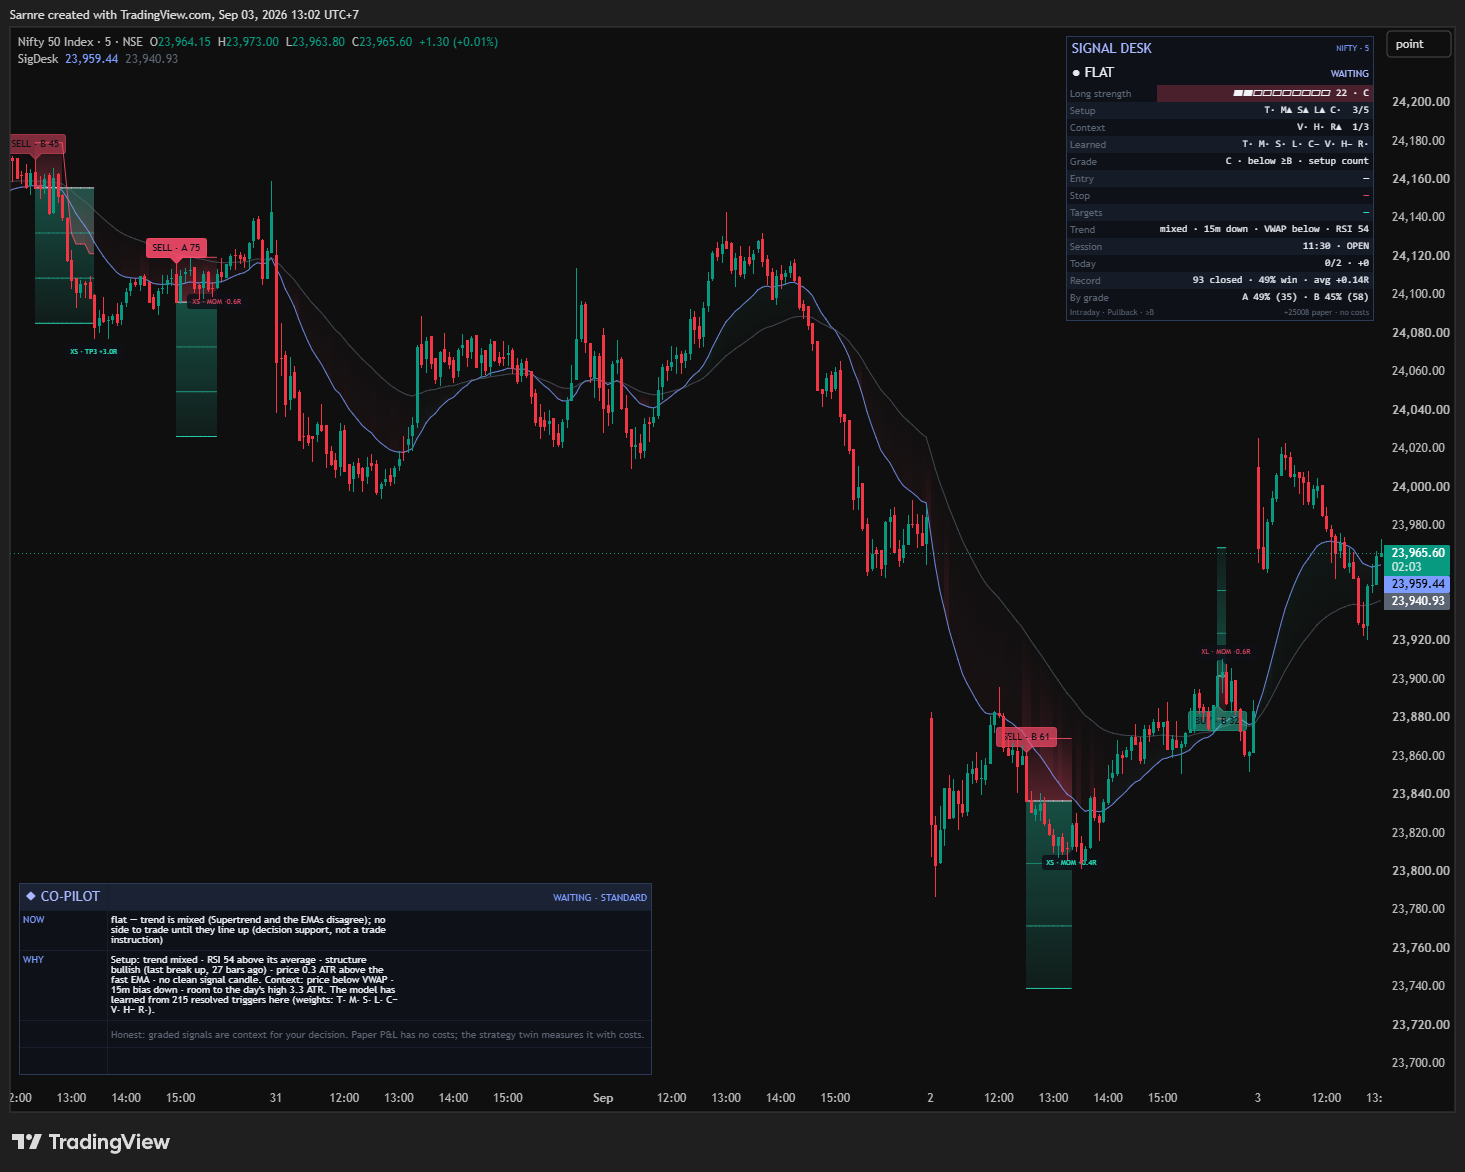
The letter records setup agreement when the entry was marked.
Entry-to-stop is the planned risk distance. Targets show the plan in the other direction.
Setup and Grade explain agreement. Session and Today explain timing and daily capacity.
Change the close, wick or clock. This simulator recalculates averages, momentum and ATR using a longer fictional history; some earlier market state is supplied.
Change the close or wicks. ATR, momentum and entry checks recalculate.
Factors: trend yes, momentum yes, structure yes, location yes, candle yes. RSI 63.60, average 43.99; ATR 14 is 2.64.
Supplied Supertrend: up, bands 100/118; pivots 99/113. Current bands and strict flips recalculate. Strength/context gates off.
Entry 110.00; stop 106.04 uses the 1.5-ATR fallback because the swing is too far. Targets: 113.96 / 117.91 / 121.87.
Illustrative inputs · changing a slider recalculates this example · no market feed
Start on an intraday chart. Both complete Pine v6 source files are in Pine Pro Library.
Create a new indicator on your chart.
Copy it from the code window above and replace the sample code.
Save it. Keep the defaults initially.
Measure the trading rules with costs on a second chart. Read the workflow chapter first.
Download the strategy .pine fileCheck the session timezone and entry window, available history, minimum grade, vetoes, daily allowance and cooldown. The tool can correctly show no entry.
The full rules and settings are here when you need them.
Pullback, the default: price visits the fast average, then gives a strong close beyond it as momentum turns. Trend also needs Supertrend and EMA agreement. A touch alone is insufficient.
Breakout: a close breaks a confirmed swing in the trend direction. BOS marks continuation; CHoCH marks a change from the prior structure direction. Both mode accepts either trigger.
Then come the grade, chase limits, entry window, available daily allowance and position checks. There is one position at a time and normally a six-candle cooldown after exit. A qualifying opposite-signal reversal can reopen on the exit candle, subject to that bar’s gates.
Default grades: A = five, B = four, C = three. Minimum B. Raising the minimum reduces qualifying setups; it does not establish better outcomes.
VWAP side, higher-timeframe direction and proximity to the day’s high/low are three context factors. They and learned strength are information by default, not extra entry gates.
Any one blocks it: candle high–low range above 2.5 ATR; directional stretch from fast EMA above 2 ATR; or range of the last three closes above 3 ATR, with the close beyond the close three candles ago in the entry direction. Exact equality passes.
ATR measures recent price movement, including gaps. For a default pullback, the current candle or one of the previous three must touch within 0.3 ATR of the fast EMA. A strong body occupies at least forty percent of its candle; the wick beyond the close is at most thirty-five percent.
Strength 0–100 is a relative model score, not a chance of winning. Fifty represents the model’s typical factor mix. It affects the grade only if Grade from is changed to Learned strength.
Only one shadow runs at a time; intervening triggers are not separately sampled. Stop wins a same-candle collision. TP1 is 1R by default; thirty candles without resolution trains an outcome of 0.5. This differs from the full managed trade.
The Learned row’s T/M/S/L/C/V/H/R weights cover the five setup factors and three context factors. Plus/minus marks describe learned weights, not proof of a lasting advantage.
1R is the initial entry-to-stop distance. Default targets are 1R, 2R and 3R. TP1 moves the stop to entry; TP2 moves it to TP1 and starts an ATR trail; TP3 ends the plan. TP1 and TP2 do not take partial profits.
The default structure stop uses the farther recent swing or five-candle extreme, plus 0.25 ATR. If its distance exceeds 2.25 ATR, it falls back to 1.5 ATR. The ATR multiple setting changes that fallback, cap and trail.
Each later candle checks the existing stop before targets. A newly moved stop does not apply retroactively to that candle’s earlier wick.
Other exits include Supertrend reversal, RSI crossing its average after at least two candles held, a qualifying opposite signal, Intraday square-off, or the optional time stop before TP1. Exit labels record the reason.
Setup / Grade show agreement; Context / Strength / Learned show supporting readings. Entry, Stop and Targets describe the plan; Trend, Session and Today show direction, time and daily use. Record / By grade summarize closed paper outcomes without costs.
Co-Pilot’s NOW describes the state, WHY gives the readings and PLAN names what follows under the rules. It explains the same engine, not an independent prediction.
Clean shows the trend cloud. Pro adds Supertrend, VWAP, swing labels and faint filtered-trigger marks. Full adds strength coloring and session shading. Minimal reduces the drawings.
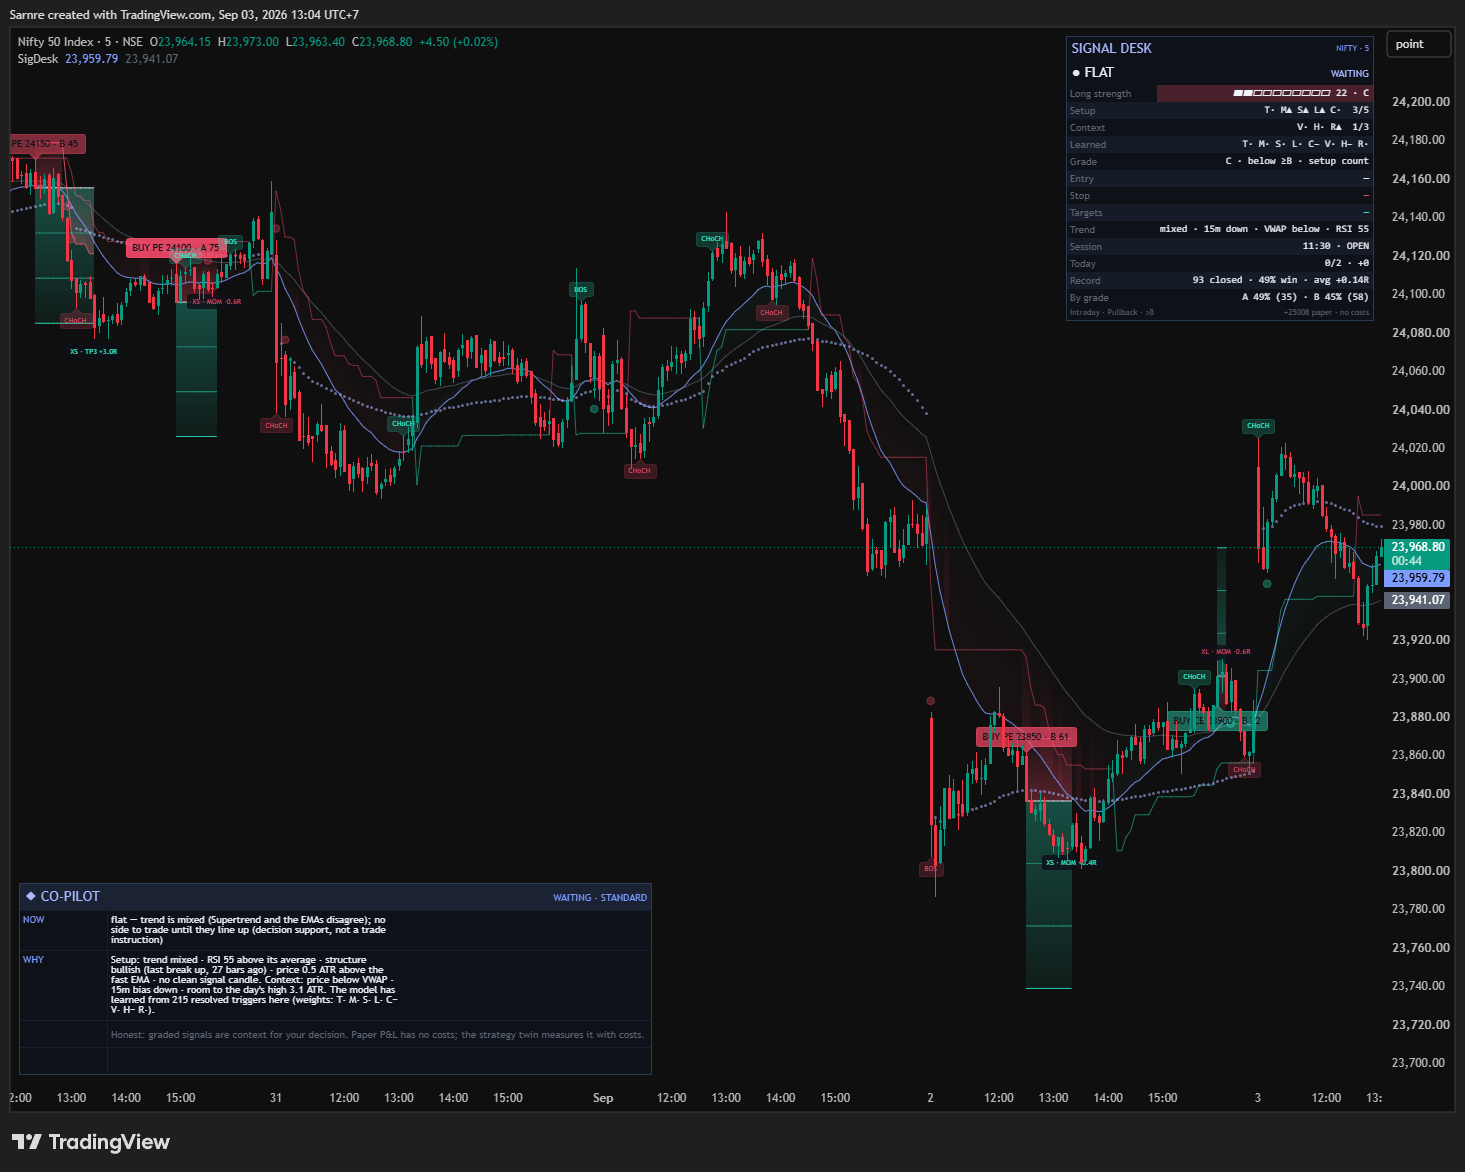
For studying purchases on a call or put premium chart, the tool’s intended configuration is Long only, mapping off. On an index/futures chart, Both with mapping on labels longs BUY CE and shorts BUY PE.
Mapping formats a strike and expiry label. It does not read an option chain, premiums, Greeks or available expiries. Index-derived levels remain index prices. Quantity is an input, not automatic risk sizing.
An EXIT message recalculates its strike from the current price rather than preserving the entry strike. Treat it as descriptive data; it cannot by itself identify the original option contract for execution.
Eight named conditions: long/short entries, their A-only variants, long/short exits, TP1 and TP2. Choose Once Per Bar Close.
Any alert() function call sends ENTRY and EXIT, plus TP1/TP2 milestones by default. Choose JSON or readable text. Payloads include symbol, timeframe and event; entry messages include grade, strength, plan and supplied quantity.
These are indicator events, not broker fill confirmations. The strategy twin has no matching alert configuration.
Indicator defaults below. Change one input at a time.
Choose direction, trigger and grading method. Daily entries are a maximum. Quantity scales paper totals and alert data; it does not size broker orders or recommend current exchange lots.
Turn learning on, control its adjustment speed and limit how long a shadow example can remain unresolved.
Format call/put labels on an index or futures chart. These controls do not read an option chain or place orders.
Both windows use the chosen timezone and candle opening times. Intraday mode uses square-off; Positional still respects the entry window.
Structure or ATR stop; targets in risk multiples. Milestones can move the stop. Optional exits can finish a trade before its final target.
Chase limits block values strictly above the threshold. Touch controls define how near and how recent the return to the average must be.
EMA averages emphasize recent prices. RSI measures momentum. Supertrend tracks direction using ATR, a measure of recent price movement including gaps.
Minimal, Clean, Pro or Full changes the drawings. Themes: Aurora Neon, Royal Gold or Colorblind-safe.
Show, place and resize the readings panel.
Brief gives a headline. Standard adds reasons and a plan. Detailed adds context and limitations. Off hides it.
Choose JSON or readable text, and whether the dynamic alert also sends first and second target milestones.
The twin shares Trade except quantity, Strength, Session, Risk, Filters and Engine inputs. It has no options, panel or alert settings.
Twin header defaults: capital 5,000,000, quantity 75, cash fee 20 per order and one tick of slippage. They are code defaults, not current broker terms. Its fill emulator can differ from the indicator’s stop-first paper record.
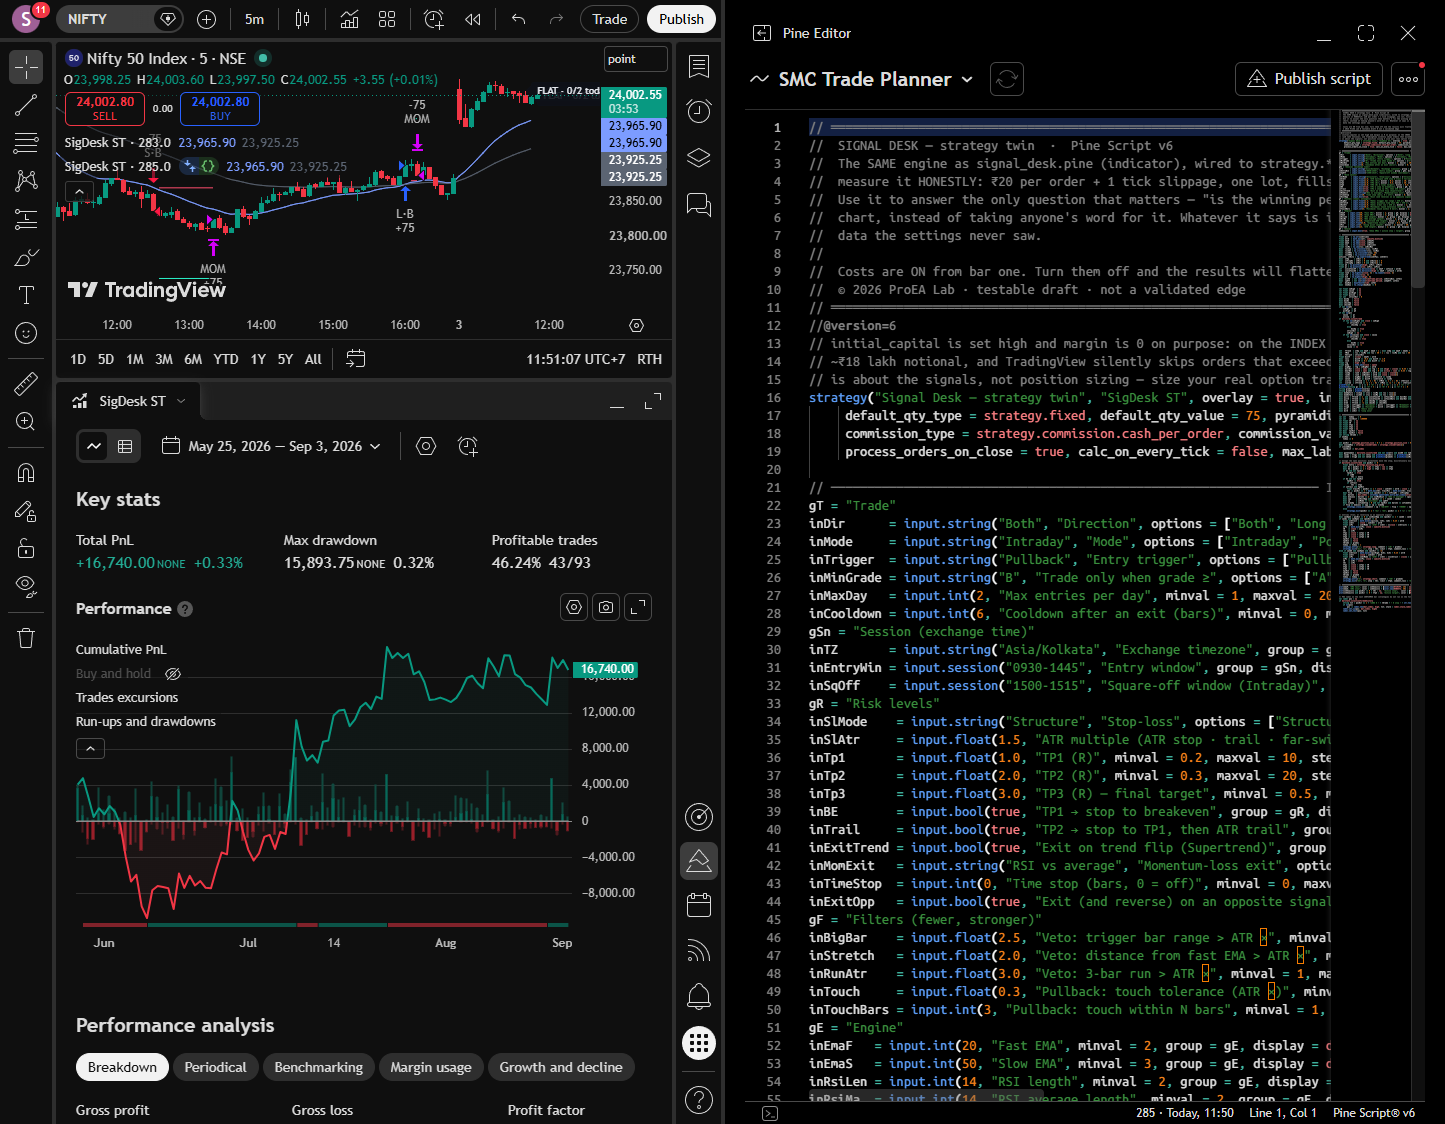
We measured one index chart with real costs on. Counting all eight factors, using learned strength as the gate and a stricter momentum exit made that sample worse. The five-factor setup count remained the default.
One symbol, one window, settings chosen while viewing that chart: in-sample evidence. The lab notes include failures and context. They do not establish the next trade’s outcome.
Read the lab notesEntries commit on confirmed candles. Live readings can move before the close. Changing history, feed, timeframe or inputs can recalculate results. Pivots need five later candles by default; higher-timeframe context uses its last closed candle.
Default entry times are 09:30 inclusive to 14:45 exclusive, Asia/Kolkata, based on candle opening times. Intraday square-off happens on the first closed candle whose opening time falls inside 15:00–15:15.
The tool sees chart bars, not news, option Greeks, order flow or actual fills. Its paper record omits costs. It does not predict prices. This is research tooling, not financial advice.
What shipped and what changed in Signal Desk, newest first. Ask for the next change below; what gets built lands here with a date, and on the lab queue on the front page.
Signal Desk v1.2.0 Shipped
Checks entry quality, daily limits and whether you're chasing price.
Fewer, stronger calls, no chase entry Request Signal Desk
The ask Signal Desk was built from. Shipped as v1.2.0 with the grade, the chase veto and the strength score.
“Fewer signals, only the strong ones — one or two alerts a day would be fine. And stop the trade where a big candle closes, I enter, and it reverses.”
Measured before it shipped Lab note Signal Desk
Run with real costs on. The three smarter versions of the gate lost to the plain count, so the plain count is the default.
A small friction or a big idea. Tell us what would make this tool work better for you.
Requests for a new tool go on the same queue: see what is asked for and what is being built.