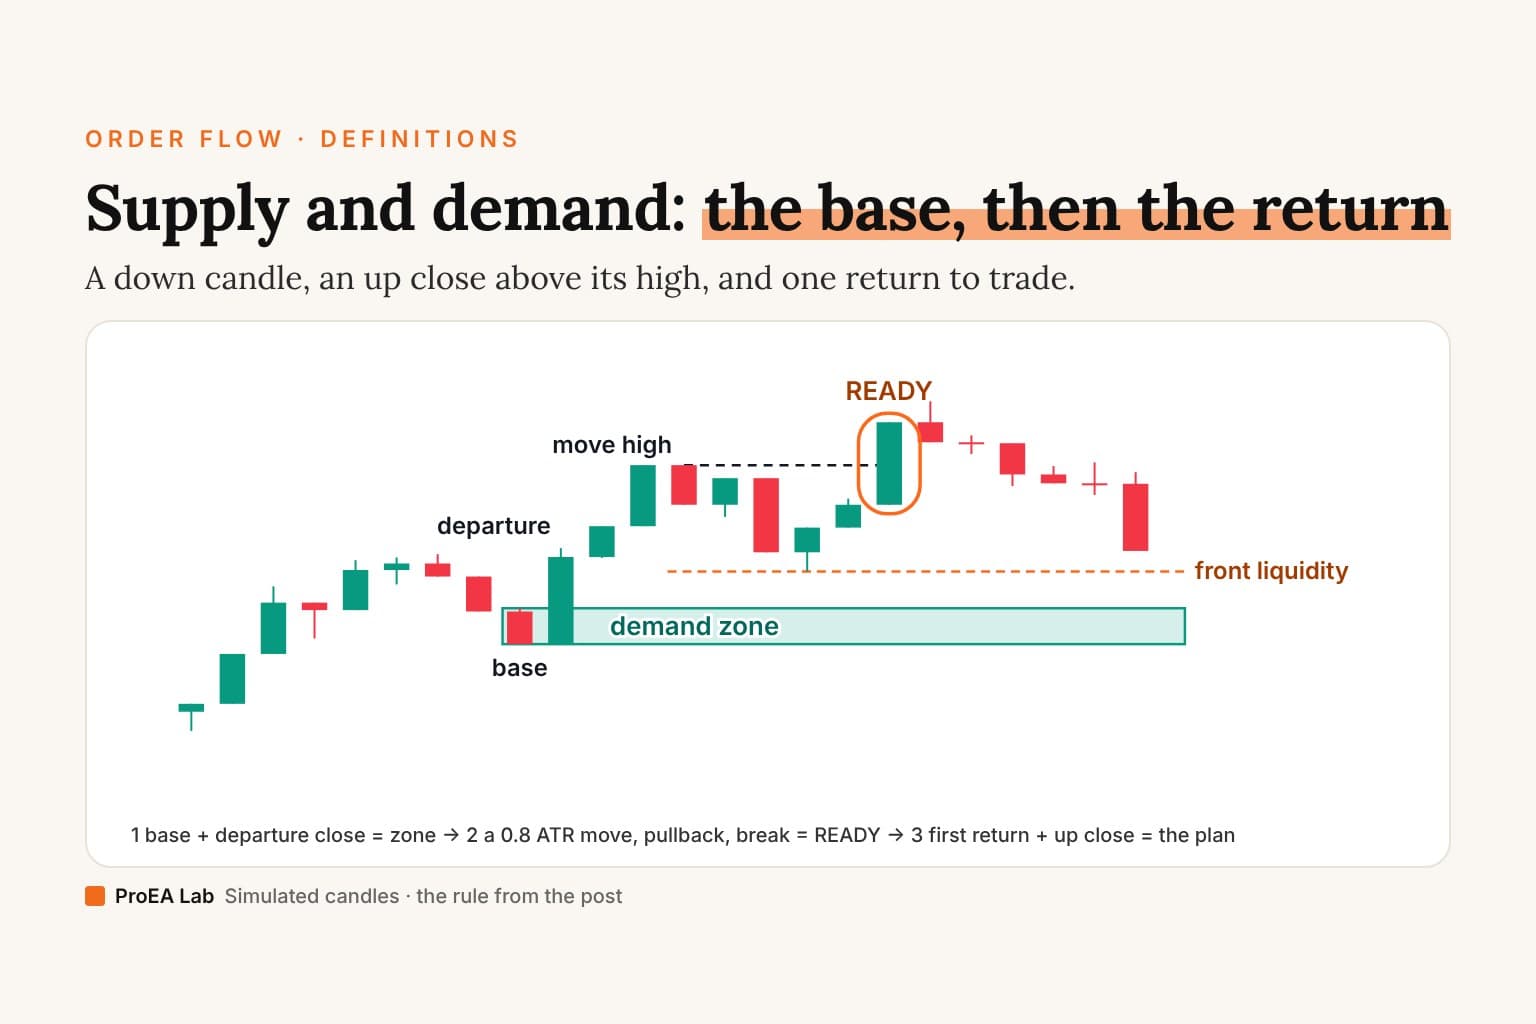
A supply or demand zone is the price area a strong move started from: a demand zone below price, where a rally began, a supply zone above it, where a drop began. Our Supply & Demand Desk draws one from two candles. A down candle, then an up candle that closes above its high, makes a demand zone from the lower of their two lows up to that high. Supply mirrors it.
What to do with it: draw the zone only after the departure closes, wait for READY, take only the first return, and write the stop down before the entry. The desk won't call a zone tradable until the move away reaches 0.8 ATR, price pulls back without touching it, and a later candle closes past the move's high.
The films run the desk's rule, ported from its Pine source (1.0.0, standard 5-minute candles only), on simulated candles; the sandbox runs it on the desk's lesson candles. The desk automates rules from Mangoe's public course, The Supply & Demand Strategy That Changed My Life (2026 FULL COURSE) (checked 2026-10-08); it isn't his indicator, and the thresholds are ours.
A zone is a place to watch. The return decides.What are supply and demand zones?
Areas where price left fast, marked so you can watch them when it comes back. LuxAlgo's concept page (checked 2026-10-08): "Supply and demand zones mark the origins of imbalanced moves." CMC Markets' guide (published 9 Mar 2026, checked 2026-10-08) lets the base be "a consolidation area, a cluster of candles or a brief pause before the move."
The desk is narrower: one base candle, the last that closed against the move, and the departure right after it, so two traders running it draw the same box. The edge facing price is the proximal edge (a demand zone's top); the far one is the distal edge. "Orders left behind" is a story candles can't show: the desk's manual says its zones "do not reveal resting orders or prove why traders bought or sold."
How do you draw a supply or demand zone?
The desk's rule for demand. Supply mirrors every step.
- Base: a candle that closes below its open, then one that closes above its open.
- Departure: that up candle closes strictly above the down candle's high. The zone is born at that close.
- Edges: proximal is the down candle's high; distal is the lower of the two lows. Full wicks by default (an optional FX drawing uses the base's open).
- The move: it extends while candles close up and above the one before. The first candle that closes below the previous close, or trades below the previous low, starts the pullback. By then the move's high must be at least 0.8 × ATR(14) above proximal, the ATR frozen at birth, or the zone is dropped.
- The pullback: at least two candles, none touching the zone. Its lowest low, which the desk calls front liquidity, must sit in the half of the move nearer the zone.
- READY: a later candle closes strictly above the move's high, within 20 candles of the pullback's start. Still not an entry.
Simulated 5-minute candles, not market data. The desk's rule at its defaults: ATR(14), a 0.8 ATR move, 2 pullback candles, the near half; the film draws one zone, the desk would draw every zone it finds.
Read as text
- Simulated 5-minute candles. The 17:40 candle is a down candle (the base): it closes at 1027.80, and its high is 1028.57.
- The next candle closes up at 1029.67, above that high: a demand zone from 1027.80 (the lower of the two candles' lows) to 1028.57, known at the 17:50 close.
- The move runs to 1031.64. The 18:00 candle closes below the one before or trades below its low: the pullback starts. The move went 3.07 past the zone's top, 2.23 × the ATR(14) of 1.38 frozen at the zone's birth; the rule needs 0.8 ×.
- The pullback's lowest low, front liquidity, is 1029.36: in the half of the move nearer the zone (at or below 1030.11), and no candle touches the zone.
- At 18:25, after 5 pullback candles, a candle closes at 1032.56, above the move's high of 1031.64: READY.
- READY still isn't an entry. The zone waits for price to come back down into it.
How this window was chosen: The first demand zone in the simulated run that reaches READY within 14 candles of its birth and is easy to see: the zone is at least a tenth of the film's price range tall. The film starts 10 candles before the base and stops 6 candles after READY, or one candle before the zone's next change, whichever comes first (at least 3 after READY). Films never share a candle.
Front liquidity is close to SMC's inducement: the first pullback's low, which price must trade through to get back to the zone. The near half is the discount half of the move, in premium and discount terms, measured on the departure rather than a dealing range.
Use itMark the zone at the departure's close, then write down the move's high and the pullback's low. Those two lines decide READY.
Watch outA pullback that touches the zone before READY ends it, even with a wick. The desk doesn't wait for a second try.
What does a demand zone look like, candle by candle?
The desk's lesson, with ATR(14) at 10 and a 0.25 tick:
- Base: open 103, high 104, low 99, close 100.
- Departure: open 100, high 110, low 99.5, close 108. It closes above 104: the zone, 99 to 104, is born.
- The move: the next candle runs to 118, 14 above the zone. That beats 0.8 × 10 = 8.
- Pullback: two candles, lows 112 and 110. Front liquidity is 110. Half of 104 to 118 is 111, so 110 is in the near half. A low above 111 would have ended the zone; so would a low at 104.
- Break: a candle closes at 120, above 118. READY.
- The return: a candle opens at 109, wicks to 102, through 110 and into the zone, and closes at 105, below its open. A visit, not an entry.
- Confirmation: the next candle opens at 105 and closes at 108, above its open and above 104. Entry reference: 108.
The stop goes one tick below the visit's deepest wick, 102: 101.75. Risk is 6.25, so the 4R target is 133.
Plan fixed. Directional close outside the zone accepts the reference plan. Its own earlier wick cannot stop it.
- Entry
- 108
- Stop
- 101.75
- Risk (1R)
- 6.25
- 4R target
- 133
- Break-even hit rate
- 20.0%
Costs of 0 points are 0.00R on this stop. A 4R target breaks even at (1 + 0.00) ÷ 5. Arithmetic, not a measured hit rate.
Try three things. Close the confirming candle at 104 or lower: the zone dies, no plan. Close it at 104.5, under its 105 open: still a visit, waiting for an up close. Let the wick reach 100: the stop drops to 99.75, risk grows to 8.25 and the target moves to 141. A deeper wick means a wider stop and a farther target, never a better trade.
How do you trade the return? Entry, stop and invalidation
There's no single supply and demand strategy, only rules. These are the desk's defaults, as rules rather than advice.
Simulated 5-minute candles, not market data. The desk's rule at its defaults: ATR(14), a 0.8 ATR move, 2 pullback candles, the near half; the film draws one zone, the desk would draw every zone it finds.
Read as text
- Simulated 5-minute candles. A demand zone from 793.06 to 794.12, born at 18:00, READY at 18:35; front liquidity at 794.21.
- At 19:05 a candle trades below front liquidity and into the zone, to 794.08, then closes at 794.56: above its open and above 794.12. The visit is confirmed on its own candle.
- Entry reference: that close, 794.56. Stop: one tick below the visit's deepest wick, 794.08, at 794.07. Risk 0.49, so the 4R target is 796.52. The levels are fixed from here.
- At 19:10, 1 candle later, price reaches its stop at 794.07: the paper plan ends there.
- One simulated plan says nothing about the rule. We haven't tested it as a strategy.
How this window was chosen: The first demand zone in the simulated run whose visit is confirmed and admitted as a paper plan within 24 candles of READY, with the zone at least a tenth of the film's candle range tall. The film starts 6 candles before the base and stops 6 candles after the entry reference, whatever price does in them.
- Entry. After READY, a candle trades below front liquidity and into the zone. It, or one of the next three, must close above its own open and strictly above proximal: that close is the paper entry (the Strategy Lab fills at the next open). LuxAlgo calls this a "confirmation entry": a worse price than a resting limit, for a close that shows the rejection.
- Stop. One tick beyond the visit's deepest wick, rounded outward. In the example it sits inside the zone. CMC's version: "placing a stop below the zone." Two stops, two sizes, two different trades.
- Target. 4R, rounded outward; the source says 4R "follows the public 2026 five-minute course." Size is the cash risk (100 by default) over the stop distance.
- Costs. The paper reference subtracts 0.05% commission per side and one tick of slippage each way. The desk's answers page warns that on a short five-minute stop, that estimate "can be larger than the stop itself."
- The end. After entry the levels are fixed. The plan ends at the stop, the target, a gap past either, or the 48th candle's close; a candle touching both counts as the stop.
Use itPick the stop rule before you open the chart: beyond the visit's wick, or beyond the zone's far edge. Then size from that distance.
Watch outChoosing the stop after you've seen where price went turns one rule into two, and hindsight picks the better-looking one.
What does 4R need? Before costs, if every miss loses 1R, one target in five breaks even: 0.2 × 4 = 0.8 × 1. Costs raise that to (1 + costs) ÷ (4 + 1), the formula in the trading expectancy calculator. Costs of 1 point on the example's 6.25 risk are 0.16R, so the target must hit (1 + 0.16) ÷ 5 = 23.2% of the time. Arithmetic, not a measured hit rate.
Supply and demand vs order blocks: what's the difference?
Mostly the trigger and the exit. An order block needs a structure break and dies on a close through its far edge. The desk's zone needs no swing break, but dies on any close back into it. On a sharp reversal both start from the same candle:
Simulated 5-minute candles, not market data. The desk's rule at its defaults: ATR(14), a 0.8 ATR move, 2 pullback candles, the near half; the film draws one zone, the desk would draw every zone it finds. The order block is SMC Basics' rule: swings 10 candles a side, body zone.
Read as text
- Simulated 5-minute candles. The 09:10 candle is a down candle (the base): it closes at 727.44, and its high is 727.71.
- The next candle closes up at 727.95, above that high: a demand zone from 726.56 (the lower of the two candles' lows) to 727.71, known at the 09:20 close.
- The order block needs a break. SMC Basics' last swing high, a high above the 10 candles on each side, is 730.44 at 07:45, known 10 candles later.
- At 09:30, 3 candles after the zone was born, a candle closes above 730.44. Walking back from it, the last down candle is the same base: the order block is its body, 727.44 to 727.71.
- So the same candle gives two boxes. The desk's runs from 726.56 to 727.71: the base's high down to the base's low. The order block's is the body alone, 0.27 tall against 1.15.
- At 10:10 a candle closes at 727.59: inside the zone, so the desk's zone ends, but not below 727.44, so the order block stays.
- At 10:20, 2 candles later, a candle closes at 725.38, below the body: the order block ends too.
How this window was chosen: The first bullish order block by SMC Basics' rule (swings 10 candles a side) whose candle is also the base of a desk demand zone, where the structure break comes at least 2 candles after the zone is born, and a later close lands inside the zone (which ends it by the desk's rule) without closing below the order block's body (which keeps it). The zone is at least a twentieth of the film's price range tall and the body a fifth to 70% of the zone's height, so the two boxes differ at a glance. The film stops 6 candles after that close, whatever price does in them.
Our order block rule, as SMC Basics draws it, next to the desk's zone:
| Supply & Demand Desk zone | Order block (SMC Basics) | |
|---|---|---|
| Known at | the departure's close | a close beyond the last swing (10 candles a side) |
| Edges | the base's high to the lower of the two lows | the last opposite candle's body |
| Strength filter | 0.8 × ATR(14) past proximal | none beyond the break |
| Ends on | any close on or inside proximal, a touch before READY, age | a close beyond the far edge |
LuxAlgo agrees the two "often mark overlapping areas while following different drawing and mitigation rules." A strong departure can also leave a fair value gap; the desk doesn't look for one. Neither tool flips a failed zone: a failed order block that structure then breaks through is a breaker block, a separate rule.
Fresh vs tested zones: how does a zone end?
Most guides prefer fresh. LuxAlgo: a zone "is considered strongest before it is touched at all." That's an assumption, not a measured result, and CMC adds: "A fresh zone can break on its first retest." The desk turns freshness into a rule:
- Before READY, any touch kills it, wick included. So does any close on or inside proximal, before or after READY.
- After READY, one visit counts. The first candle into the zone, or any of the next three, can confirm; on the fourth it expires. Once it confirms, it's used up.
- An age limit. More than 120 candles after birth, 10 hours on a 5-minute chart, it expires.
Simulated 5-minute candles, not market data. The desk's rule at its defaults: ATR(14), a 0.8 ATR move, 2 pullback candles, the near half; the film draws one zone, the desk would draw every zone it finds.
Read as text
- Simulated 5-minute candles. The 01:40 candle is a down candle (the base): it closes at 867.01, and its high is 867.45.
- The next candle closes up at 868.06, above that high: a demand zone from 867.01 (the lower of the two candles' lows) to 867.45, known at the 01:50 close.
- The move runs to 868.24. The 02:00 candle closes below the one before or trades below its low: the pullback starts. The move went 0.79 past the zone's top, 1.61 × the ATR(14) of 0.49 frozen at the zone's birth; the rule needs 0.8 ×.
- The pullback's lowest low, front liquidity, is 867.74: in the half of the move nearer the zone (at or below 867.85), and no candle touches the zone.
- At 02:10, after 2 pullback candles, a candle closes at 868.82, above the move's high of 868.24: READY.
- At 02:55, before any visit, a candle closes at 867.21, inside the zone (at or below 867.45). By the desk's rule any close on or inside the proximal edge ends the zone; it doesn't wait for the far edge.
How this window was chosen: The first demand zone that reaches READY and then ends on a close on or below its proximal edge, before any visit and within 20 candles of READY, at least a tenth of the film's price range tall.
So the desk has no "tested zone" to trade: a zone is waiting, ready, visited or gone. Order-block traders often call the first retest mitigation; a mitigation block is a different pattern, despite the name.
Do supply and demand zones work?
We can't say. We haven't tested the desk's rule as a strategy.
The desk's 0.8 ATR rule is a displacement filter, the kind of factor that showed an association in the zone-score study. That's a reason to test it, not a result: the study used none of the desk's zones, entries or exits, and the films are simulated. A real test would fix the rule, count hundreds of conditions across markets, hold out a period it never saw (a walk-forward test), include costs, and beat the same stop and target on entries that ignore zones.
Before a supply or demand trade
CMC on drawing, true of any rule: "Consistency matters more than which method you choose."
Which tools draw supply and demand zones?
The whole rule on your own chart. Supply & Demand Desk draws each zone with its stage, its front-liquidity line and a WHY / NEXT panel that names the missing check; a confirmed zone gets a fixed paper entry, stop and 4R target, and a Strategy Lab runs the same engine in the Strategy Tester. Pine v6, full source in Pine Pro Library; it stops with an error on anything but standard 5-minute candles. New to Pine? How to add a script to TradingView.
SMC Basics, also in the library, draws the order blocks from the table, plus fair value gaps. Planning an order-block trade instead: order block trading strategy. More concepts, one written rule each: smart money concepts.
Disclosure
We build Supply & Demand Desk and SMC Basics and sell them in Pine Pro Library, alongside our other indicators. The desk draws on Mangoe's public course but isn't his official indicator. We quote LuxAlgo and CMC Markets as published sources; neither reviewed this page. Nothing here is financial advice, and no zone rule on this page, ours included, has a validated edge.
Use these animations on your site.
Frequently asked questions
What are supply and demand zones?
The price area a strong move started from: a demand zone below price, where a rally began, and a supply zone above it, where a drop began. They're marked so you can watch them when price comes back.
How do you draw a demand zone?
By our Supply & Demand Desk's rule, a down candle followed by an up candle that closes strictly above its high makes a demand zone, from the lower of the two candles' lows up to the down candle's high. Supply mirrors it.
What is the difference between supply and demand zones and order blocks?
Mostly the trigger and the exit. An order block needs a structure break and dies on a close through its far edge; the desk's zone needs no swing break but dies on any close back into it.
Are fresh supply and demand zones better than tested ones?
Most guides prefer fresh zones, but that's an assumption, not a measured result, and CMC adds that a fresh zone can break on its first retest. The desk makes freshness a rule: before READY any touch kills a zone, and after READY only the first visit counts.
Where does the stop go on a supply and demand trade?
In Supply & Demand Desk, one tick beyond the visit's deepest wick, rounded outward, with a 4R target. CMC's version places the stop below the zone instead: two stops, two sizes, two different trades.
What win rate does a 4R target need to break even?
Before costs, if every miss loses 1R, one target in five: 0.2 × 4 = 0.8 × 1. Costs raise that to (1 + costs) ÷ (4 + 1); that's arithmetic, not a measured hit rate.
Do supply and demand zones work?
We can't say: we haven't tested the desk's rule as a strategy. Our nearest study tested order blocks and fair value gaps, not these zones: on gold futures 5-minute candles over 50 sessions, 29 Apr to 10 Jul 2026, 982 of the 1,693 zones that resolved (58.0%) moved 1 ATR in the zone's favour before a close beyond the far edge, a mechanical race, not a win rate.