
Complete Suite Everything on the list, one payment
$97, one payment.
Renews never / Full source / 7-day refund before download
The Suite adds no ICT Levels features; it includes Pine Pro Library, so this desk's code comes with it.
It draws yesterday's high and low, the midnight open and each session's high and low, then marks each line swept or broken as price comes back.
Day 1 · a sweep and a break
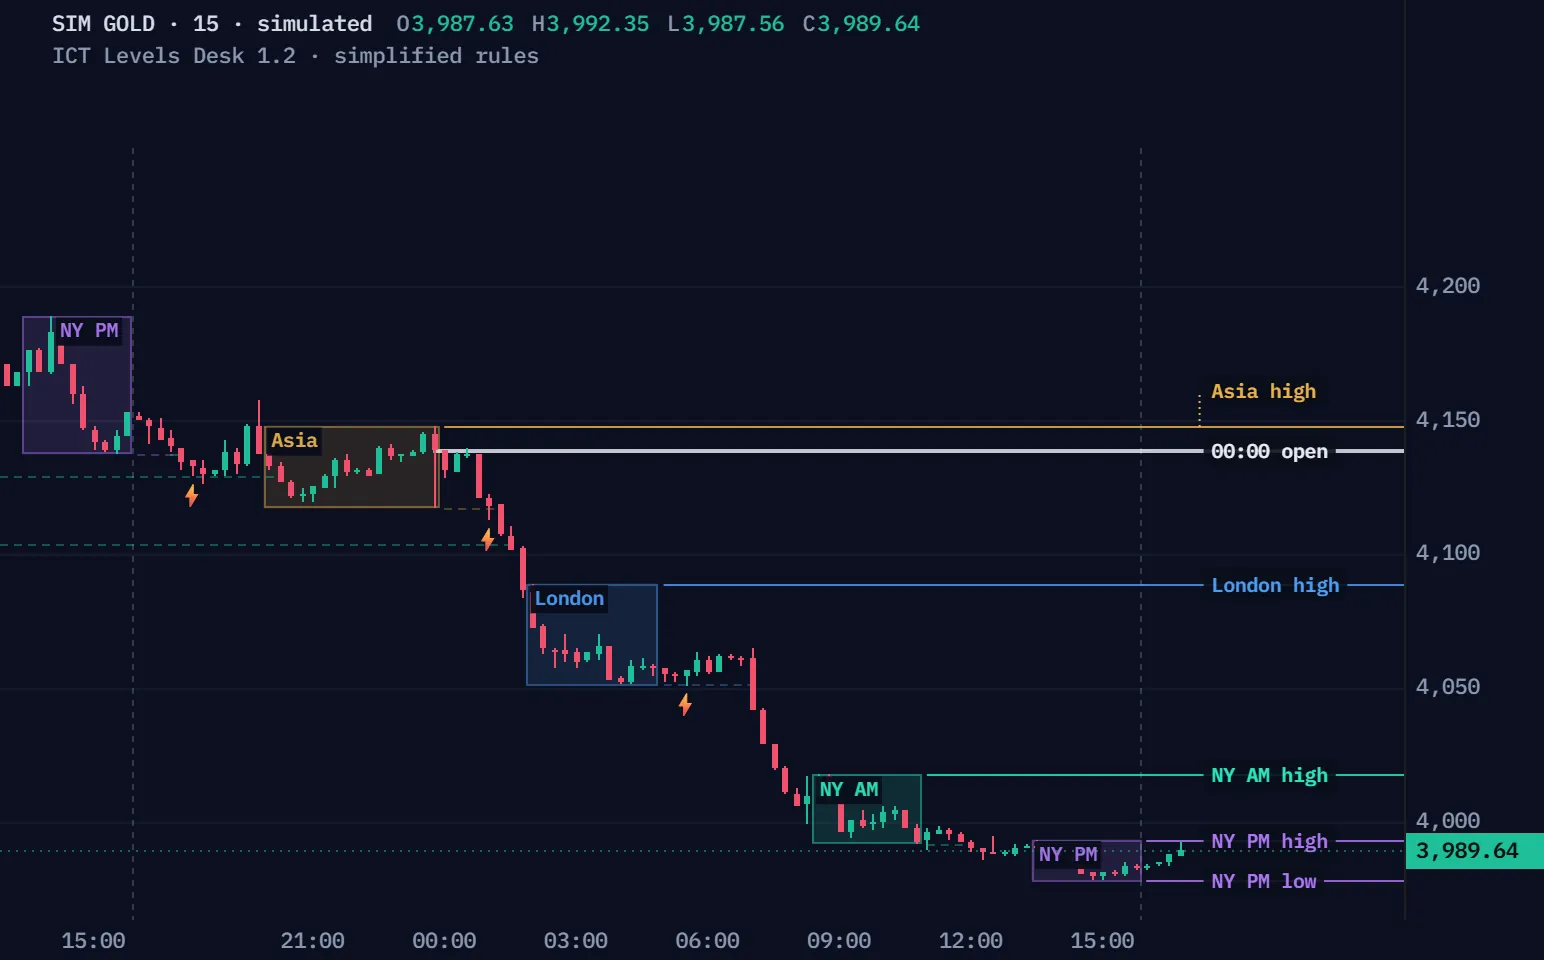
Simulated 15-minute gold bars, not a real market, run through ICT Levels Desk's level rules, simplified for the browser: the previous day's high and low, the midnight open and the four sessions' highs and lows, drawn within 2 daily ATR of price (the script's default). The opening gaps, the first FVG, the macro windows and the 08:30 and 09:30 opens live in the script, not the film. Quiet bars run as a time-lapse; sweeps and breaks slow down. Day 1 is the first simulated day where one level is swept and another broken, so a sweep and a break both show; Another day plays the next simulated days in order, whatever they do.
| Time | Event | Prices |
|---|---|---|
| 18:00 | Day opens | Close 4139.92 · PDH 4227.44 · PDL 4137.25 |
| 18:00 | NY PM low broken | NY PM low 4137.25 · close 4134.85 |
| 18:00 | PDL broken | PDL 4137.25 · close 4134.85 |
| 18:15 | PDL −1d swept ⚡ | PDL −1d 4129.37 · low 4129.19 · close 4132.25 |
| 20:15 | PDL −1d broken | PDL −1d 4129.37 · close 4127.14 |
| 00:00 | Asia high and low drawn | High 4147.99 · low 4116.98 |
| 01:00 | Asia low swept ⚡ | Asia low 4116.98 · low 4112.54 · close 4118.40 |
| 01:15 | Asia low broken | Asia low 4116.98 · close 4106.83 |
| 01:30 | PDL −2d broken | PDL −2d 4103.72 · close 4101.96 |
| 05:00 | London high and low drawn | High 4089.05 · low 4051.19 |
| 05:30 | London low swept ⚡ | London low 4051.19 · low 4050.80 · close 4056.29 |
| 07:00 | London low broken | London low 4051.19 · close 4041.57 |
| 11:00 | NY AM high and low drawn | High 4017.70 · low 3991.88 |
| 12:00 | NY AM low broken | NY AM low 3991.88 · close 3990.05 |
| 17:00 | NY PM high and low drawn | High 3993.46 · low 3977.97 |
Full Pine v6 source in Pine Pro Library. It draws on your chart; you place the trades.
A level rests until the first wick reaches it: if that bar closes back, the level is swept and stays; a close through breaks it.
A close below 4051.19: London low is broken. Its line ends here, dashed and faint.
The same simulated 15-minute gold, simplified rules, one level drawn alone. It is the first level, in the days' order, drawn in its day, swept, and broken 4 bars or more after the sweep, so each state holds on screen. The words are the script's own state words.
Drawn when its session or day ends, the line waits for the first wick through.
The first wick through closes exactly on the level, and the line stays live.
The first wick through closes back inside: marked ⚡, and the line stays live.
A close beyond the level ends its line at that bar, dashed and faint.
The first wick through a level decides it: a close back is a sweep, a close exactly on it is a test, and a close through is a break.
A drawn example, the same bars each time: only the last bar's close moves, and the script's own state pass reads it (the shipped rules, simplified for the browser).
The wick goes through and the bar closes back inside: marked ⚡, and the line stays live.
The close lands exactly on the level: the line stays live, and a later close through still breaks it.
A close beyond the level ends its line at that bar.
Only the first wick through can sweep; a later return cannot make one.
The desk draws a level only while it lies within N daily ATR of the close, so far lines stay off the chart until price comes back.
The same simulated gold, simplified rules, at day 1 at its last close, the moment the replay rests on. The script's default is 2 daily ATR; its input runs from 0.25 to 10. Hidden levels still update, and the panel's nearest rows still list them.
About two typical days' range either side of the close.
The input moves in quarter steps, and the band is measured from the close.
A hidden level keeps updating and comes back when price nears it.
The last closed daily ATR 14 sets the unit, so the band follows the market's pace.
One file, the complete v1.2.0, ready for TradingView's Pine Editor.
On a phone? Send this page to your desktop.
// ═══════════════════════════════════════════════════════════════════════════════════════════════════════// ICT LEVELS DESK — NDOG · NWOG · midnight / 08:30 / 09:30 opens · PDH-PDL · PWH-PWL · PMH-PML · first-presented FVG · macro windows · Pine Script v6 · v1.2.0// Built for a r/pinescript thread reply ("Real Trader Tim's toolkit … but clean, lightweight, only what matters").// The wishlist: NDOG / NWOG, first-presentation FVGs, the midnight open, weekly / daily highs and lows, macro// windows, and "days back" so the chart does not drown. This desk adds what the wishlist did not ask for:// · every level knows its own state — a gap is untouched / entered / FILLED, a high or low is resting / SWEPT /// BROKEN, an FVG is fresh / TOUCHED / INVERTED — and fades once it is used, or leaves the chart (switch)// · a proximity filter: only levels within N × the daily ATR of price are drawn; the panel says how many are hidden// · the panel lists the three nearest levels above and below price with the distance in points and ATR// · a countdown to the next macro window, and what today's first-presented FVG did// · base rates on the loaded chart: how often the NDOG filled the same day, PDH / PDL got taken, the FPFVG revisited// Every level commits when it is born (a closed bar, a closed period); states change on closed bars only.// …// ═══════════════════════════════════════════════════════════════════════════════════════════════════════//@version=6indicator("ICT Levels Desk — NDOG · NWOG · opens · PDH/PDL · PWH/PWL · FPFVG · macros", "ICT Levels", overlay = true, max_lines_count = 400, max_boxes_count = 200, max_labels_count = 500) // ─────────────────────────────────────────────────────────────────── INPUTSgT = "Clock"inTz = input.string("America/New_York", "Timezone (IANA)", group = gT, tooltip = "Every time below is read in this timezone. ICT times are New York.", display = display.none) gG = "Opening gaps (NDOG · NWOG)"inNdogOn = input.bool(true, "NDOG — new-day opening gap", group = gG, tooltip = "The gap between the close at the day-close time and the open at the day-open time (16:00 → 18:00 New York for futures and most CFDs; set 16:00 → 09:30 for regular-hours stocks). Drawn as a box with its consequent encroachment (the midline).", display = display.none)inNwogOn = input.bool(true, "NWOG — new-week opening gap", group = gG, tooltip = "The same gap across the weekend: the last close before the weekend to the first open after it. ICT keeps the last few weeks of these as reference.", display = display.none)inCloseTime = input.string("16:00", " Day-close time (HH:MM)", group = gG, display = display.none)inOpenTime = input.string("18:00", " Day-open time (HH:MM)", group = gG, display = display.none)inGapMin = input.float(0.02, " Skip gaps smaller than N × daily ATR", minval = 0, maxval = 1, step = 0.01, group = gG, display = display.none)inNdogBack = input.int(3, " NDOG — days back", minval = 1, maxval = 20, group = gG, display = display.none)inNwogKeep = input.int(5, " NWOG — keep the last N", minval = 1, maxval = 12, group = gG, display = display.none)inGapRemove = input.bool(false, " Remove a gap once it is filled (otherwise it fades)", group = gG, display = display.none) gO = "Opens"
No coding needed.
The full source, to read, change and keep; owners sign in to copy.
It draws on the price chart, with no extra pane.
Any symbol TradingView loads, on five- or fifteen-minute bars; the films here use simulated 15-minute gold.
Fifteen named alert conditions, from a new-day gap to a session sweep.
The page, its films and the manual are open to everyone. The code, the indicator's full Pine v6 source, is in Pine Pro Library: $49 once for every desk and every update, or included in the Complete Suite. Sign in to copy or download.
No. It maps where price traded and what happened when it came back; it has no entry, stop or target. The lab notes say what we counted on three charts.
No ICT Levels features. It holds everything we make, Pine Pro Library included, for one payment; this desk's code comes with it.
We, ProEA Lab, build ICT Levels Desk. The films run its level rules, simplified, on simulated candles, not market data. Not financial advice.
Complete Suite · $97 · one payment
The Suite adds no ICT Levels features; it includes Pine Pro Library, so this desk's code comes with it.
Every reference, rule and setting, one question at a time.
ICT Levels Desk · Pine Pro Library
Keep useful price references. See what happens when price returns.
A reference map for TradingView. It does not choose trades.
Sessions, gaps and past highs and lows.
Focus the map around current price.
Name live, swept or filled levels.
ICT Levels Desk is a TradingView indicator in Pine Pro Library for previous-period highs and lows, session opens, opening gaps and other price references. It distinguishes touches, sweeps and closing breaks, with display filters and a context dashboard. This is a reference-mapping tool: it does not supply an entry plan, position size or companion strategy.
For a high or low, a strict wick through followed by a close back inside marks the first test as swept. A strict close beyond marks it broken. Equal closes, opening gaps and FVGs follow distinct state rules. Compare touches, sweeps and breaks
The proximity filter can hide references without stopping their state updates or removing them from nearest-level calculations. The display also separates retained finished references from live ones. Check filter settings and reference state before assuming a level was deleted. Understand proximity and retained levels
No. It maps price references and their observed states. Dashboard counts describe loaded history, not independent odds of the next event, and the Co-Pilot provides context. There is no companion strategy, order placement or position-sizing model in this tool. Read the reference-tool boundaries
A reader wanted gaps, opening prices and old highs on one clear chart. Start with one high.
The thin wick shows the highest and lowest prices. The body joins open and close. The highest price so far is 103.
Fictional prices. Three candles represent the earlier period; its completed high/low pair changes. Daily ATR, a movement measure, is supplied as 20 points.
Choose where to watch and record the response. Test your own entry, exit and risk rules; a sweep alone does not establish an advantage.
Reveal five candles. Compare the first visit.
The reference is 106. No wick has passed above it. Reveal candle four, then compare its four versions.
Reveal candle four, then switch cases. Candle five shows what the desk remembers.
The high at 106 already exists before these fictional closed candles. Daily ATR is supplied as 20 points and drawing radius as twice that. Only revealed candles update the state. This miniature lesson does not calculate the trading clock or discover previous periods.
No. These are alternative outcomes, not a ladder. Different reference types also have different rules. An opening gap can fill with a wick; a three-candle gap needs a closing break to invert.
Start with one nearby level.
PDH means previous day’s high. Other names identify an opening price, a gap or a completed session.
Read its state. A swept line remains live; a broken line ends at the closing break.
The panel lists unfinished references above and below. Their distance helps you focus.
Change the closing price, wick, reference type and drawing radius. Try an opening gap and a bullish first FVG with the same close and wick.
The wick and close do different jobs. Move them across the reference to see its state change.
Each kind replays its own untouched reference history. A high or low needs a strict wick-through; gaps fill at the far wick edge, while an FVG inverts only on a close through it. Radius changes visibility, not stored prices.
Illustrative inputs · changing a slider recalculates this example · no market feed
The complete Pine v6 indicator is in Pine Pro Library.
Create a new indicator on an intraday chart.
Copy below, replace the sample, save and add to chart.
Set the tool’s timezone and day-close and day-open times for your market.
Draws directly on the price chart; no extra pane. Try five- or fifteen-minute candles.
Copy the code as it is. No coding needed.
The shipped New York preset is 16:00 → 18:00. The source gives 16:00 → 09:30 for regular-hours stocks. Match the session your chart actually contains; these are not universal market hours. Missing clock-time candles can change which references appear.
All reference types, rules and settings remain here.
NDOG names a new-day opening gap; NWOG a new-week opening gap. FPFVG means the first qualifying FVG from an enabled anchor time. These names describe recorded prices and conventions, not confirmed orders.
High or low: resting until the first strict wick-through. That first test is swept only if it closes back inside; a close exactly on the level is tested. A strict close beyond breaks it. Tested and swept remain live until broken. A later return cannot relabel the first test or revive a broken line.
Opening gap: open, entered, midpoint touched, filled. A wick reaching the far edge fills it, even on its birth candle. It can skip intermediate states.
First FVG: fresh, touched, inverted. A later candle must close strictly beyond the far edge to invert it. A wick through, or a close exactly on the edge, is not enough. Its birth candle cannot touch or invert it.
For an already-existing upward box from 100 to 106, a candle with low 100 and close 104 fills an opening gap.
The same candle only touches a bullish FVG. Inversion requires a later close below 100.
Filled, broken and inverted drawings end at their event candle and fade. Separate switches remove filled gaps or broken high/low lines; neither removes inverted FVGs. Opening-price lines stay live after a crossing.
The proximity filter draws registered references within 2 daily ATR by default. ATR measures recent price movement, including gaps. Distance is to a line or a box’s nearest edge; inside a box, it is zero.
Hidden references still update and may appear in the nearest lists. Box midpoint decides its above/below list. The tracked count includes retained finished references. Session boxes, macro shading and previous-day range shading are separate from this filter.
Proximity and gap-size rules use the last closed daily ATR 14, falling back to ten times chart ATR 14. FVG size uses chart ATR 14. Near alerts have their own radius.
Previous periods: completed day, week, month or four-hour extremes are received on confirmed chart bars. A new pair is created when the returned high/low pair changes; an identical pair does not create another. Daily history is limited by age; other period pairs replace their predecessors.
Opening gaps: compare the last tracked close inside the configured clock window with the opening bar’s open. Creation commits at that bar’s close. A close captured on Friday or Saturday makes a weekend gap, not a second daily gap. The minimum size is inclusive.
Opening prices: use available bars at or after their clock time. The first local-date bar can stand in for midnight. Separate 08:30 and 09:30 opens are suppressed if that candle is also the first date bar.
First FVG: bullish means third-candle low above first-candle high; bearish mirrors this. The first bar at or after an anchor can confirm the pattern using two earlier bars. If several anchors are armed, priority is 09:30, then 08:30, then midnight; one pattern uses one anchor.
Session lines: born on the first closed candle outside the session, after that candle’s state checks. Their tests start on the following candle.
Session boxes, also called killzones, expand as session candles close. Their highs and lows can become references afterward. Turning off session tracking also stops those lines being created.
The previous day’s midpoint splits its range: premium is the upper half, discount the lower half. These describe position, not fair value or an entry.
Macro windows are fixed time conventions, not tested predictions. London: 02:33–03:00 and 04:03–04:30. New York AM: 08:50–09:10, 09:50–10:10 and 10:50–11:10. Lunch: 11:50–12:10. New York PM: 13:10–13:40 and 15:15–15:45.
All use the selected timezone. Four groups can be enabled; their eight times are not editable. Hiding macro drawings leaves the enabled countdown available. It follows chart-bar time, not a running wall clock.
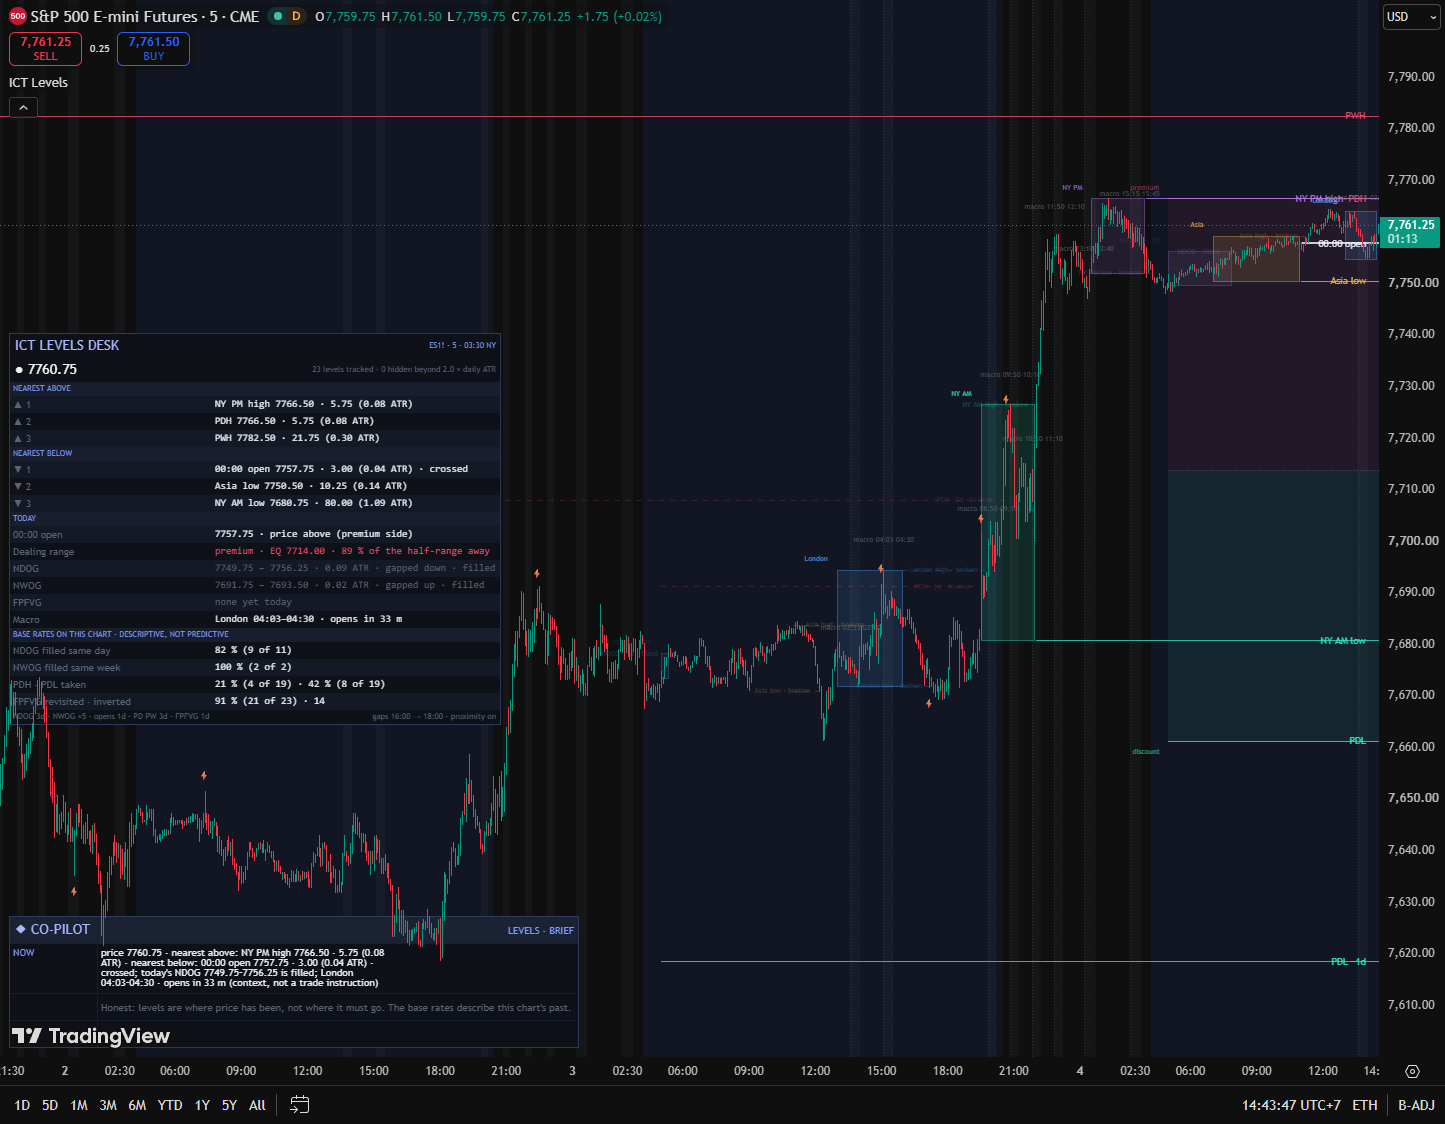
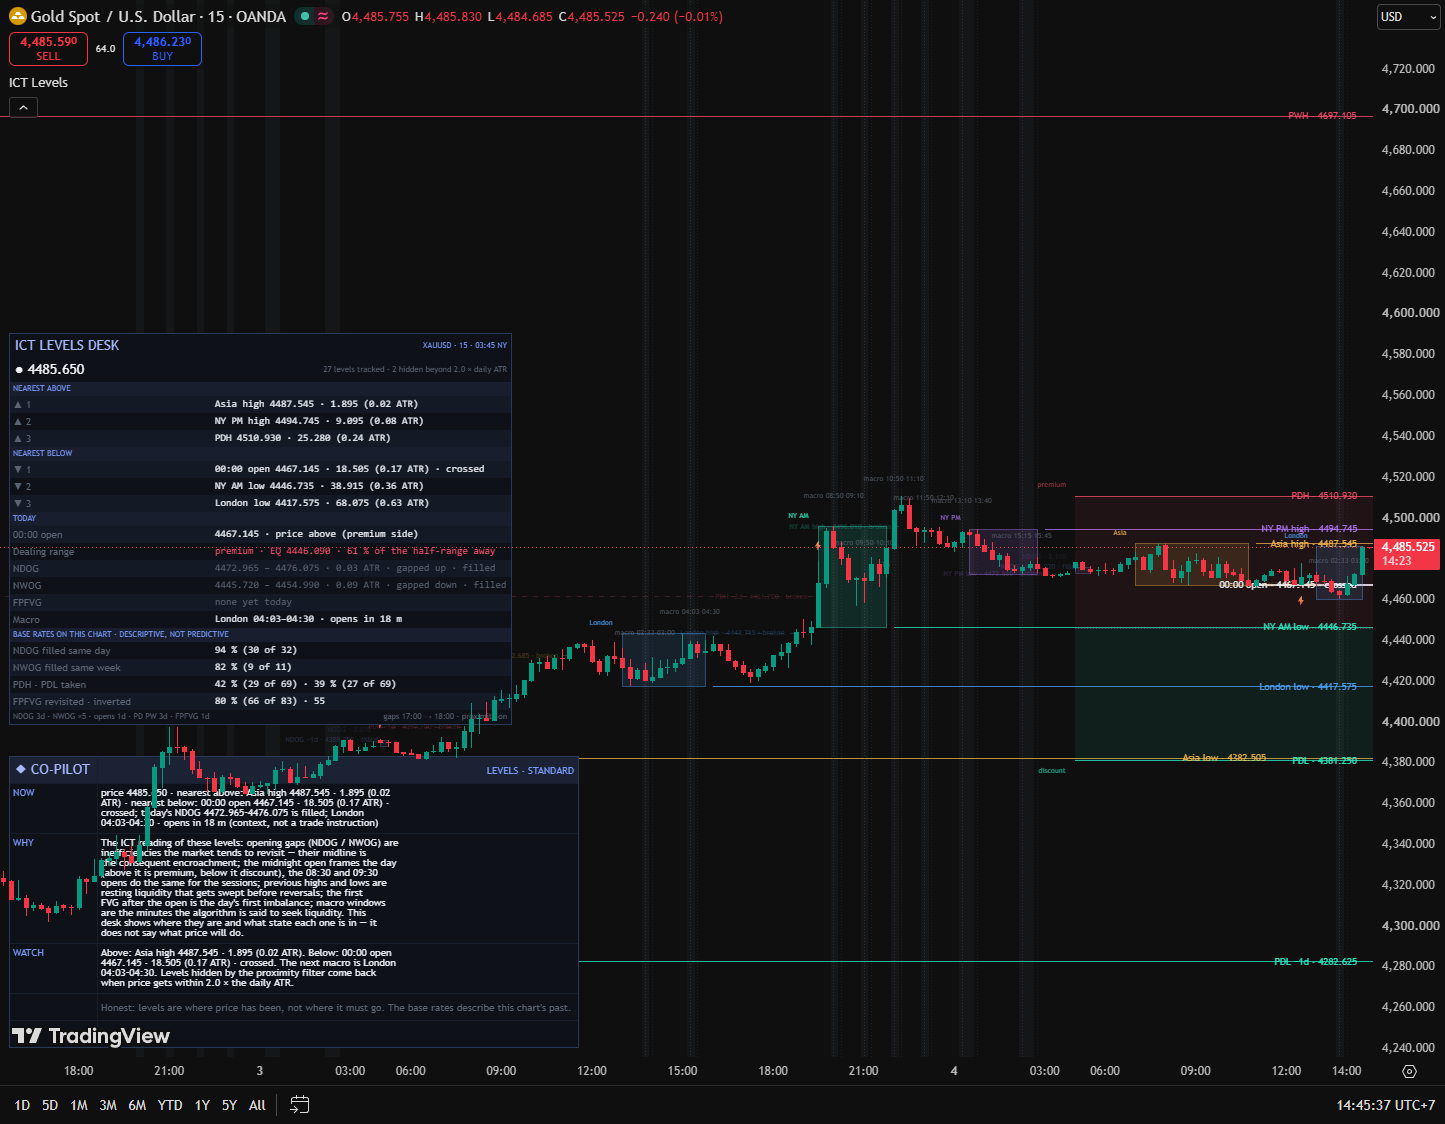
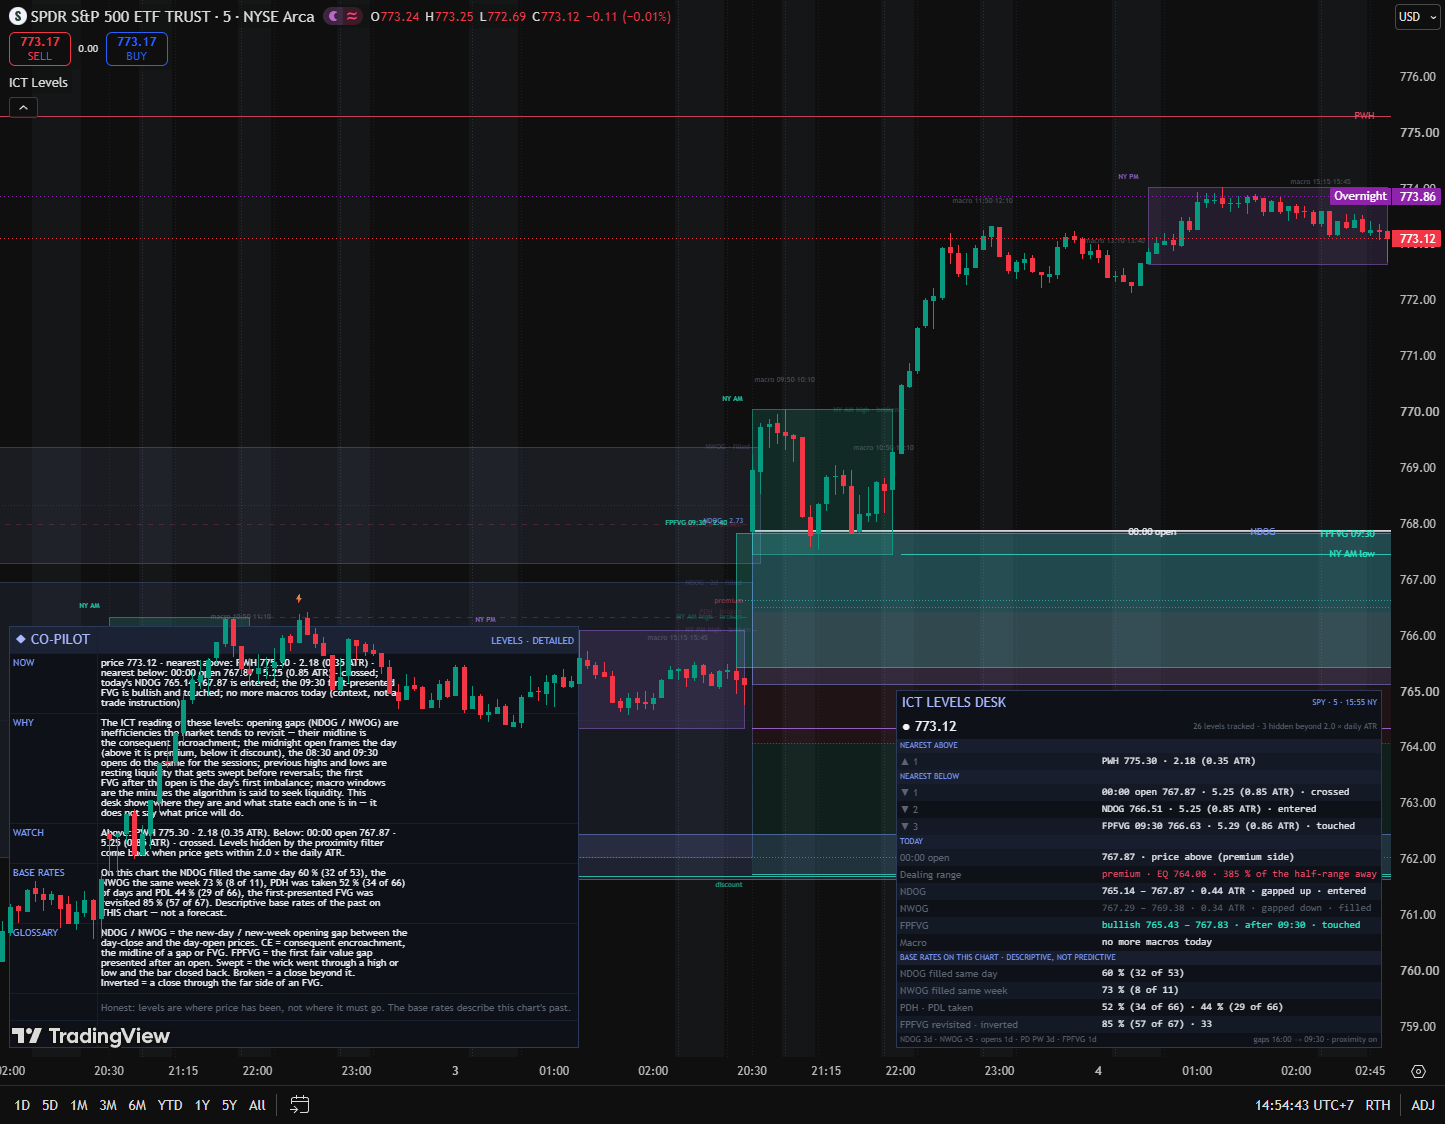
Price: current price, tracked count and hidden count. Nearest above / below: three unfinished references each way, their state and distance in points and daily ATR.
Open: which side of midnight price is on. NDOG / NWOG / FPFVG: each current box’s range, direction and state. Dealing range: position around the midpoint. Macro: current or next enabled window. Base rates: counts from loaded history.
Brief Co-Pilot shows NOW. Standard adds WHY and WATCH. Detailed adds BASE RATES and GLOSSARY. These describe the map; they do not choose a trade.
All fifty-six inputs, in the order shown in settings. Defaults are on the right.
Every configured clock time uses this timezone. The chart’s displayed timezone does not replace this setting.
Compare the last tracked close inside the configured clock window with the next day-open price. NDOG is a daily gap; NWOG is a weekend gap. Filled gaps fade unless removal is enabled.
These are price references. The first available bar may stand in for midnight; missing session bars can change which opening lines appear.
Use completed-period extremes. Daily pairs have a history limit; week, month and four-hour pairs are replaced. Swept references remain live until broken.
Track the first qualifying FVG confirmed from each enabled anchor time. The main switch enables this module; its optional anchors depend on it. The size filter uses chart ATR.
Eight fixed windows are grouped below. Their times are not editable. Hiding their drawings leaves the enabled windows’ countdown available; it uses chart-bar time.
Boxes develop while each session runs. After it ends, its high and low can become tracked references. Turning this module off stops their creation too.
The midpoint divides the previous day’s range into upper and lower halves. Premium and discount describe location, not fair value or an entry.
The proximity filter hides distant registered references while tracking continues. Session boxes, macro shading and range shading are separate. Choose Aurora Neon, Royal Gold or Colorblind-safe.
Lists nearby unfinished references and their states. The hidden count includes retained references hidden by distance. Base rates describe loaded chart history.
Brief shows NOW. Standard adds WHY and WATCH. Detailed adds BASE RATES and GLOSSARY. Off hides the explanation.
Near alerts have their own distance, separate from drawing visibility. They rearm after price leaves an unfinished reference. Zero disables this proximity alert.
Fifteen named conditions: NDOG formed, NWOG formed, gap entered, gap midpoint touched; previous day/week high/low swept; first FVG formed, touched or inverted; macro opening; midnight crossed; near a level; session high/low swept.
Any alert() function call sends eight event types: NDOG, NWOG, GAP_ENTERED, SWEEP, FPFVG_FORMED, FPFVG_INVERTED, MACRO_OPEN and NEAR_LEVEL. Choose JSON or readable text. It omits midpoint, FVG touch, midnight crossing and session-sweep events. There is no separate gap-filled condition.
{"src":"ICTLevelsDesk","symbol":"ES1!","tf":"5","event":"SWEEP","what":"PDH","price":6410.5}The example shows the core JSON fields; messages also carry nearestAbove, nearestBelow and macro context. Near alerts rearm after price leaves an unfinished level. Zero disables them.
Dynamic messages use once-per-bar-close frequency. Most named events follow confirmed state changes; macro opening is not explicitly close-gated. Select Once Per Bar Close when needed, and recreate alerts after changing inputs.
We counted opening-gap fills, highs and lows taken, and first-FVG revisits on three charts: index futures, gold and a stock ETF. The samples covered weeks or months and differed by market.
Descriptive, not predictive. These are level counts, not trade returns. Some outcomes settle at a period rollover while totals start at birth; shared daily flags can group older levels or multiple anchors. The rows do not give an independent chance for your next trade.
The lab notes carry the measurements and caveats together.
The lab notes are in review and will be linked here.
A live candle can change before close. Committed reference states use closed candles, while session ranges develop across their session. Different feeds, history, timeframes or settings can recalculate the map.
Context, not signals. It does not predict price, verify resting orders or account for news, fills or trade size. Trading risk is entirely yours; this is research tooling, not financial advice.
What shipped and what changed in ICT Levels Desk, newest first. Ask for the next change below; what gets built lands here with a date, and on the lab queue on the front page.
ICT Levels Desk v1.2.0 Shipped
Tracks nearby highs, lows, opens and gaps as price moves.
The ICT key-levels wishlist Request ICT Levels Desk
A commenter listed the levels needed, with days back so the chart does not overclutter. Every item is in, each with a state.
“ndogs, nwogs, 1st presentation fvgs, midnight open, weekly/daily highs/lows … an option to change the number of days back such levels are drawn”
Counted on three charts before it shipped Lab note ICT Levels Desk
The desk counts its own levels: gap fills, highs and lows taken, the first FVG revisited. Three markets, three answers. Numbers in the notes.
A small friction or a big idea. Tell us what would make this tool work better for you.
Requests for a new tool go on the same queue: see what is asked for and what is being built.