
Strategy twin · optional
stochastic-pop-desk-strategy.pine
The same rules as native orders, for TradingView's Strategy Tester on a second chart, with commission and slippage set in the file.
It lets the EMA 200 pick the side, waits for the stochastic line to dip and come back, then marks the pop with its stop and two targets.
Window 1 · first to reach TP1
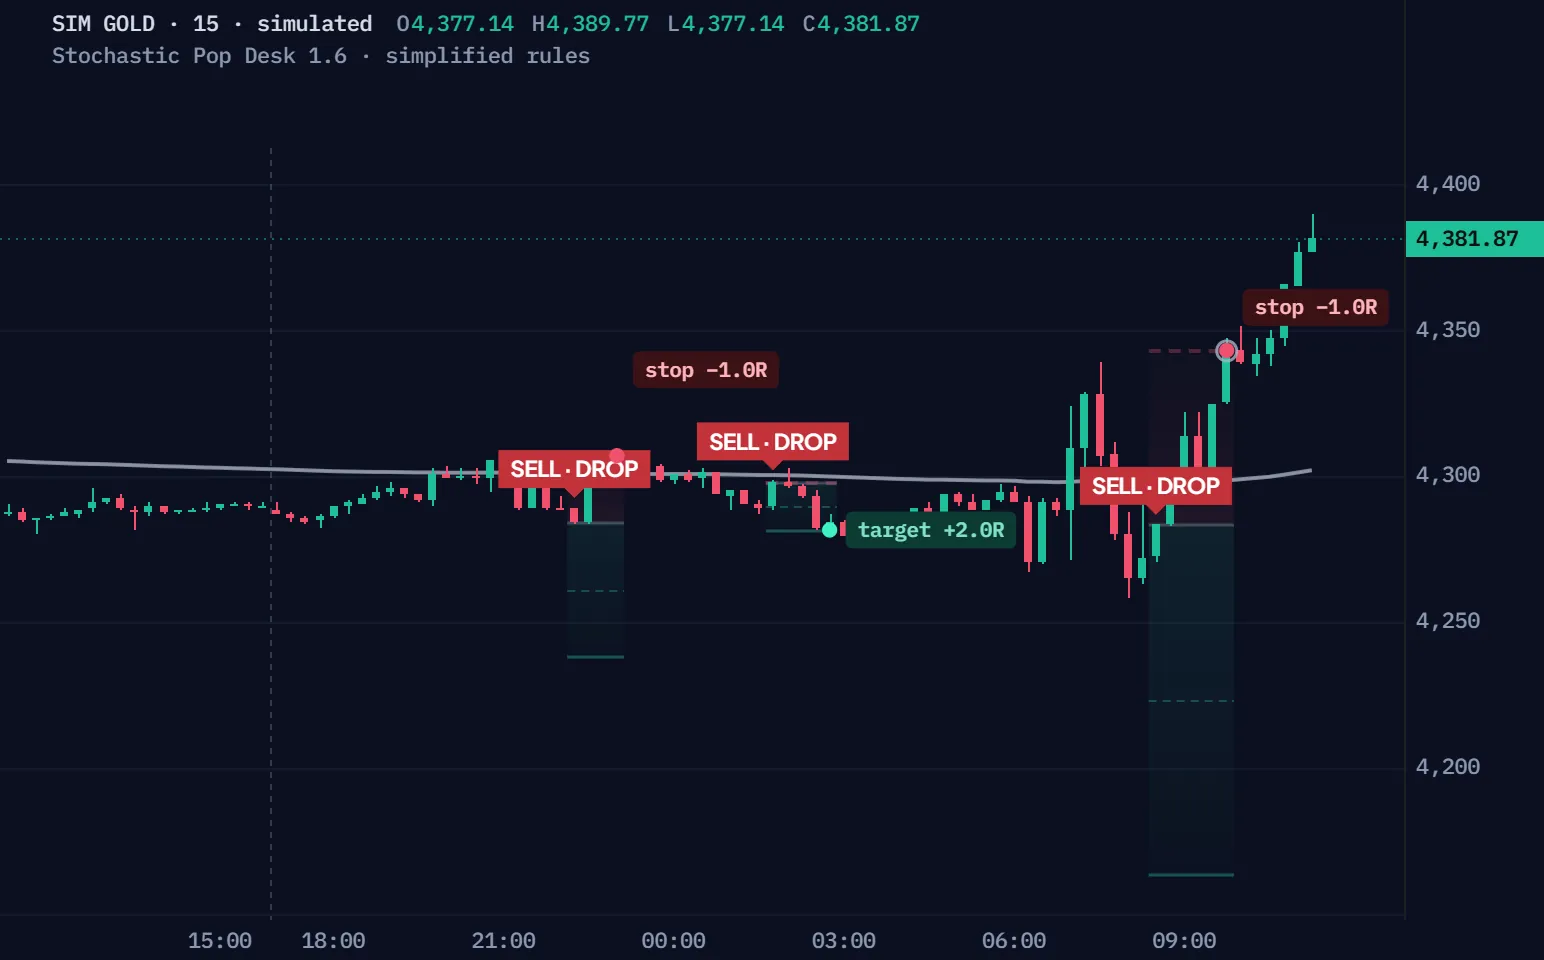
Simulated 15-minute gold bars, not a real market, run through Stochastic Pop Desk's rules, simplified for the browser. Quiet bars run as a time-lapse; the bars that matter slow down. Window 1 is the first simulated window whose pop reaches TP1, so every step shows; Another window plays the next simulated windows in order, whatever they do. A trade that enters within 40 bars of the last one's close plays in the same window. R is before costs.
| Time | Event | Prices |
|---|---|---|
| 13:15 | Window opens | Close 4,292.29 · EMA 200 4,304.04 |
| 22:15 | DROP ▼ · short at the close | Entry 4,284.13 · stop 4,307.01 · TP1 4,261.25 · TP2 4,238.37 |
| 23:00 | exit short · stop −1.0R | Exit 4,307.01 |
| 01:45 | DROP ▼ · short at the close | Entry 4,297.68 · stop 4,305.75 · TP1 4,289.61 · TP2 4,281.54 |
| 02:30 | TP1 · stop to the entry | TP1 4,289.61 · stop 4,297.68 |
| 02:45 | exit short · target +2.0R | Exit 4,281.54 |
| 08:30 | DROP ▼ · short at the close | Entry 4,283.31 · stop 4,343.10 · TP1 4,223.52 · TP2 4,163.73 |
| 09:45 | Cross 55 refused · exit bar — next entry considered from the next bar | Line 56.3 · close 4,342.91 |
| 09:45 | exit short · stop −1.0R | Exit 4,343.10 |
Full Pine v6 source in Pine Pro Library. It draws on your chart; you place the trades.
The desk reads four steps at every close and takes a cross above 55 only when all four are true.
All four steps true, then a fresh cross above 55: long at 4,384.13, the stop and both targets set at once.
The same simulated 15-minute gold, simplified rules. This film is the first simulated window where the desk refuses a cross on its trend's side and then takes the next one. The tile words are the script's own panel.
A long needs price above an EMA 200 that is higher than ten bars ago; a short, the mirror.
The close must sit within 3.0 ATR of the EMA 200, so a pop far above it is skipped.
After a long, the line must close below 45 before the next one counts.
The line crosses above 55 on a closed bar, 5 bars or more after the last signal, and that close is the entry.
After a pop, the line has to dip below 45 before the next cross above 55 counts.
A fixed simulated example, the same bars each time: the long side starts spent, as it is after a pop, and the last close is 112. Only the pullback's depth moves; the desk's own checks run at every close.
A long side re-arms only when the line closes below 45; a short side, above 55.
Without that dip, a second cross above 55 is not taken.
On by default; turned off, every cross counts again.
No re-entry on every wiggle across 55: one dip, one pop.
The stop starts one risk away at the swing, moves to the entry at TP1, and TP2 at 2R closes the trade.
TP1, the stop to the entry, then TP2: exit long · target +2.0R.
Drawn paths, not trades: they show the rules. No partial exit at TP1; R is before costs.
The lowest low of the last ten bars, minus 0.2 ATR, for a long.
It moves the stop to the entry and closes nothing.
The final target: the whole trade closes there.
An opening gap fills first; if a bar touches both, the stop counts before the target.
Two files, the complete v1.6.0, ready for TradingView's Pine Editor.
On a phone? Send this page to your desktop.
// ═══════════════════════════════════════════════════════════════════════════════// STOCHASTIC POP DESK — EMA 200 · Stochastic POP · Analysis panel · Co-Pilot · Pine Script v6 · v1.6.0// One script that replaces three: the EMA 200 trend filter, the Stochastic POP (Jake Bernstein's method, the// ChrisMoody "Method 2" bands 55 / 45, with an EMA 4 on the stochastic line) and an analysis panel that walks the// four steps of the rule in order and tells you — in words — what is still missing before a signal can fire.//// HOW IT READS THE MARKET (trade decisions commit on CLOSED bars; live plots can move):// 1 TREND price above a RISING EMA 200 = long side only · below a FALLING EMA 200 = short side only.// 2 STRETCH the close must sit within N ATR of the EMA — a pop that starts far away is a chase.// 3 FRESH the stochastic line must have visited the other band since the last signal (no re-entries).// 4 CROSS the EMA-4 of the smoothed stochastic (14, 5) crosses ABOVE 55 → long pop · BELOW 45 → short drop.// EXIT the line crosses back through its band (momentum gone) · or a stop / target ladder · or both.// CONTEXT MA stack 5·10·20·100·200, EMA 8 / 21, RSI, volume — shown as agreements, optionally used as gates.// SWITCHES (all off by default; optional rules, no established advantage) ATR trailing stop after TP1 · session// filter · time stop · opposite-signal exit · higher-timeframe EMA agreement.//// The stochastic lives in this pane; the EMA, the signals, the trade levels, the panel and the Co-Pilot are drawn// on the price chart with force_overlay — one script, one settings dialog, two views.// Paper ledger has NO costs — a description of the past on your chart, not a prediction.// TP1 moves the stop on the confirmed close for the NEXT bar; it does not take partial profit.//// …// ═══════════════════════════════════════════════════════════════════════════════//@version=6indicator("Stochastic Pop Desk — EMA 200 · Stochastic POP · Checklist", "StochPop", overlay = false, max_labels_count = 300, max_boxes_count = 160, max_lines_count = 100) // ─────────────────────────────────────────────────────────────────── INPUTS · trend (the EMA 200 exactly as the built-in)gT = "Trend · EMA 200"inEmaLen = input.int(200, "EMA length", minval = 1, group = gT, display = display.none)inEmaSrc = input.source(close, "Source", group = gT, display = display.none)inEmaOff = input.int(0, "Offset", minval = -500, maxval = 500, group = gT, display = display.none)inSmType = input.string("SMA", "Smoothing line", options = ["None", "SMA", "EMA", "SMMA (RMA)", "WMA", "VWMA"], group = gT, tooltip = "The built-in EMA's second line: a moving average OF the EMA. Drawn dotted; it does not affect signals.", display = display.none)
No coding needed.
stochastic-pop-desk-strategy.pine
The same rules as native orders, for TradingView's Strategy Tester on a second chart, with commission and slippage set in the file.
The full source: read it, change it, keep it.
The indicator draws; the strategy twin runs the same rules in the Strategy Tester.
Any symbol and timeframe TradingView loads; the films here use simulated 15-minute gold.
Eight named alerts: POP, DROP, TP1, the momentum exit, TP2, Stopped, Ready and Trend flipped.
The page, the films and the manual are open to everyone. The code, both files, is in Pine Pro Library: $49 once for every desk and every update, or included in the Complete Suite. Sign in to copy or download.
No measured edge. Older tests on three charts, costs on, shaped the original exit default, and the fast chart lost; those figures do not validate this version, and fresh checks are pending. The lab notes have the history.
Read the Missing line: it names what failed, such as the trend, the stretch, the fresh pop, the cooldown or an exit bar.
No Stochastic Pop features. It holds the other things we make, for one payment, Pine Pro Library among them, so this desk's code comes with it.
We, ProEA Lab, build Stochastic Pop Desk. The films run its rules, simplified, on simulated candles, not market data; R is before costs. Not financial advice.
Complete Suite · $97 · one payment
The Suite adds no Stochastic Pop features; it includes Pine Pro Library.
Every rule, setting and check, one topic at a time.
Stochastic Pop Desk · v1.6 · Pine Pro Library
EMA and stochastic describe past price. The checklist makes each decision inspectable.
TradingView indicator + strategy. The indicator does not predict prices or place orders.
Direction and distance from the trend line.
Reset, then momentum crossing its band.
Four checks, a trail and a drawn plan.
Stochastic Pop Desk is a TradingView indicator in Pine Pro Library that combines smoothed stochastic crosses with EMA trend, distance, reset and timing checks. These describe past price; they do not predict the next move. The checklist explains each decision, and a separate strategy tests entry rules with native orders and costs.
Staying above 55 is not a fresh cross. After an accepted long signal, the default reset requires a confirmed reading below 45. Trend, distance, cooldown, required history and open-trade checks still apply. An exit candle cannot re-enter. Read POP and DROP conditions
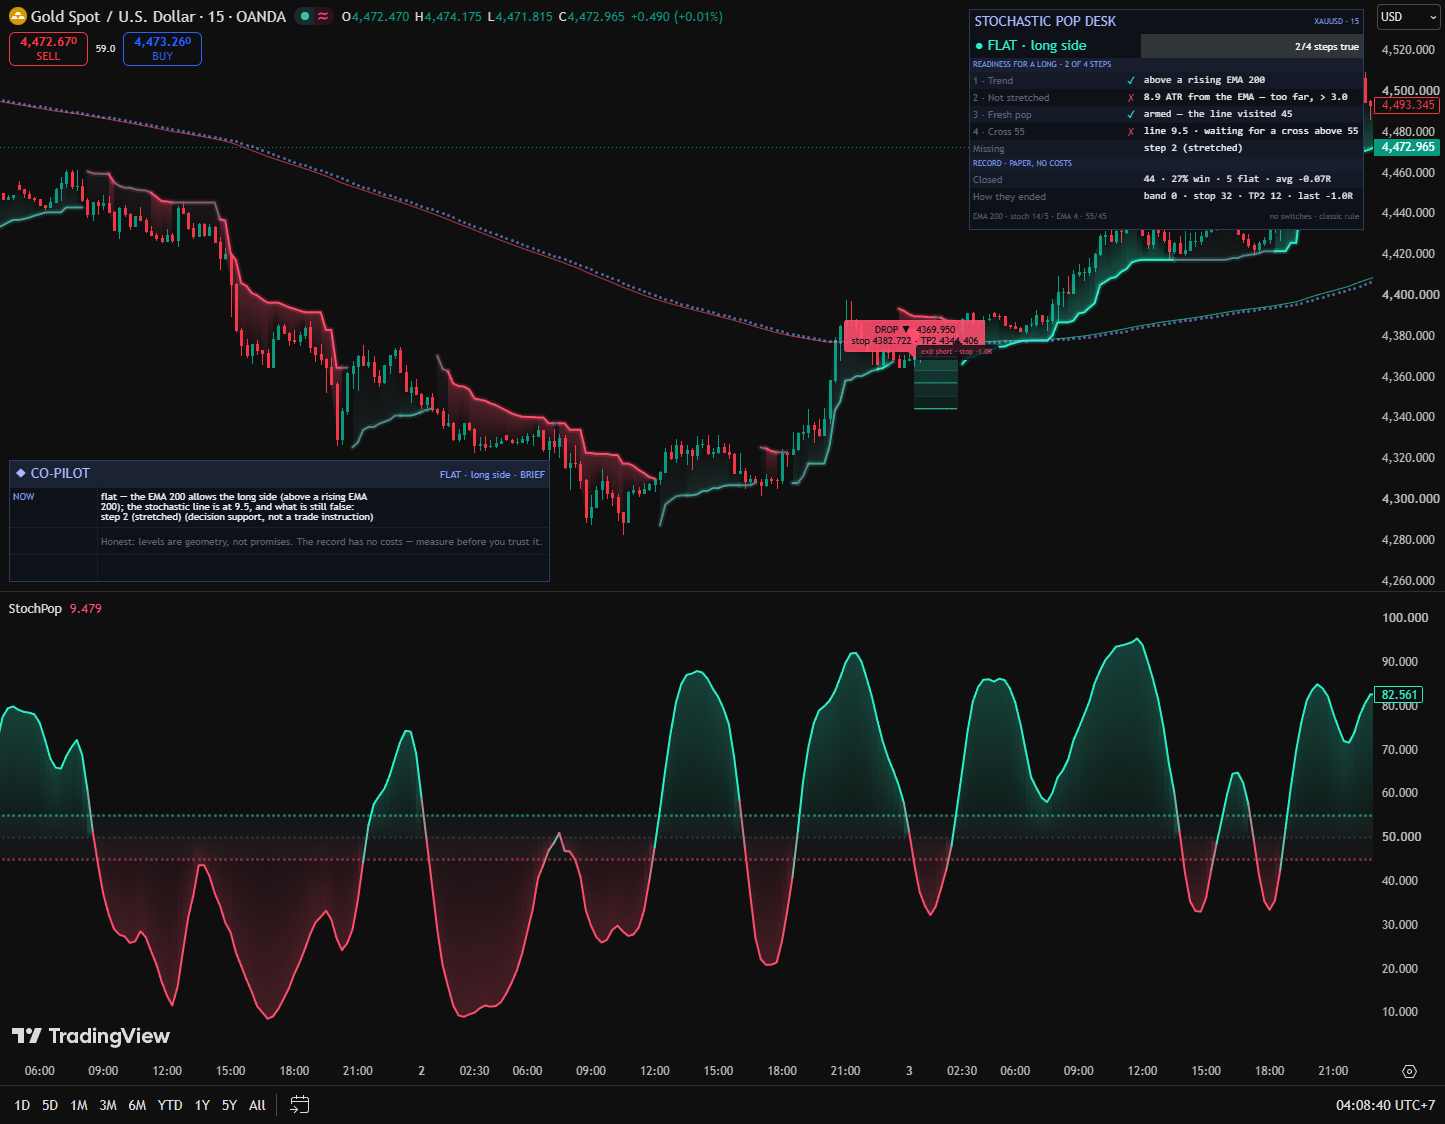
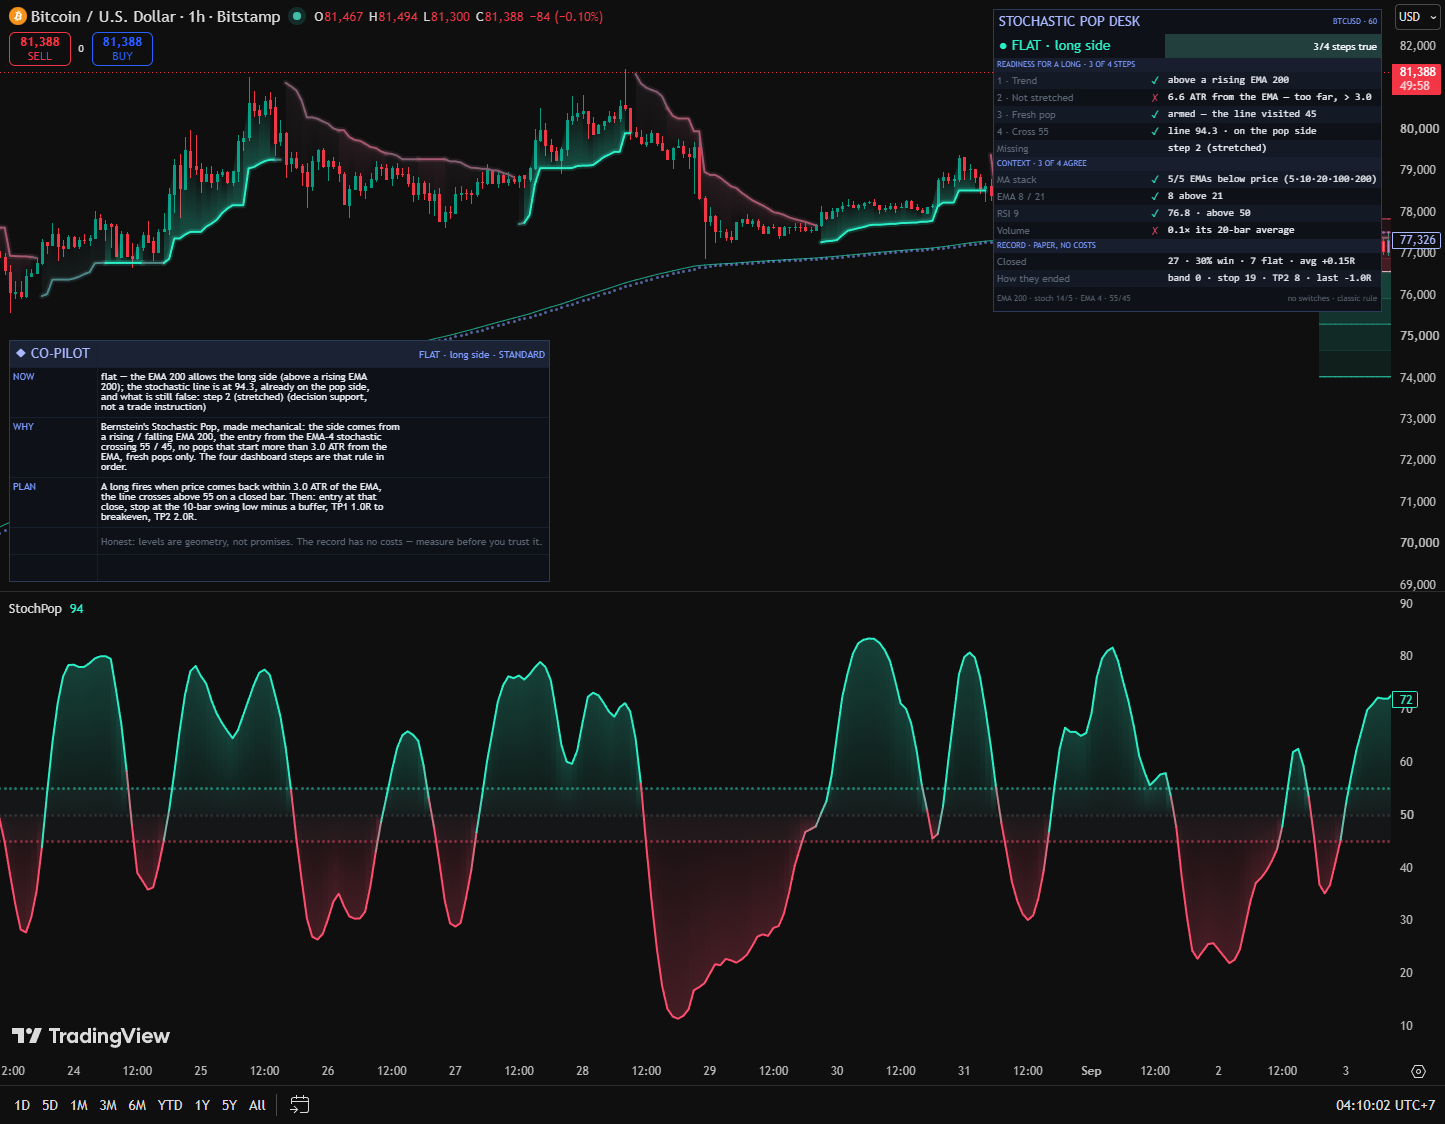
The lower pane shows the smoothed stochastic and its trigger bands. Price-chart overlays show the EMA, trail, reference ticket and checklist. Read both together: the oscillator crossing a band does not satisfy the other entry checks. Read the two-panel guide
No. The sideways flag describes low directional efficiency relative to recent history. Blocking new entries while flagged is an optional setting and is off by default. Turn it on only when you intend to test that additional filter. Read the sideways filter rules
Combined by request. Built for repeatable decisions.
EMA describes direction; stochastic locates price in its range. Both lag.
Trend, distance, reset and timing qualify entries. Entries can lose.
Test costs and separate periods. There is no established predictive advantage.
Candles show price. The blue running average weights recent closes more. Its length is 200. Price is above it; the average is higher than ten candles ago. Long ideas are allowed.
Fictional prices; calculated lines. An earlier long has already used its reset.
Reveal ten candles. Compare the final decision.
An earlier long used its reset. Staying above the average or above 55 does not create another entry.
Compare cases at the same candle. Pullback changes recalculate both panels.
330 generated bars warm up EMA 200, ATR 10 and stochastic 14 → SMA 5 → EMA 4. Supplied trade state: flat, cooldown complete, long reset already spent. The warm-up is not claimed to have produced that earlier signal. Optional agreement gates and exits are off. These are fictional prices, not live market data.
No. Stochastic describes price location in a recent range. Smoothing slows its changes. It does not measure buying volume or the chance of the next move.
Price above. Momentum below.
EMA and the trail are separate.
POP crosses up; DROP down. Check every condition.
Read Missing. READY alone is not entry.
Change the close, pullback, reset rule and confirmation. Lines recalculate from fictional prices.
Change the close or pullback. Candles, EMA and stochastic recalculate.
Stochastic 14 → SMA 5 → EMA 4. Strict long reset below 45, cross above 55. EMA slope: ten bars. ATR: ten bars.
Entry 112.00; stop 90.28; targets 133.72 / 155.44. Paper replay checks opening gaps first, then stop before target. Updated stops apply next candle; exit candles cannot re-enter. This lesson does not simulate native strategy fills.
Calculated events: candle 10: Long pop.
Illustrative inputs · changing a slider recalculates this example · no market feed
Pine v6 scripts · Pine Pro Library.
Create an indicator.
Replace the sample.
Save with defaults.
Opens in its own pane and on price.
Copy the code as it is. No coding needed.
Native orders on a second chart; separate from paper.
Copy the code as it is. No coding needed.
Allow enough loaded history. Check Missing, the fresh reset and cooldown. A line staying beyond its band is not a new cross.
Rules and settings.
Long: close above EMA 200; EMA above its value ten candles ago; price within 3 ATR of EMA; a new smoothed cross from 55 or below to strictly above 55. ATR measures recent price movement, including gaps.
Fresh pop: a reading strictly below 45 re-arms an accepted long. Shorts mirror this: falling EMA, cross below 45, reset above 55. Both reset flags start ready.
Wait five candles after either side’s signal. Entry requires a closed candle, sufficient history and a flat plan. An exit candle cannot create a new entry. The strategy also requires its native position to be flat.
Price chart: EMA, trail, tickets, levels and panels. Lower pane: stochastic 14 → SMA 5 → EMA 4. This smoothed line crosses the bands.
The extra SMA 5 and EMA drawing offset are display-only; neither changes entry calculations.
1R is initial entry-to-stop distance. Default long stop: ten-bar lowest low, including entry, minus 0.2 ATR. This is a rolling extreme, not a confirmed pivot. ATR mode uses 2 ATR without the buffer. Levels round to tradable ticks.
New paper stops apply next candle; entry-candle wicks cannot stop a new plan. Ladder modes require TP2 above TP1. With native close processing enabled, a newly submitted marketable stop may fill at that closing tick.
Stop / targets only is default. Band cross back only exits a long on a cross back below 55, a short above 45, and disables the stop/target ladder. Band cross back or TP2 keeps the ladder plus that band exit.
The chandelier-style trail uses price extremes and an ATR offset. It updates on confirmed closes and flips on a qualifying close through the prior trail. Color shows EMA-slope agreement; sideways turns it grey. Drawing it is on; using it as a stop is off.
ATR trailing after TP1 follows the close. Stop follows the trend trail uses the previous candle’s trail state: From entry can tighten the initial stop when direction agrees; After TP1 waits. An opposing prior trail can request a TRAIL close after one held candle.
Efficiency divides net progress by total close-to-close travel over twenty candles. Rank it against two hundred valid values: flag at or below the lowest quarter; release above the fortieth percentile. No travel means zero efficiency.
This describes recent price. Blocking entries while flagged is optional and starts off.
Signal needs: Trend + POP only is default. Majority needs more than half of enabled agreements; all needs every one. None enabled passes. “MA stack” checks price against four of five EMAs; “EMA 8/21 cross” checks ordering. RSI checks its side of 50; volume compares with its average.
Higher timeframe: uses the last closed higher candle. When enabled, an equal or lower timeframe raises an error; missing history blocks readiness. Sessions: use candle opening time and the configured timezone.
Opposite exit: needs an opposite oscillator cross, not a full opposing setup. Time stop: exits after the selected wait only if TP1 has not been reached. These switches all start off.
State: trend or open plan. Missing: failed checks. Trade card: entry, stop, targets and exit rule. Record: paper outcomes without costs.
The Cross tick means currently beyond the band. READY includes cooldown and required history; Missing names blockers. Live readings are marked preview. A fresh cross must pass all checks again at close.
Brief shows NOW; Standard adds WHY and PLAN; Detailed adds record and glossary. Showing context rows does not enable a gate.
All sixty-two inputs, in settings order. Indicator and twin share the rules; the twin initially hides risk zones, dashboard and Co-Pilot.
The main EMA selects the side. Its extra smoothing line and drawing offset do not change signals.
Stochastic → SMA → EMA. After a signal, that side needs a reset across the opposite band before another fresh cross can qualify.
Context by default; optionally require a strict majority or all enabled checks.
TP1 changes the stop without partial profit. TP2 must exceed TP1 in ladder modes.
Seven optional rules, all off. Higher-timeframe agreement requires valid history above the chart timeframe.
Three themes. The trail is visible by default; its distance also affects the optional trail stop.
Readiness, live preview and paper outcomes. The record excludes costs.
Choose explanation depth, position and text size.
Dynamic POP, DROP, TP1 and EXIT messages. Recreate alerts after changes.
Eight named conditions: POP long, DROP short, TP1, Momentum exit, TP2, Stopped, Ready and Trend flipped. Stopped includes SL, BE and TRAIL.
Any alert() function call sends POP, DROP, TP1 and EXIT as JSON or readable text. It does not send Ready or Trend flipped. The payload includes entry, sl, tp1, tp2, stoch, ema200, reason and optional r.
Committed entries and trade events use closed candles. Ready and Trend flipped are also explicitly close-gated. Recreate alerts after source or settings changes. Native order-fill alerts and paper events are separate.
Twin defaults: capital 100,000, quantity 1, commission 0.02 percent per order, five ticks slippage. Ladder orders protect the native position until flat. TP1 takes no partial exit. Entries request signal-close fills; simulated prices can differ.
The twin’s record compares native exits with signal-close geometry, without costs. Use Strategy Tester for simulated fills and net results.
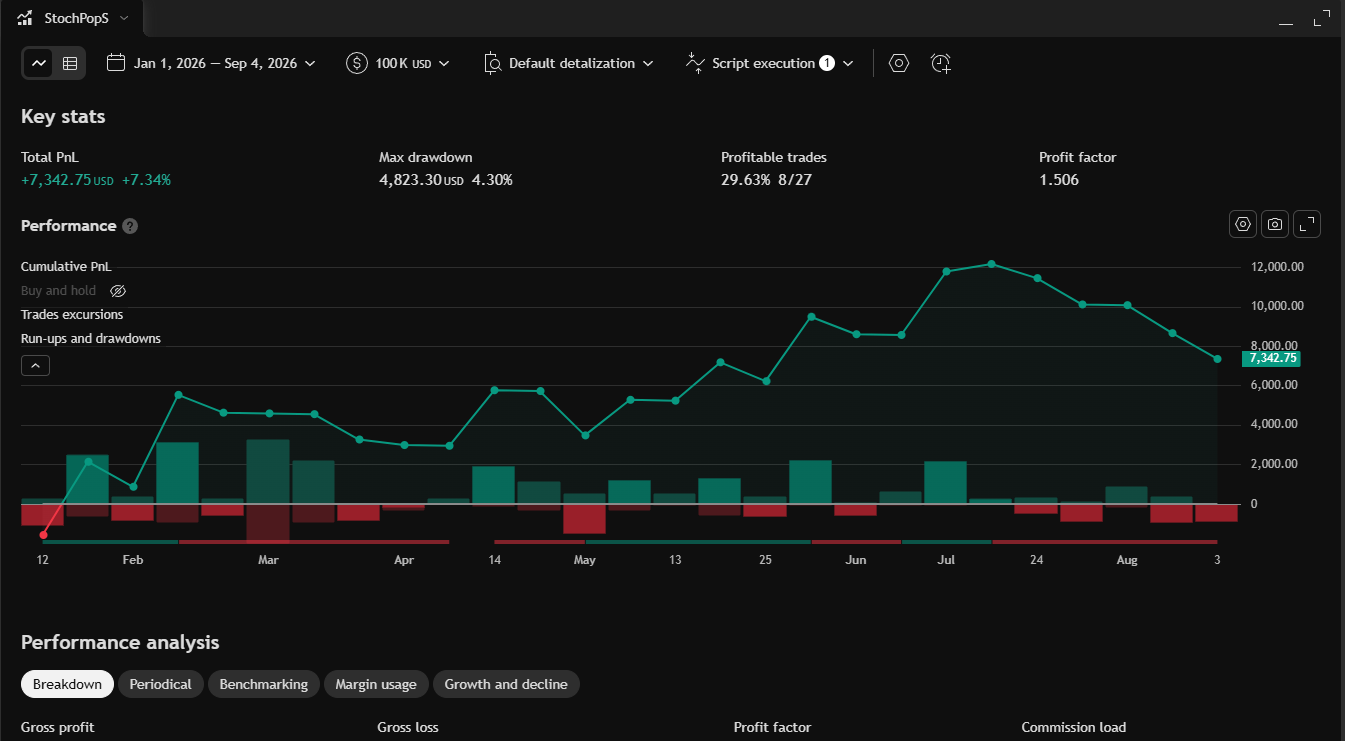
Older in-sample tests compared exits and switches on three charts with costs on, informing the original ladder default. The fast chart lost. Those figures do not validate the changed engine.
Fresh chart-runtime checks and measurements remain pending.
Read the historical lab notesA live candle can change before close. Different history, feeds, timeframes or inputs can recalculate results. EMA and smoothing respond with a delay; higher-timeframe agreement uses the last closed higher candle.
The indicator’s paper record excludes costs and execution frictions. The strategy models fills under your settings. Neither establishes a predictive advantage. Trading risk is yours; this is research tooling, not financial advice.
What shipped and what changed in Stochastic Pop Desk, newest first. Ask for the next change below; what gets built lands here with a date, and on the lab queue on the front page.
Readiness, gap handling and native strategy orders v1.6.0 Updated Stochastic Pop Desk
Readiness, gaps and native orders updated; server compilation passed; attached-chart runtime checks and fresh measurements remain pending.
Stochastic Pop Desk v1.5.0 Shipped
Checks momentum, trend and timing before an entry.
Three scripts, one checklist Request Stochastic Pop Desk
The ask it was built from: an EMA 200, the Stochastic Pop with an EMA on the line, and an analysis table, combined.
“An EMA 200 with its smoothing line, the Stochastic Pop with an EMA 4 on the line, and an analysis table. Can these be one script that says what is missing?”
Measured on three charts before it shipped Lab note Stochastic Pop Desk
Run with costs on across three charts. The textbook exit closed trades early; the plain ladder became the default. The fast chart lost.
A small friction or a big idea. Tell us what would make this tool work better for you.
Requests for a new tool go on the same queue: see what is asked for and what is being built.