Accumulation
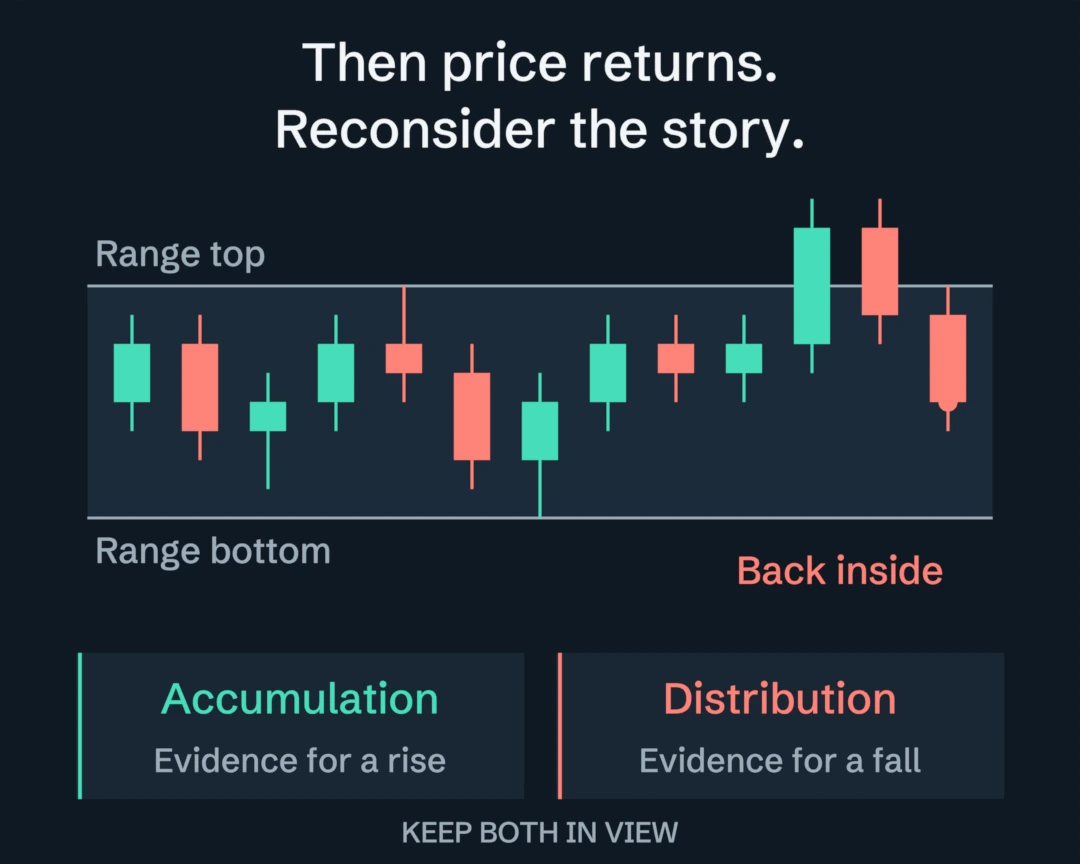
Could selling be getting absorbed, building a case for a later rise?
Compare evidence for a rise and a fall. Follow what changes before calling it a setup.
Get the code ↓Start with Base · optional Footprint and Lab
Wyckoff Evidence Desk compares accumulation and distribution hypotheses on the same chart. It shows each side’s range, confirmed events and reasons to wait or invalidate it. Contested means both paths remain plausible. The scores are independent rules, not calibrated probabilities. Start with Base; Footprint and the Lab are separate editions.
No. ACC and DIST collect separate rule-based evidence; their scores need not add to 100. Contested means two active hypotheses are too close to choose a clear leader. A qualifying backup needs acceptance, a later return and the configured evidence, lead, volume and context checks. Read the evidence map
Base and Lab make no Footprint request. Only the separate Footprint edition needs an eligible TradingView account and feed. Base uses standard candle prices and available volume; missing volume still permits price-only hypotheses but blocks qualified setups by default. The code of all three editions is in Pine Pro Library, $49 once. Choose the edition to install
The producer reports native synthetic engine checks and Base chart runs on micro Nasdaq and EURUSD. Those checks do not prove trading outcomes. Its small development Lab sample lost money; Footprint native execution and held-out market validation remain unverified. Read the evidence and limits
Wyckoff studied price and volume together. This desk turns selected ideas into explicit, revisable rules.
Could selling be getting absorbed, building a case for a later rise?
Could demand be weakening, building a case for a later fall?
The tool tests both explanations. “Contested” means two active hypotheses have similar scores.
These are hypotheses about price behavior. Candles do not reveal anyone’s hidden intentions.
The public Wyckoff Method overview relates price, volume and the development of trading ranges. Its examples include paths without a Spring or UTAD. This desk formalizes a selected subset with its own numerical rules; it is not an official Wyckoff Analytics product or a complete implementation of the method.
The first improvement is keeping competing explanations visible. The next is recording events only when their rules can be confirmed, including failed breaks. Read the reason beside the label, rather than fitting the chart to a perfect historical drawing.
The letters describe what has been observed. They do not promise what comes next.
Wait for the opposite boundary and a test. The first candidate is provisional.
Price works inside a known range. A balanced-range start can begin here.
A Spring or UTAD can recover a breached edge. This phase is not mandatory.
A decisive break still needs two consecutive closes beyond the boundary allowance.
A later backup can become a setup if its checks pass. Structural failure can still end it.
There is more than one route. A valid range can move directly from B to D. A failed idea may return to range-building or reset to scanning.
It gives you a hypothesis to test, the missing evidence and the point where that hypothesis fails. Start in Bar Replay: follow events from their confirmation candles, including failures. Then test a specific entry and risk rule on different data with realistic costs.
The indicator does not place orders. A qualified setup is not proof of an advantage. The supplied Strategy Lab’s small development sample lost money; the tool has not established profitability.
A higher score means more supporting rules, not a greater proven chance of winning.
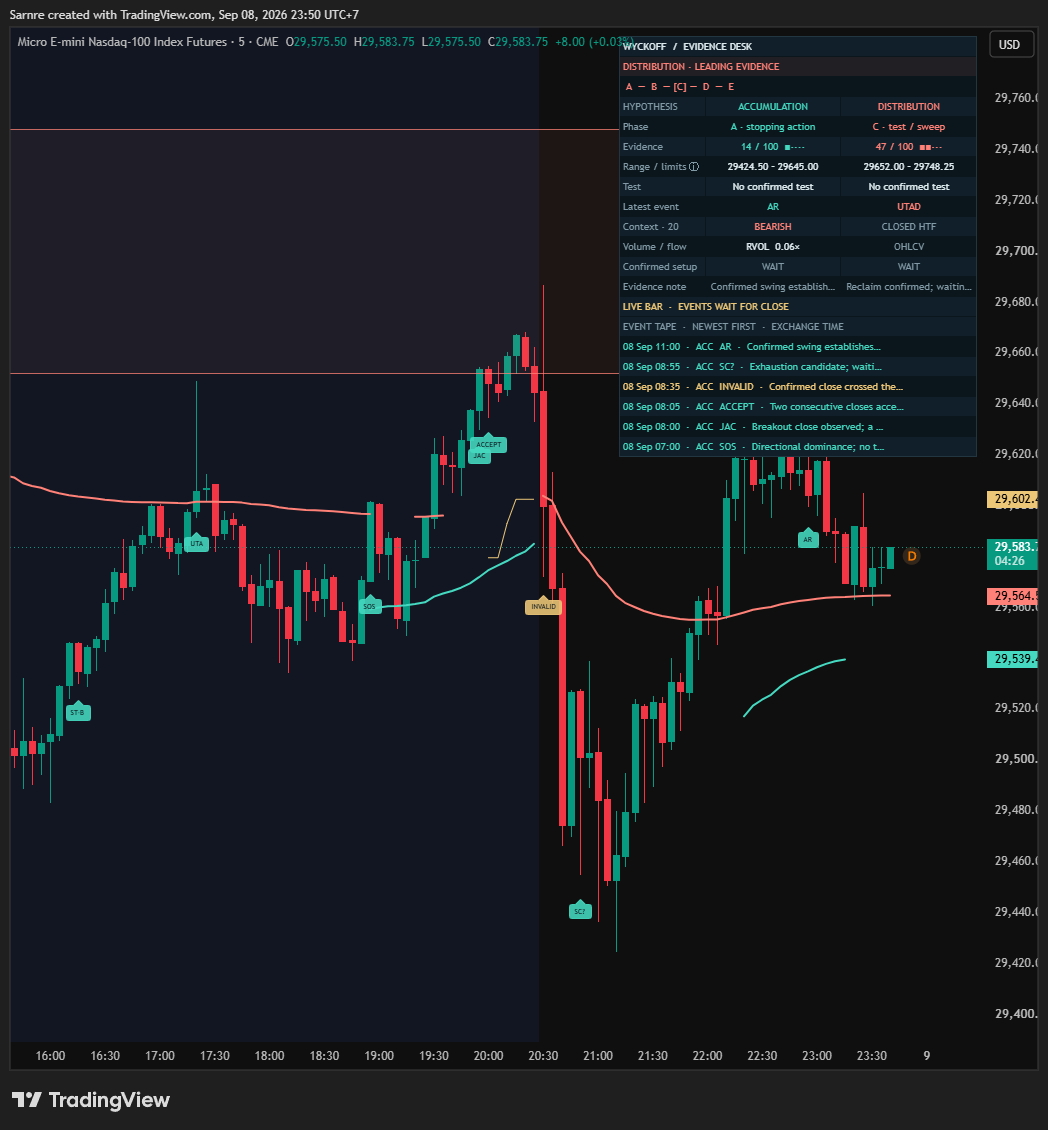
ACC and DIST have independent scores. They do not need to total 100.
Hover for the full reason. A question mark marks a candidate. An INVALID label records a failed structure.
WAIT means no newly qualified setup on this bar. It is not a pending broker order.
Three separate Pine v6 files. Each works as a complete script.
Use standard candles with available volume and enough history.
Create a new indicator, save, then Add to chart.
Read both columns. SCAN can simply mean the tool is still waiting.
START HERE
Uses candle prices and volume. No Footprint subscription is required.
Copy the whole file. No coding needed.
Uses classified buy/sell volume as one extra clue. Requires TradingView Premium or Ultimate and available Footprint data. Base works separately.
Unavailable data means no extra evidence. It is not zero delta or verified exchange aggressor flow. See TradingView’s Footprint documentation.
Copy the whole file. No coding needed.
A separate strategy tests qualified backups with simulated orders and costs. It uses fixed quantity, not fixed cash risk. Its initial development sample lost money.
Copy the whole file. No coding needed.
Pine Editor installation walkthrough · Recreate alerts after changing the script or its inputs.
Exact rules, settings and test limits.
The classical route starts with a provisional stopping candidate (SC? or BC?). Its extreme may change until a confirmed automatic reaction (AR) supplies the other boundary. The default pivot needs three bars on each side; its label appears when confirmed, not at the earlier turning point. A subsequent qualifying lower-effort secondary test starts B.
The optional balanced-range start uses the previous 30 bars, movement efficiency below 0.30, and width between 2.5 and 10 current ATR by default. It begins in B as TR? and explicitly says Phase A was not observed. Boundaries freeze once AR or bootstrap establishes them. B must develop for at least eight bars before the relevant sweep or strength transition.
A–E are the engine’s states, not proof of accumulation, distribution or institutional intent. SCAN means no active episode; a preliminary PS?/PSY? observation does not establish a range.
No. A mature B range can move directly to D on the engine’s directional-strength conditions. The optional C route starts with a breach beyond the boundary allowance and within the maximum sweep depth. A pending SWEEP? must recover by the configured deadline; this is a real later close, not future information attached to the past.
A confirmed Spring or UTAD is classified by relative volume: type 1 at least 2, type 2 at least 1, type 3 below 1. Those are this release’s thresholds. Type 1/2 require a subsequent qualifying lower-effort test. Type 3 waives that test but still needs strength, acceptance and backup. “Test confirmed” and “Type 3 · test waived” are different observations.
A candle crossing both boundaries is ambiguous because OHLC cannot reveal its intrabar order. More severe invalidation takes priority. Distribution mirrors the price-direction conditions.
A decisive breakout meeting the directional-strength rule starts the acceptance check. Two consecutive closes beyond the boundary allowance establish ACCEPT and phase E; the original breakout candle counts as the first when the next close follows through. A close back inside the allowance resets that count; later acceptance closes do not recheck the original strength rule. ACCEPT still waits for a later return, called a backup (BU).
For the accumulation side, the later candle reaches the breakout area without exceeding allowed depth, closes at or above the range top with a bullish body, and has RVOL at most 1.3 when volume is available. Existing invalidation rules run first. Distribution reverses the price conditions.
A fresh BU is checked once against the configured gates: default score at least 65, lead over the opposing score at least 10, volume available, and higher-timeframe context not opposing. A blocked BU is consumed; later improvement does not retry it. It is one opportunity per episode, not a queued order.
CONTESTED is a display rule: both hypotheses are active and their score difference is at most 10. The entry lead input is separate. At exactly 10 points, a fresh BU can satisfy the default lead gate while the display still says CONTESTED.
Each hypothesis starts from its current phase: A 12, B 25, C 40, D 55, E 65. Additions are: test requirement satisfied +8 (including type 3 waiver), volume contraction +5, close on the supportive AVWAP side +5, aligned higher timeframe +7, supportive close location +5. Opposing higher-timeframe context subtracts 8.
Bootstrap subtracts 5; unavailable volume subtracts 15; a pending reclaim subtracts 8. Footprint can add 5 when directional delta divided by total volume exceeds 0.10. Scores are bounded to 0–100 independently. They are not calibrated probabilities, and need not sum to 100.
Adaptive RVOL compares volume with the median of earlier bars. The engine also uses prior 90th-percentile volume/spread references. This is a local baseline, not an adjustment for typical activity at each time of day. Volume can mean different things across feeds, including tick volume.
AVWAP starts at the bar when an episode is observed and accumulates typical price times available volume. It is a weighted price reference, not a volume profile or POC. A failed breakout that returns to B keeps the episode’s anchor; a full reset clears it.
The context uses completed higher-timeframe bars, with a one-bar offset and lookahead enabled. Automatic context is approximately four times the chart timeframe, mapped to a supported interval. With the context switch on, the interval must be larger than the chart. Neutral context is permitted; opposing context blocks the default setup. Turning it off removes its score adjustment and gate.
Core events commit on closed chart bars. Pivot confirmation is delayed. Revised feeds, changed inputs or different loaded history can change a recalculated path. Footprint has additional historical-data limitations; absolute non-repainting is not claimed.
Before acceptance, an episode expires when its age exceeds the configured maximum. Phase E does not expire from that age setting; it ends through structural failure. The original Thai manual’s general phase-E expiry wording should be read with this source distinction.
Too many consecutive adverse closes or a wick deeper than the maximum allowed excursion fully reset an episode, even if a deep wick recovers. A failed phase-D breakout can return to B and restart its development clock within the same episode. Phase E can fail on a close through its breakout boundary or its previously established structural trail.
The trail only tightens. Its plot is not a broker stop. ATR-based boundaries can move as ATR changes; decisions use the closed bar. Ended events remain in the short event tape, not in an unlimited permanent history.
The three named conditions are Qualified bullish backup, Qualified bearish backup and Confirmed reclaim. The first two mean a new setup passed its gates; a reclaim alone does not. Create alerts with closed-bar frequency and recreate them after changing source or inputs.
Emit JSON event alerts starts off. With it enabled, create Any alert() function call to receive raw events, including INVALID. The payload includes side, phase, event, evidence and volume availability. Its barTime is the candle’s opening timestamp; the event is confirmed at its close. Only the final event per side on that bar is emitted.
This version has no Setup ID export, frozen trade-plan journal or full-history guarantee. Labels are bounded; the event tape keeps six latest events across both sides, in exchange time. Strategy order-fill alerts are a separate stream.
Base has 26 inputs, Footprint 27 and Lab 31. Shared defaults are identical. The edition label identifies the extra controls.
Requires an eligible TradingView account and feed. Base and Lab make no Footprint request. Classified volume is not verified exchange aggressor flow.
Minimum 1. Directional delta/total above 10% adds five evidence points; unavailable data adds none.
Uses current chart ATR14 and previous-bar volume/spread baselines. With defaults, detection can begin on candle 87 if ATR is available. Change one rule at a time.
Range 2–10. Confirmation arrives three bars after the pivot; labels appear at confirmation.
Range 20–200. Prior median and 90th percentile of volume/spread; no session-seasonality adjustment.
Range 15–100. Bootstrap also needs path efficiency below 0.30 and width at most 10 ATR.
Starts TR? in phase B when observed; never invents an earlier stopping event.
Range 3–80. Counts from phase-B start or restart before a sweep or strength transition.
Range 1–5. Also limits breakout waiting; sustained invalidation needs more than this many consecutive adverse closes.
Range 40–1500. Expires when age exceeds this limit, before phase E only.
Range 0.05–1. Shared edge allowance; also pads the Lab’s signal-candle stop.
Range 0.5–4. A deeper adverse wick ends the episode even if its candle recovers.
Range 1–8. Applies when AR fixes the opposite edge and when bootstrap begins.
Range 1–8. Phase-E trail only tightens. A later close beyond the prior trail ends the episode; it is not a broker stop.
ACC and DIST scores are independent rule-based evidence, not calibrated probabilities. A BU event is checked once; failing a gate does not queue a later entry.
Opposing context blocks qualification; neutral is allowed. Off removes its score adjustment and gate.
TradingView maps 4× to a supported interval. With context On, it must exceed the chart timeframe.
Off allows price-only qualification. Missing volume still lowers the evidence score.
Range 40–95. Applies on the backup event, alongside the other gates.
Range 0–40. Qualification uses this input; the display’s Contested threshold stays fixed at a 10-point gap.
Create Any alert() function call. Raw events include side, phase and score; they are not all qualified setups.
Qualified backups only. Brackets freeze at signal close and submit with next-open entries. Gaps/slippage change realized risk. The producer’s small development sample lost money.
Inclusive signal candle’s opening time; the later fill may fall outside the window.
Inclusive. An open position receives a market-close instruction once outside the window.
Minimum 0.000001. Explicit entry quantity overrides Properties’ default size; it is not fixed cash risk.
Minimum 0.5. Stop distance is at least one current ATR from signal close.
Range 5–1000. Counts from the filled entry bar; market-close instruction processes on the next tick.
Display switches do not change the engine. Earlier plotted history is bounded; changing inputs rebuilds it from loaded data.
Hover table cells for full reasons and boundaries.
Six events across both sides, newest first in exchange time. Needs the dashboard visible.
Labels sit on confirmation candles, including delayed pivots.
Dashed when contested. Boundaries freeze after AR or bootstrap; preliminary climax extremes can move.
Starts when the episode is observed; uses available volume. It is not volume profile or POC.
Visible only for an uncontested leading phase-E hypothesis; separate from the Lab bracket.
Optional chart tint; setup diamonds remain separate.
Range 10–100, shared by both hypotheses. Oldest labels are removed; event tape retains six.
Top or bottom, left or right.
The Lab submits a market entry and fixed bracket after a qualifying BU while flat. The order normally fills at the next available open. Default quantity is one unit, not fixed cash risk. Stop distance is at least one signal-bar ATR; the target is two times the risk measured from the signal close.
Its bracket remains tied to that signal and does not follow a new episode. Gaps and slippage can change actual risk. The 100-bar holding limit counts from the filled entry. The date window filters the signal candle’s opening time, so a later fill can fall outside it. Market-close instructions execute on a later tick.
The default experiment includes 0.05% commission per order and two ticks of slippage. Set costs, quantity and Properties for the instrument. Keep the shipped recalculation switches off when comparing with the supplied results.
The producer’s three native Pine probe suites report 889 assertions over 25 synthetic scenarios and 129 frames. These exercise the embedded engine, not 889 trades or independent market samples. The website import checks the supplied evidence and rebuilds sources/probes; it does not claim a new run of those 889 assertions.
All three served scripts were freshly compiled with TradingView: zero errors and warnings. Compilation does not establish runtime data availability. The producer’s Basic account could not run Footprint, so its runtime remains unverified in that account despite successful server compilation.
The initial Strategy Lab sample lost money. Eight closed trades totalled −$446.03 under its stated development settings and costs. It is a small functional smoke check, not evidence of a profitable strategy or performance across markets.
Website verification and limits · Original verification record · Fresh compiler evidence
What shipped and what changed in Wyckoff Evidence Desk, newest first. Ask for the next change below; what gets built lands here with a date, and on the lab queue on the front page.
Wyckoff Evidence Desk v1.0.0 Shipped
Compares two possible market stories and shows what supports or weakens each.
Engine checks and separate market limits Lab note Wyckoff Evidence Desk
Producer engine probes passed; the small development Lab run lost money. Evidence scores remain uncalibrated.
A small friction or a big idea. Tell us what would make this tool work better for you.
Requests for a new tool go on the same queue: see what is asked for and what is being built.