
Strategy Lab · optional
opening-range-desk-strategy.pine
The same rules as a strategy, with fees and slippage, for TradingView's Strategy Tester on a second chart.
It marks the first fifteen minutes, waits for two closes beyond them, then sets the stop and both targets at once.
Session 1 · first to reach TP1
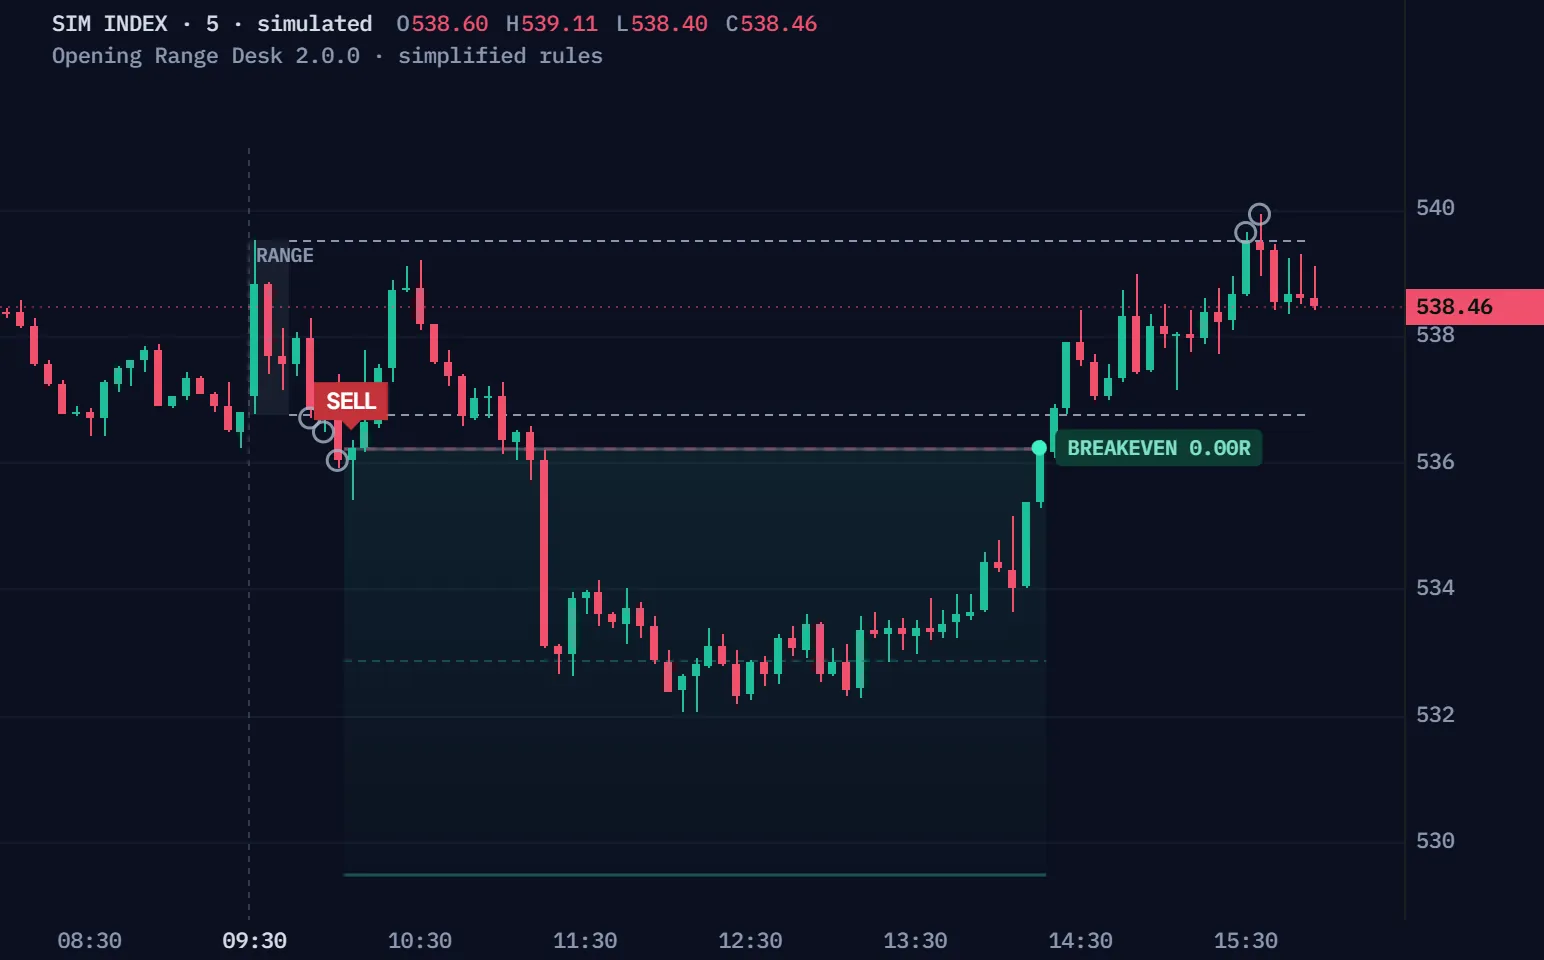
Simulated five-minute bars, not a real market, run through Opening Range Desk's rules, simplified for the browser. Quiet bars run as a time-lapse; the bars that matter slow down. Session 1 is the first simulated session whose trade reaches TP1, so every step shows; Another session plays the next simulated sessions in order, whatever they do. R is before costs.
| Time | Event | Prices |
|---|---|---|
| 09:45 | Range set | High 539.51 · low 536.75 |
| 09:50 | Wick below · no close | Wick 536.70 |
| 09:55 | Wick below · no close | Wick 536.48 |
| 10:00 | Close 1 of 2 below | Close 536.03 |
| 10:05 | SELL · two closes below | Entry 536.23 · stop 539.60 · TP1 532.86 · TP2 529.50 |
| 11:20 | TP1 · stop to the entry | TP1 532.86 |
| 14:15 | BREAKEVEN 0.00R | Exit 536.23 |
| 15:30 | Wick above · no close | Wick 539.63 |
| 15:35 | Wick above · no close | Wick 539.92 |
Pine v6 · the full source in Pine Pro Library. It draws on your chart; you place the trades.
One close beyond the range is a heads-up, a close back inside resets the count, and the second close in a row enters.
Two closes below 540.12: short at 539.72, the plan set at once.
The optional filters ship off: only the range and the closes decide.
Simulated five-minute bars, simplified rules; shorts mirror longs. The session is the first simulated one with a close back inside before its entry.
The first three five-minute bars set its high and low.
Each close beyond an edge counts, and a close back inside starts again.
The second close in a row beyond the same edge enters.
After the day's trade, the desk waits for tomorrow.
Drag the second close across the range's high: on the edge or back inside, the count starts again from zero.
A close exactly on the edge does not count.
One close back inside puts the count back to zero.
Two is the default; the sandbox tries one to three.
A close beyond the other edge starts that side's own count.
Every entry arrives with a stop past the range's far edge, TP1 at 1R that moves it to the entry, and TP2 at 2R, flat by 15:55.
TP1, then TP2: the library desk keeps the whole move, +2.00R. Pro, same path: half banked at TP1, the rest at TP2 → +1.50R.
Drawn paths, not trades, through simplified rules, before costs; the Pro line uses Pro's default, half off at TP1.
The range's other side, 0.1 ATR beyond it.
At 1R the stop moves to the entry, and the library desk keeps the whole position.
A bar that touches the stop and TP2 counts as the stop.
An open trade closes at the 15:55 close; a gap through the stop exits at the open.
Two files, the complete v2.0.0, ready for TradingView's Pine Editor.
On a phone? Send this page to your desktop.
Download the full package (ZIP) Both scripts, the docs, the settings reference, the tests and the licence.
//@version=6// …// The opening-range breakout as a desk: the range, the breakout closes (or a retest), the plan and the result, in words.// Every variation the thread asked about is an input: the range window, close-through or retest, VWAP and EMA filters.// Decisions happen on closed bars. The record is this chart's history after an estimated cost, not a forecast.// Rules: docs/engine-contract.md in the release · https://proea.app/en/free/opening-range-desk// …indicator("Opening Range Desk", "ORB Desk", overlay = true, behind_chart = false, max_lines_count = 500, max_labels_count = 500, max_boxes_count = 500, max_bars_back = 2000)const string ORD_VERSION = "2.0.0"const bool ORD_IS_STRATEGY = false // ═══ ENGINE · core.pinefrag ═════════════════════════════════════════════════════════════════════════════════════// The engine decides; the renderer (visuals.pinefrag) only reads. Every engine name starts with "ord" and a// capital letter; tests/display.test.mjs refuses any renderer line that assigns one. The rules are written in// docs/engine-contract.md; tests/reference/engine.mjs is the independent reference.//// ① RANGE the high / low of the bars inside the opening-range window; final on the first bar after it.// ② BREAK closes beyond an edge (+ buffer), counted to the confirmation (default 2), or a retest of the edge.// ③ TRADE entry at that close; stop at the other side (or midpoint / ATR) + buffer; TP1 → breakeven; TP2.// ④ RESULT stop first on every closed bar, then TP2, TP1, failed breakout, trail, time stop, end of window.// Decisions happen on closed bars only. A trade's geometry is frozen at entry. string ordG1 = "01 · Opening range"string ordRangeSess = input.session("0930-0945", "Opening-range window", group = ordG1, tooltip = "The bars whose highs and lows form the range: 0930-0935 = 5 minutes, 0930-0945 = 15 minutes, 0930-1000 = 30 minutes. The range is final on the first bar after the window, which can already count toward the breakout. The chart's candles must divide the window (1, 3, 5 or 15-minute candles for a 15-minute range); otherwise the desk reads UNAVAILABLE.")string ordTz = input.string("America/New_York", "Timezone (IANA)", group = ordG1, tooltip = "Both windows and the HH:MM times are read in this timezone: New York for US stocks, indices and the New York gold open.")string ordTradeSess = input.session("0945-1555", "Trade window (entries allowed)", group = ordG1, tooltip = "Entries only while a bar opens inside this window.")bool ordEodFlat = input.bool(true, "Flat at the end of the trade window", group = ordG1, tooltip = "An open trade closes at the close of the window's last bar, the bar that reaches the window's end (15:55 on 5-minute candles, 16:00 on 15-minute candles). Nothing is held overnight, and no new trade opens on that bar.")string ordLastEntry = input.string("", "Latest entry time · HH:MM in the timezone (blank = the whole window)", group = ordG1, tooltip = "No new trade opens on a bar that starts after this time; an open trade is still managed to the end of the window.")float ordMinRange = input.float(0.0, "Skip the day if the range is smaller than N × daily ATR (0 = off)", minval = 0, maxval = 3, step = 0.05, group = ordG1, tooltip = "The range height is compared with the daily ATR(14) of the last closed day. A tiny range breaks on noise. With no daily ATR yet the day is skipped as no data.")float ordMaxRange = input.float(0.0, "Skip the day if the range is larger than N × daily ATR (0 = off)", minval = 0, maxval = 5, step = 0.05, group = ordG1, tooltip = "A huge range means much of the move already happened and the far-side stop is far away.") string ordG2 = "02 · Entry"
No coding needed.
opening-range-desk-strategy.pine
The same rules as a strategy, with fees and slippage, for TradingView's Strategy Tester on a second chart.
The full Pine v6 source is in Pine Pro Library: read it, change it, keep it.
The indicator draws; the Strategy Lab runs the same rules in the Strategy Tester.
Any market open from 09:30 to 09:45 New York; the window is a setting.
Alerts on the range, the entry, TP1 and the exit, in the desk's own words.
The page, the films and the manual are open to everyone. The code, the indicator and its Strategy Lab, is in Pine Pro Library: $49 once for every desk and every update, or included in the Complete Suite. Sign in to copy or download.
No measured edge. We compared twenty-six variations with costs, and none of them paid on the two index ETFs that summer; the lab notes have the context.
It enters at the second close, sets the stop past the range's far edge, TP1 at 1R and TP2 at 2R, and takes no other trade that day.
The same range and entry, with a setup grade from three checks, key levels with the room to the next one, half off at TP1, ORB Radar Pro on eight markets and the whole plan in every alert. The library desk stays complete.
We, ProEA Lab, build Opening Range Desk. The films run its rules, simplified, on simulated candles, not market data; R is before costs. Not financial advice.
Opening Range Desk Pro · $49 once
Get itEvery rule, setting and check, one topic at a time.
Opening Range Desk · Pine Pro Library · Pine v6
Box the opening high and low. Preview targets while price waits inside, then check the breakout closes.
v2.0.0 · TradingView indicator + Strategy Lab · the full source in Pine Pro Library
The desk now says where the day stands in one line, what it is waiting for in words (with the real levels), each check with ✓ or ✗, the plan in points and R, and today’s timeline. The opening range, the two-close breakout, the retest and every filter work as in 1.3. Four corrections:
The Strategy Lab now protects each trade from the candle after entry and sizes it by risk.
Opening Range Desk is a TradingView indicator in Pine Pro Library for opening range breakouts. It previews targets while price is inside the range, displays OR size in points and percent, and checks confirmed breakout closes or retests. A separate strategy script lets you test the configured rules with TradingView's Strategy Tester.
Check that your chart includes the selected opening window and timezone. Five-minute candles fit the default fifteen-minute window; larger candles cannot reconstruct that smaller range. Allow the opening window to finish before expecting a locked box. Read chart setup and installation
A wick alone does not meet the default rule. Opening Range Desk requires two consecutive candle closes strictly beyond the range edge and buffer. A close on or inside that boundary resets the count. Read the breakout checks
The retest option first arms after the required breakout closes. A later candle must revisit the edge within the configured tolerance and close beyond the raw edge. The arming candle cannot also complete that retest. Read the retest entry rules
Can price move beyond the opening high or low? First, build those two edges.
The first five-minute candle traded between 101 and 104. These prices start our box.
Fictional five-minute candles · New York close times. Candles start at 09:30, 09:35, 09:40 and 09:45.
The idea: follow a move beyond the box. Test its entry, stop and targets. Price can reverse after entry; profit depends on what follows, trade size and costs.
A reader asked for an “ORB strategy.” ORB means opening-range breakout. There are many versions, so we made the window, entry and exit rules editable, with a checklist that explains what is still missing.
Play or step through. The default needs two consecutive closes beyond an edge.
The first five-minute candle traded between 101 and 104. These prices start our box.
Fictional candles · ATR fixed at 8. Default entries; other checks held satisfied, optional filters and exits off. Shorts mirror the rule below the box.
The final price when that candle’s time ends. Its thin wick shows the highest and lowest prices visited. A visit beyond the box alone does not meet the default entry rule.
Box first. Candle closes second. Read the checklist when something is missing.
Top = opening high. Bottom = opening low. Locked edges stay fixed.
Entry marks a completed rule. The stop and target zones are the plan, with no promised outcome.
Under the state, one sentence names what the tool is waiting for, with the real levels: one more close above 772.60, a retest of the edge, or the next session.
Move price inside the box. Auto previews the long side above the midpoint and the short side below it.
OR 0.50% · in band. The 0.15–1.00% band is a personal reference; this label does not skip trades.
Dashed lines are current comparisons. They can move as the range forms; the confirmed entry can produce different targets.
Opening price 20,000; the box expands equally above and below it. OR % = range width ÷ opening price × 100. ATR is fixed at 20, with zero breakout buffer and an opposite-edge stop plus 0.1 ATR (2 points). TP1 uses 1R; TP2 uses 2R.
Long reference entry 20,050 · stop 19,948 · 1R = 102 points. On TradingView, your stop and target settings determine the preview. Left extensions compare today’s projection with earlier chart levels; they are not historical predictions.
This extra simulator uses fictional candles and the same entry logic. Change one control at a time; an earlier entry keeps its original plan.
The range is fixed. Move the final candle to recalculate the checklist.
Retest needs an earlier armed breakout. Try two earlier closes, then move this candle's wick toward the edge. A close exactly on the edge waits. The plan uses the opposite edge plus its stop buffer; the first target moves the stop to entry.
Illustrative inputs · changing a slider recalculates this example · no market feed
Research progress · public updates
Updated
Request received. We’re defining a bar-count exit for trades that have not reached their target.
Settle the target rule, then implement, verify in TradingView and compare with costs on an untouched period.
Proposed clock: entry bar = 0; count later closed bars. We’re reviewing whether reaching TP1 or the final target should stop the timer. Current v1.3 offers an HH:MM exit before TP1; it does not count bars since entry.
Source review complete. The bar-count exit needs its own rules and implementation; no results are available for it yet.
Preview targets and opening-range size are available in the free scripts. Preview validation checks behavior; it does not establish a trading advantage.
Try the released preview26 historical variation cells across SPY / QQQ 5m and gold 15m, June–September 2026. These earlier rules did not include the requested bar-count exit.
Read the historical evidenceNo new bar-exit measurements yet. Implementation checks and historical results cannot establish the best system for future markets.
Use an intraday chart, such as five minutes. Both complete Pine v6 files are in Pine Pro Library.
On your chart, create a new indicator.
Copy below and replace the sample code.
Save it. Start with the default settings.
Draws the range and its size, preview targets, the desk, the plan and alerts.
Copy the code as it is. No coding needed.
Measure with fees and slippage on a second chart. It protects each trade from the candle after entry and sizes it by risk.
Copy the code as it is. No coding needed.
Download the full package (ZIP) Both scripts, the docs, the settings reference, the tests and the licence
Check that your chart includes the opening window in the selected timezone. Use candles that fit the window: five-minute candles fit the default fifteen-minute opening range. Larger candles cannot reconstruct the smaller window exactly.
If the desk says UNAVAILABLE, your candles cannot rebuild the window. Use candles that divide it (1, 3, 5 or 15 minutes for 09:30–09:45) and standard candles, not Heikin Ashi or Renko.
Open the chapter you need. All settings are here.
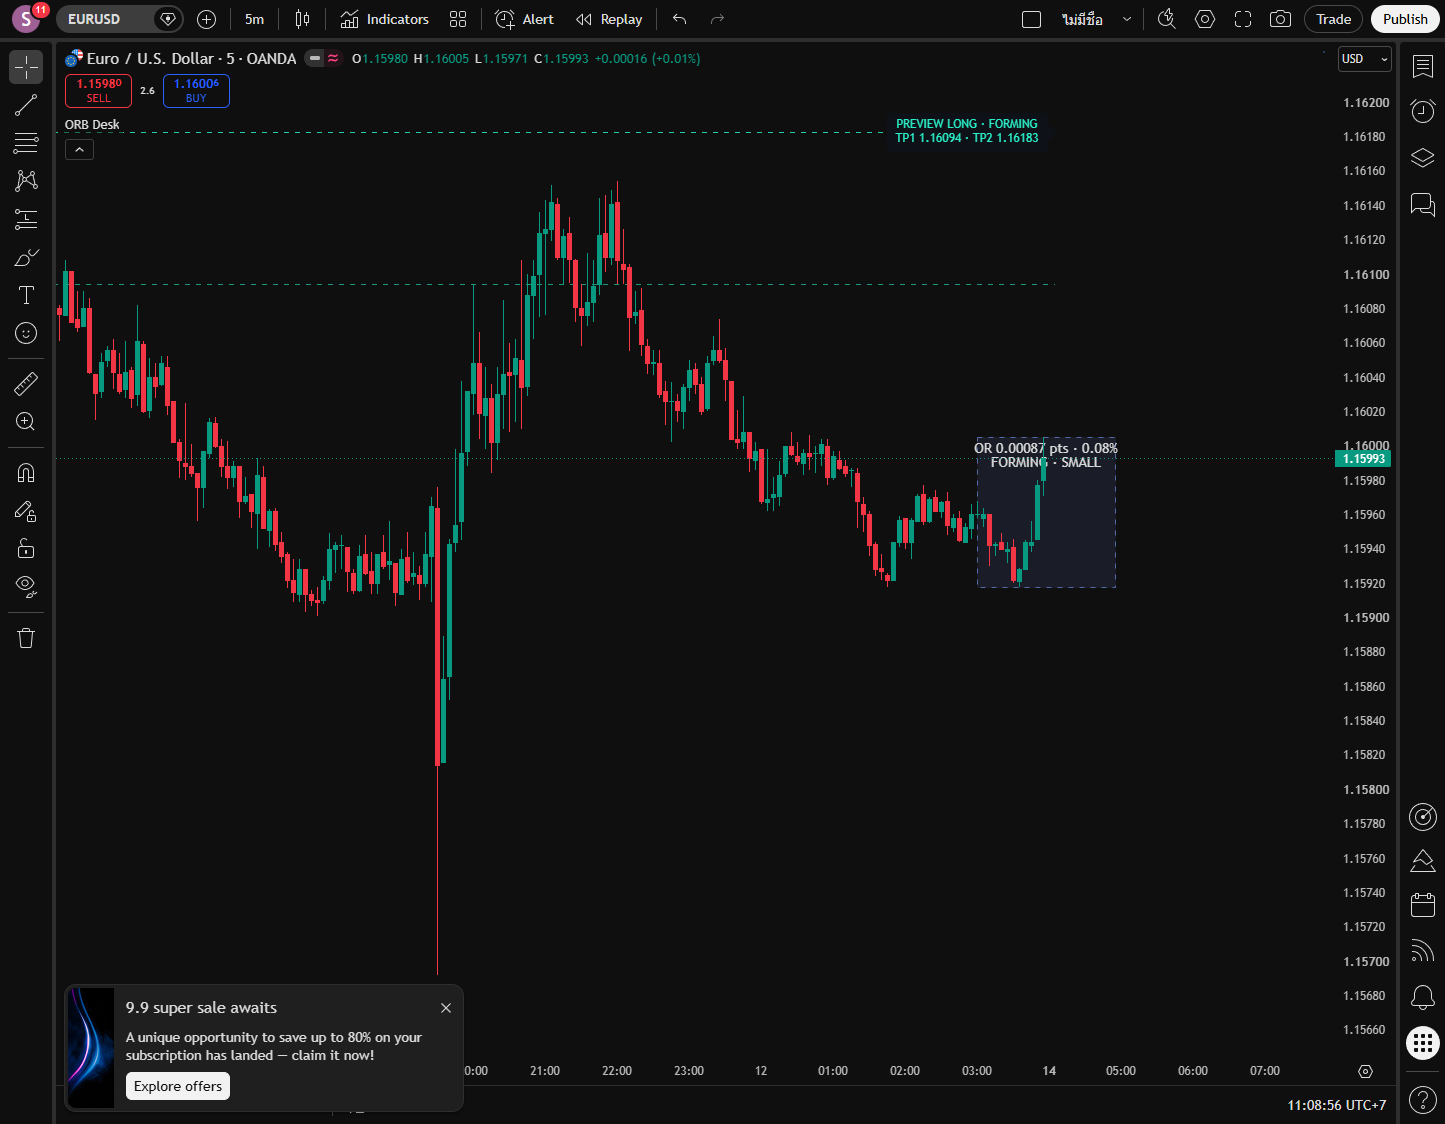
Before the break: Auto previews Long above the midpoint and Short below it, while price is inside the box. Exactly at the midpoint, neither side shows. Choose Long, Short, Both or Off in settings. Dashed lines extend left by default to compare with earlier highs, lows or your Volume Profile.
The assumed entry is OR high + breakout buffer for Long, or OR low − buffer for Short. Targets use your stop placement and R or range-height settings. They can move as the range and ATR change; the eventual entry can differ. The preview creates no signal or alert.
Previews end when price leaves the box, a retest arms, a trade occurs, the day is skipped or the entry window ends. They do not return after today’s first trade. A confirmed entry keeps its own frozen plan.
Inside the box: points = high − low. OR percent = points ÷ the first OR bar’s open × 100. FORMING changes with the range; SET uses the completed range. The default band includes 0.15% through 1%; SMALL and LARGE describe values outside it. These editable bands are information only and do not skip a day. Existing ATR-based entry filters remain separate.
The range must be locked, the trade window open, the range-size and side filters passed, and the daily allowance available with no trade open. An optional latest-entry cutoff can stop new entries sooner.
Default windows use America/New_York: opening range 09:30–09:45; entries 09:45–15:55. Decisions commit on closed candles. On a five-minute chart, the 09:45 candle locks the range at its 09:50 close and can count toward entry.
With flat-at-end on, an open trade closes at the close of the window’s last candle: the candle that reaches 15:55. On five-minute candles that is the 15:50 candle; on fifteen-minute candles, the 15:45 candle, so nothing is held overnight. No new trade opens on that candle.
Close through: the required consecutive closes must finish strictly beyond the edge plus any breakout buffer. A close on or inside that boundary resets the count.
Retest: those closes first arm the setup. A later candle must visit the allowed area near the edge and close beyond the raw edge. The arming candle cannot enter.
Example: upper edge 106, ATR 8, default tolerance 0.25. A later low at or below 108 records a touch. A close above 106 enters; exactly 106 waits. A close below 104 cancels; exactly 104 survives. A recorded touch can carry forward.
The default deadline is twelve later candles; the thirteenth expires first. Filters and strong-close checks qualify the arming candle; they are not checked again at retest entry. Window, allowance and flat-position gates still apply.
A wick beyond an edge that closes back inside can receive a fake-out mark. Two consecutive closes are required by default, but they cannot prevent every reversal.
The optional failed-breakout exit closes a long when a later close falls below the raw upper edge; it can pass through the whole box. The short rule mirrors this. The optional failure fade trades the opposite way and uses the daily allowance.
Stop: the plan’s loss-exit level. By default it sits beyond the opposite edge by 0.1 ATR. ATR measures recent price movement, including gaps.
1R: the price distance from entry to initial stop. The first target is that distance in the trade’s favor; the final target is twice it. Reaching TP1 moves the stop to entry by default. It does not take partial profit.
The indicator checks the existing stop before targets on each later candle. If both are touched, its paper record counts the stop first. A newly moved stop is not applied retroactively to that candle’s earlier wick. A candle that opens beyond the stop exits at its open.
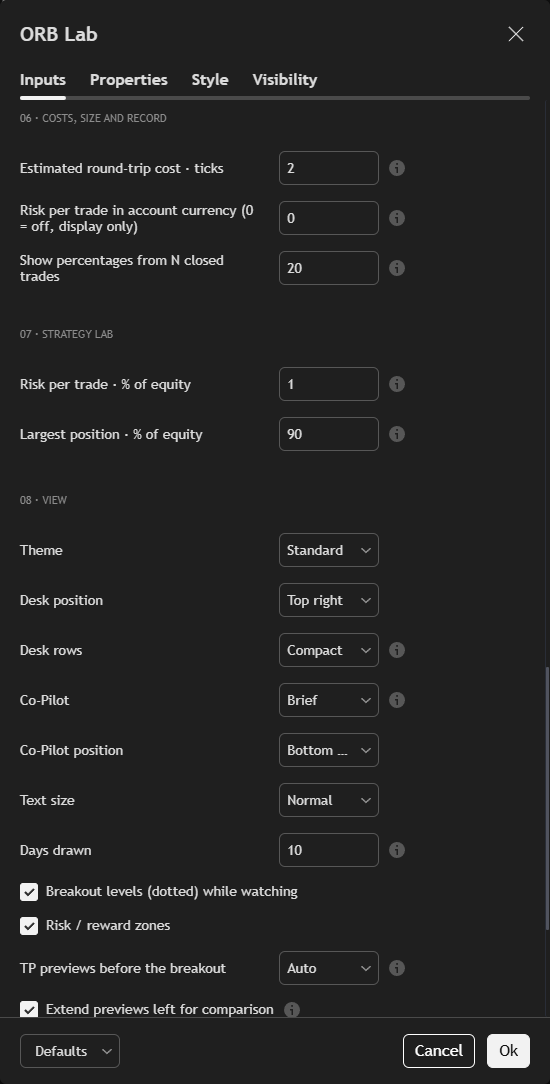
Size display: Divides the risk input by the entry-to-stop distance times the symbol’s point value, and rounds down to its contract step. It does not convert currencies. The Strategy Lab sizes its own orders: the smaller of a risk percentage and a largest-position cap.
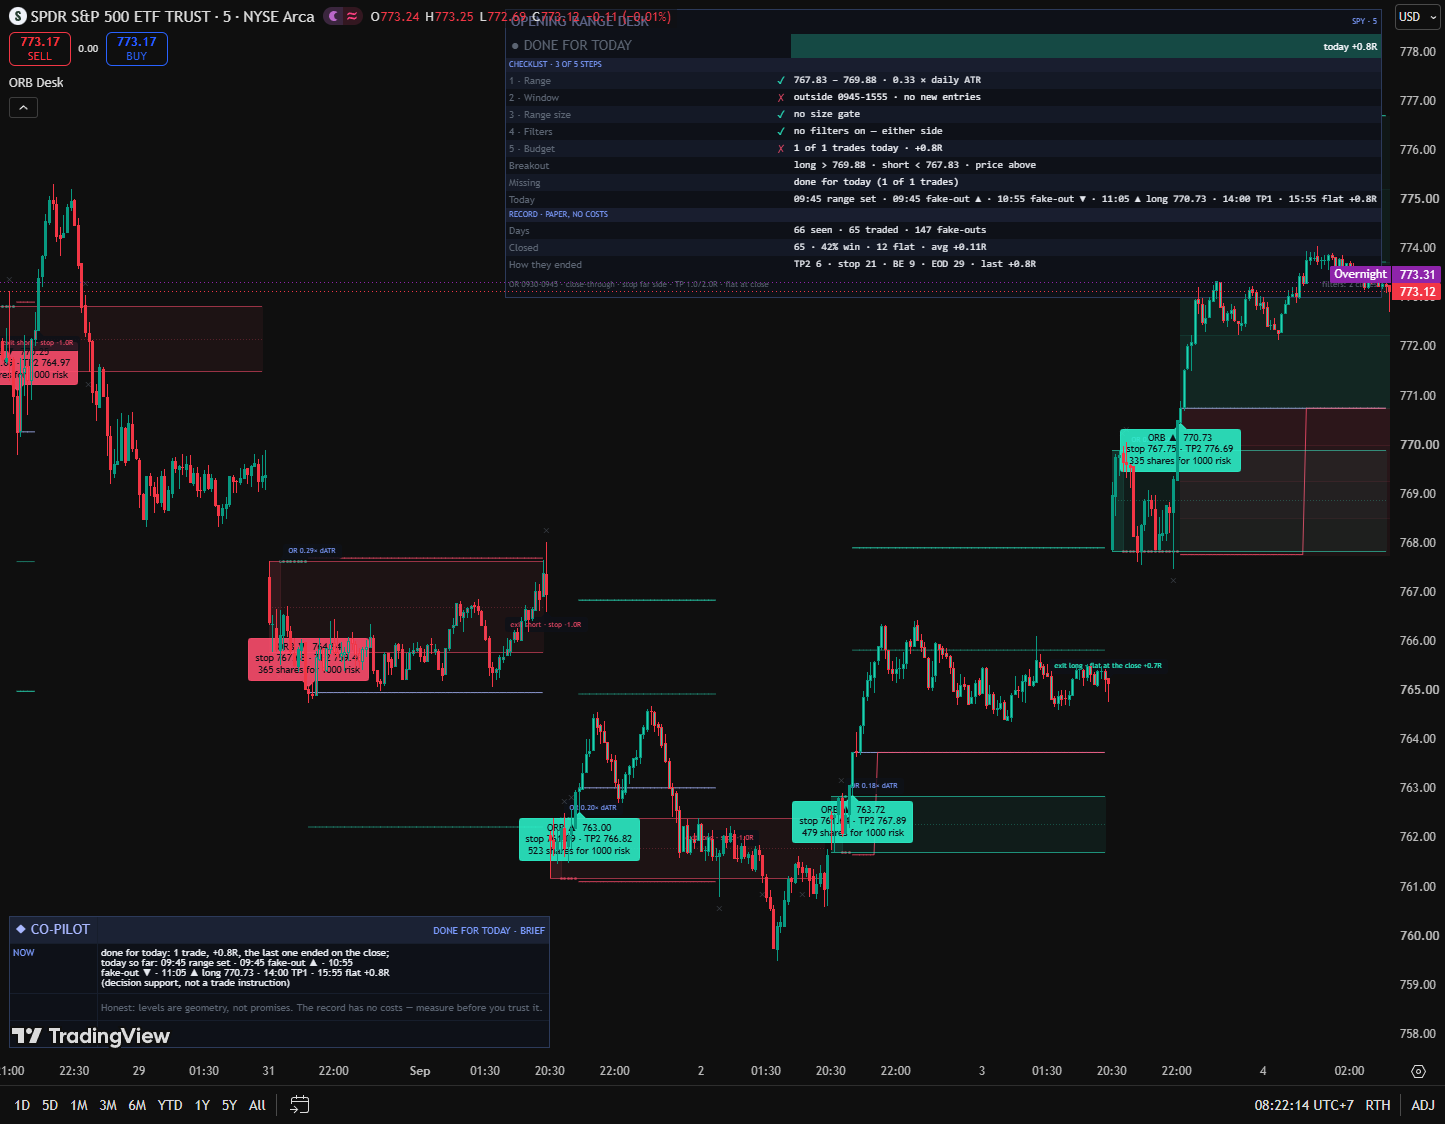
State names the stage; the line under it says what the tool waits for. The ribbon shows four steps: range, checks, break, result. Checks lists the trade window with its time left, today’s allowance and each filter that is on: ✓ met, ✗ not met, — no data. Plan shows the levels a breakout would take, or the open trade’s entry, stop and targets.
Today is the session timeline. This chart counts days and how trades ended, after an estimated cost you set. Co-Pilot’s default Standard mode gives NOW, WHY, PLAN and LIMITS; Brief gives NOW and PLAN.
Defaults below refer to the indicator. Change one setting at a time.
Choose which opening candles build the box and when entries are allowed. Your candles must divide the window, or the desk reads UNAVAILABLE. Size gates compare its height with the daily ATR; without one yet, the day is skipped as “no data”.
Close through enters when the count completes. Retest waits for a later return. Buffers and tolerance use chart ATR: a measure of recent price movement, including gaps.
Two-close confirmation is on. The other controls are optional: a close near its candle’s extreme, an early failure exit, or an entry against a failed breakout.
Stops can use the opposite side, the midpoint or an ATR distance. Targets can use risk multiples or range heights. The time stop exits only if TP1 has not been reached.
VWAP is the volume-weighted average price; EMA is a moving average emphasizing recent prices. Filters can require the close to be on their side, enough volume, or a matching opening gap.
The record on the chart subtracts the estimated cost you set. The size is a display only; read its limits in the stop-and-target chapter.
Use structured JSON for a webhook, or switch to readable text. See the alert chapter for which events are included.
Control the desk, the Co-Pilot and the drawings without changing the rules. Previews and the OR size are information only; they do not block entries.
The Strategy Lab shows the same desk and adds its risk and largest-position settings.
Twelve named conditions cover: range set, day skipped, long, short, breakout armed, fake-out, first target, final target, stop, time stop, failed breakout and flat at the end of the window. Choose Once Per Bar Close.
Any alert() function call sends RANGE_SET, ORB_LONG, ORB_SHORT, TP1 and EXIT. JSON includes the version, symbol, timeframe, event, side, plan prices, range edges, reason and time; a missing number is null.
These messages report the indicator’s events; they are not broker fill confirmations.
The Strategy Lab starts with capital 100,000, sizes each trade by 1 percent risk capped at the account’s equity, fees of 0.02 percent per order and five ticks of slippage. Set commission per contract for futures. Its order emulator can fill differently from the indicator’s stop-first paper record.
We compared twenty-six variations on three charts with costs. Results differed by market; a retest did not improve every chart. None of the variations paid on the two index ETFs in that summer sample.
It was one summer, small samples and in-sample testing. The numbers belong beside that context in the lab notes. They do not establish how your next trade will end.
Those measurements tested version 1.2. Version 2.0 keeps its rules but corrects four cases, so they describe 1.2, not 2.0. Our plan for measuring 2.0 on data nobody has looked at is written down before any result.
The lab notes are in review and will be linked here.
The tool reads chart candles in your chosen timezone. Feed, session, timeframe or input changes can recalculate history. Use an intraday chart that fits the opening window.
Trade decisions use confirmed candles; forming boxes and previews can move on live updates. A higher-timeframe EMA uses its last closed candle. VWAP follows the chart’s session, which can differ from your opening-range window.
The indicator draws a rule-based plan, not a prediction. Its record subtracts an estimated cost you set; your real costs can differ. Measure your own chart and actual execution. This is research tooling, not financial advice.
What shipped and what changed in Opening Range Desk, newest first. Ask for the next change below; what gets built lands here with a date, and on the lab queue on the front page.
A clearer desk on the same rules v2.0.0 Updated Opening Range Desk
A clearer desk on the same rules, four corrections, and a Strategy Lab that sizes each trade by risk.
Opening Range Desk 2.0.0 is out Lab note Opening Range Desk
Opening Range Desk 2.0.0 is out: the same rules with four fixes, a new desk and a new Strategy Lab. The downloads are 2.0.0.
Bar-count exit request reviewed Lab note Opening Range Desk
Request received; reviewing bar-count and target rules. Current downloads remain v1.3.0. Follow the research progress.
Preview targets before the breakout v1.3.0 Updated Opening Range Desk
Reader feedback added target previews while price waits inside the range, plus OR size inside the box.
Opening Range Desk v1.2.0 Shipped
Checks moves outside the session's first range.
Two words: ORB strategy Request Opening Range Desk
The ask it was built from: two words. We asked which range, entry and filters; no answer came, so every variation became a switch.
“Orb strategy”
Twenty-six variations, measured before shipping Lab note Opening Range Desk
Run with costs on across three charts. The index ETFs did not pay this summer; gold's open did with filters. Second close = default.
A small friction or a big idea. Tell us what would make this tool work better for you.
Requests for a new tool go on the same queue: see what is asked for and what is being built.