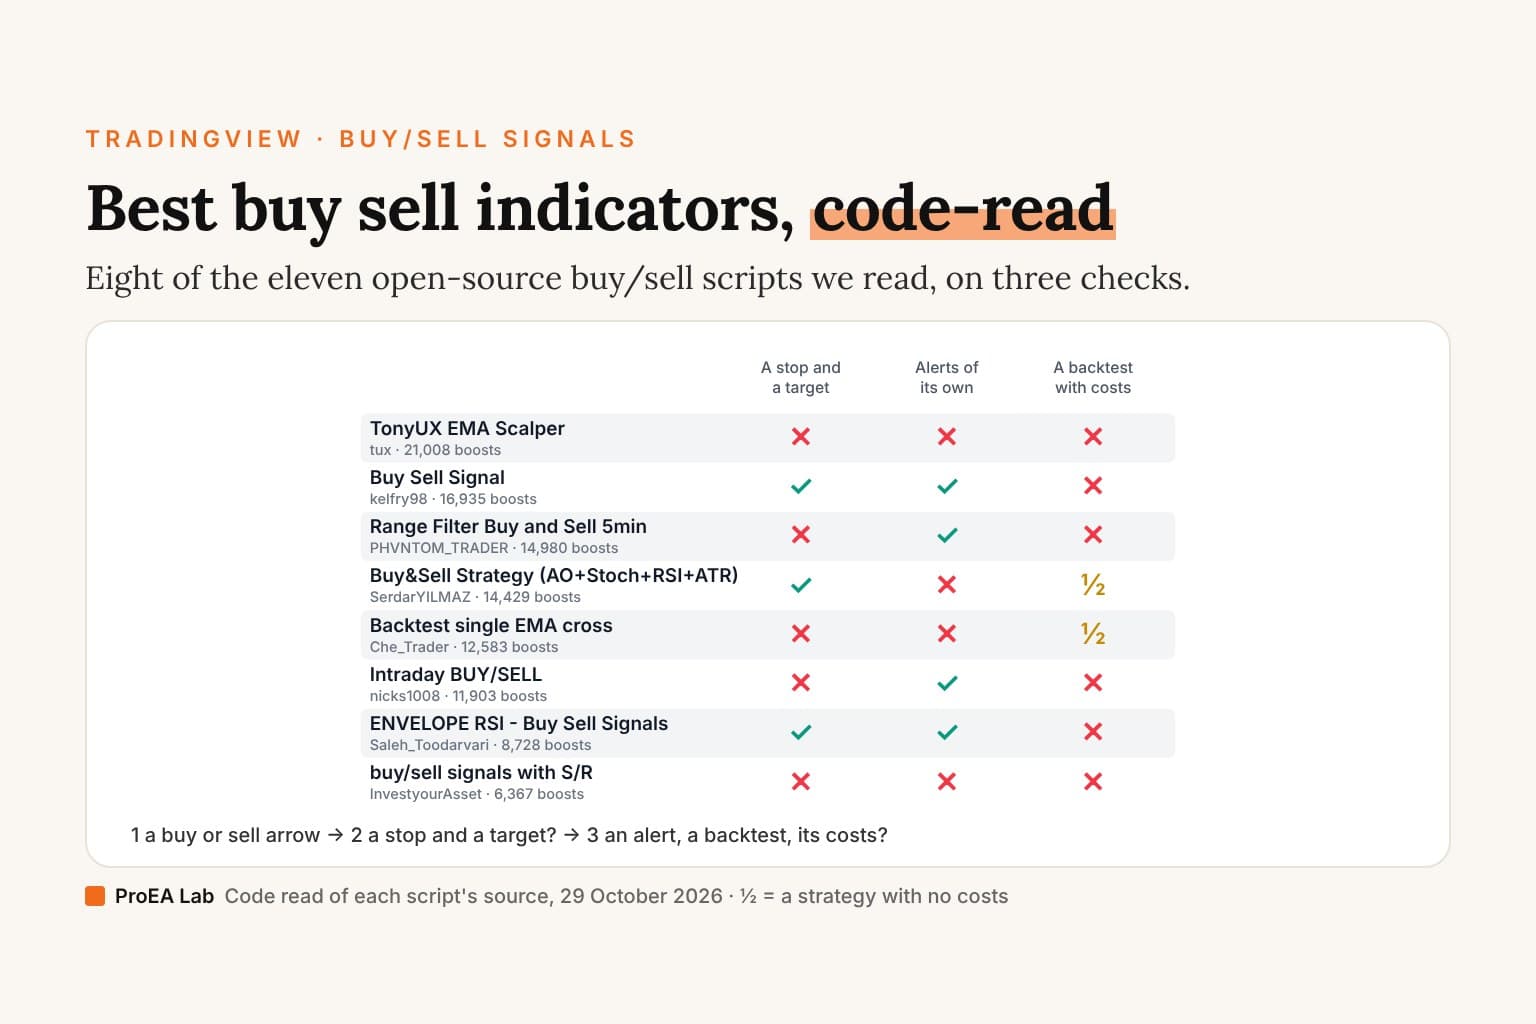
Short answer: of the open-source scripts, the one that comes closest to a complete buy/sell plan is kelfry98's Buy Sell Signal (16,935 boosts): a 5 and 13 EMA cross, a stop half an ATR beyond the signal candle, a final target at 3R with 1R and 2R marked, and an alert for each. The most-boosted, tux's TonyUX EMA Scalper (21,008 boosts), is a close across a 20-candle EMA: no stop, no target, no alert. None of the 11 we read looks at a future candle. What separates them is whether they give you a plan at all, and every indicator among them decides on the live candle.
Most lists name buy/sell indicators.
This one reads them.
What we checked
We searched TradingView's scripts for 21 terms on 29 October 2026, among them "buy sell signal", "buy sell" and "buy and sell signals", which returned 504 scripts. 126 have both buy and sell in their name, and 86 of those are open source. We took the 11 most-boosted of the 86, down to 6,367 boosts, with none skipped, and read every line that decides a signal, a stop, a target or an alert. Four questions:
- Repainting: does it read another timeframe or a future candle, draw a swing before it was known, or decide on the live candle?
- The plan: does a signal come with a stop and a target?
- Strategies: does it have one, and with what costs?
- Alerts: what can it send you?
Three of the most-boosted buy/sell scripts are protected, so we can't read them: snurk's AYN (13,355 boosts), mmsrect's Buy and Sell Signals using EMA, Stochastic and Pivots (10,258) and lukascg94's Smart Forex Buy Sell Signal (9,939). Autocomplete also suggests "buy sell signal yashgode9"; that script's page returned a 404 on 29 October 2026 and TradingView's search found nothing under the name, so we couldn't read it either.
The table
Boosts as TradingView's search showed them on 29 October 2026. "R" is the distance from entry to stop.
| Script | Boosts | The signal, by default | Stop and target | Decides on | Alerts |
|---|---|---|---|---|---|
| TonyUX EMA Scalper - Buy / Sell (tux) | 21,008 | A close across the 20-candle EMA | None | The live candle | None |
| Buy Sell Signal (kelfry98) | 16,935 | EMA(5) crossing EMA(13), on a green candle for a buy and a red one for a sell | A stop half an ATR beyond the signal candle; a final target at 3R, with 1R and 2R marked | The live candle | Buy, Sell, Final Take Profit, Stop Loss, Entry Invalidated |
| Range Filter Buy and Sell 5min - guikroth version (PHVNTOM_TRADER) | 14,980 | The first close above a rising range filter after a Sell, and the reverse | No stop; its "targets" are bands that move every candle | The live candle | Buy, Sell, either |
| Buy&Sell Strategy depends on AO+Stoch+RSI+ATR by SerdarYILMAZ | 14,429 | Stochastic under 20, RSI(10) under 30 and the Awesome Oscillator rising; shorts mirror it | A stop 1 ATR beyond the signal candle, a target 1 ATR from its close | Each close (a strategy) | None of its own |
| BUY and SELL - Backtest single EMA cross By che_trader | 12,583 | EMA(10) crossing EMA(20), always long or short | None | Each close (a strategy) | None of its own |
| Intraday BUY/SELL (nicks1008) | 11,903 | A candle closing across the 70-candle SMA, then a candle that extends it | None | The live candle | Buy, Sell, either, and three for its RSI marks |
| ENVELOPE RSI - Buy Sell Signals (Saleh_Toodarvari) | 8,728 | A close back inside a 0.22% envelope, with RSI(8) under 25 for a buy or over 80 for a sell | A target and a stop 0.15% from the signal candle's average price, not tracked | The live candle | Buy, Sell |
| BUY & SELL VOLUME TO PRICE PRESSURE by @XeL_Arjona | 7,891 | None: an oscillator of buying against selling volume | None | — | None |
| Market Cipher B Free version with Buy and sell (falconCoin) | 7,391 | None: a dot at each cross of two oscillator lines | None | The live candle | None |
| Delta Zones Buy/Sell Pressure (NathanTradeus) | 6,674 | A candle with one wick far longer than the other: a triangle and a box | None | The live candle | Buy and sell pressure, two higher-timeframe zones |
| buy/sell signals with Support/Resistance (InvestYourAsset) | 6,367 | SMA(12) crossing SMA(26) | None | The live candle | None |
| AYN: Buy-, Sell-, Trend- and SwingSignals incl. AutoFibo (snurk) | 13,355 | Protected: we can't read it | — | — | — |
| Buy and Sell Signals using EMA, Stochastic and Pivots (mmsrect) | 10,258 | Protected: we can't read it | — | — | — |
| Smart Forex Buy Sell Signal by Lukas (lukascg94) | 9,939 | Protected: we can't read it | — | — | — |
Two of the 11 are strategies, and their costs are whatever their strategy( line sets:
| Strategy | Trades | Size, by default | Commission | Slippage | Stop and target |
|---|---|---|---|---|---|
| SerdarYILMAZ | Long and short | Not set | None | None | 1 ATR each side |
| Che_Trader | Always long or short, from 1 January 2019 | Not set; its 100,000 "Buy quantity" input is never used | None | None | None |
Neither charges a commission or slippage. Three of the 11 give a stop and a target with each signal, and five send an alert of their own.
What the code says
tux's TonyUX EMA Scalper is a close across a 20-candle EMA. It is Pine v1 (it has no version line). "Buy" prints when the close crosses above the 20-candle EMA of the close, and "Sell" when it crosses below. It also draws the highest and the lowest close of the last 8 candles, which no signal uses. No stop, no target, no alerts and no licence line. The arrows are decided on the live candle, so one can print and vanish before the close.
kelfry98's Buy Sell Signal draws a stop and three targets. A buy needs the 5-candle EMA to cross above the 13-candle EMA on a green candle ("Require candle confirmation", on by default); a sell mirrors it on a red one. Each signal sets a plan: entry at the signal candle's close, a stop half an ATR(14) below its low ("SL Multiplier (ATR)", 0.5), and a final target three times that risk away ("Risk:Reward (R:R)", 3.0), with TP1 and TP2 labelled when price reaches 1R and 2R. On each later candle it checks the final target before the stop, so a candle that reaches both is scored as a target. An opposite signal closes the trade with an "INV BUY" or "INV SELL" mark and opens the other way. Five alerts: BUY Signal, SELL Signal, Final Take Profit, Stop Loss and Entry Invalidated. Signals are decided on the live candle. It is an indicator, not a strategy, so nothing here is tested or charged costs. Pine v6, no licence line.
The Range Filter's "targets" move, and it has no stop. Its comments credit DonovanWall's original script and guikroth's adaptation, and say tvenn republished it. The filter is a line that moves only when the close gets further from it than a smoothed range: the 100-candle EMA of the close's candle-to-candle change, smoothed again over 199 candles and multiplied by 3. A comment says those defaults are "Settings for 5min chart, BTCUSDC". "Buy" is the first close above the filter, while the filter's last move was up, after a Sell; "Sell" mirrors it. "High Target" and "Low Target" are the filter plus and minus the range, redrawn every candle, so they aren't a fixed target, and nothing marks a stop. Three alerts: buy, sell, and either. At the bottom sits a strategy block, commented out, with a 400-tick take-profit and a 100-tick stop (its inputs call them pips) and no costs. Signals are decided on the live candle. Pine v5, no licence line.
SerdarYILMAZ's strategy sets a stop and a target one ATR away, and its author says not to trade it. Its comments: "This strategy is just for training, its purpose is just learning code in pine script." and "Don't make buy or sell decision with this strategy." A long needs the stochastic's %K (14, smoothed over 3) under 20, RSI(10) under 30 and the Awesome Oscillator (5 and 34 on the candle's midpoint) rising; a short mirrors it, over 80 and 70 with the oscillator falling. Each signal gets a stop one ATR(14) below the signal candle's low and a target one ATR above its close, so the stop sits further away than the target by the candle's close-to-low distance. It enters at the next candle's open. Its strategy( line sets no size, no commission and no slippage. No alerts of its own. Pine v4, no licence line.
Che_Trader's strategy is an EMA(10) and EMA(20) cross, always in the market. Its code calls it "Backtest single EMA cross". It buys when EMA(10) crosses above EMA(20) and sells short on the cross down, each order reversing the last, from 1 January 2019. There is no stop and no target: the opposite cross is the exit. Its "Buy quantity" input, 100,000, is never passed to an order, and its strategy( line sets no size and no costs, so the tester trades its default size and charges nothing unless you enter costs in its properties. No alerts of its own. Pine v4, no licence line.
nicks1008's Intraday BUY/SELL waits for a second candle. Its code calls it "CRUDE OIL BUY/SELL", short title "CRUDE Scalp |3 Min". "B" prints when the previous candle was green and closed above the 70-candle simple average after the one before it closed at or below, and the live candle is green with a higher high. "S" mirrors it: a red candle whose low crossed under the average, then a red candle with a lower low. Yellow "!" marks print when RSI(14) crosses back under 80, or back over 20 on a green candle. Six alerts: buy, sell, either, and three for the "!" marks. No stop and no target. Decided on the live candle. Pine v5, MPL 2.0.
Saleh_Toodarvari's ENVELOPE RSI sets a 0.15% target and stop. The envelope is the 8-candle simple average of each candle's midpoint, 0.22% above and below. "Buy" prints when the close crosses back above the lower band while RSI(8), also on the midpoint, is under 25; "Sell" when it crosses back under the upper band with RSI over 80. Its "TP %" and "SL %" inputs, 0.15% each, set a target and a stop either side of the signal candle's average price (its open, high, low and close averaged): one to one. It doesn't track whether either is hit, and has no alert for them. Two alerts: buy and sell. Decided on the live candle. Pine v5, MPL 2.0.
xel_arjona's BUY & SELL VOLUME TO PRICE PRESSURE has no buy or sell signal. It is Pine v1 from 2015 ("Ver. 1.15.b2.27.07.2015"), in its own pane. It splits each candle's volume into buying and selling pressure, crediting Vadim Gimelfarb's "Bull And Bear Balance Indicator" in Stocks & Commodities, and by default plots the gap between their averages as two oscillator lines and a histogram. No arrows, no stop, no target and no alerts. The buy and sell in its name are volume, not entries.
falconCoin's Market Cipher B Free version prints dots, not buy and sell labels. It is Pine v1, in its own pane, and its header names LazyBear as the author. It plots an oscillator of the typical price's distance from its 10-candle EMA, scaled by the average distance and smoothed over 21 candles, a 4-candle average of that line, levels at 53 and 60 above and below zero, and a dot at each cross of the two lines: green when the first crosses above, red when it crosses below. No stop, no target and no alerts. Decided on the live candle.
NathanTradeus's Delta Zones marks wicks, not entries. For each candle it takes the lower wick minus the upper wick. A "Buy Pressure" triangle marks a candle where that difference is at least 3.5 times its standard deviation over 20 candles, with a box from the candle's low halfway up to its body; "Sell Pressure" mirrors it on the upper wick. Four alerts: buy pressure, sell pressure, and two for higher-timeframe zones, which are off by default. Those zones read the higher timeframe with no offset, so on a live chart they follow its forming candle. Optional ZigZag lines, off by default, come with a "Repaint Lines" setting, on by default, that redraws the live leg. No stop, no target, no strategy. Pine v6, no licence line.
InvestYourAsset's support and resistance arrive 20 candles late. Its triangles are a cross of the 12- and 26-candle simple averages of the close; a date filter in its code lets every candle through. Its support and resistance are swing highs and lows with 20 candles on each side, so each one appears 20 candles after the swing, drawn where it was confirmed, not back on the swing: late, but it doesn't move. It also plots the daily close of a ticker you type ("NA" by default) and the gap between the two averages as a histogram on the price chart. No stop, no target and no alerts. Decided on the live candle. Pine v5, no licence line.
Buy sell indicator, no repaint
None of the 11 reads a future candle. None uses lookahead_on or a negative offset, and the only two request.security calls, InvestYourAsset's daily close and Delta Zones' higher-timeframe zones, leave lookahead off. Once a candle has closed, the marks on it stay. What still moves:
- The live candle. The eight indicators that print marks decide every mark as the candle forms (the ninth, XeL_Arjona's, is an oscillator with no marks), and none checks
barstate.isconfirmedfirst, so a buy or a sell can print and vanish before the close. When you create an alert on one of them, set it to fire once per bar close. - Another timeframe, read with no offset. On a live chart, InvestYourAsset's daily line and Delta Zones' higher-timeframe zones follow the forming higher-timeframe candle; on history they show only closed ones.
- Swings. InvestYourAsset's swing points are confirmed 20 candles later and drawn then, not back on the swing, so they are late but don't move. Delta Zones' optional ZigZag redraws its last leg until it's confirmed.
- Strategies. SerdarYILMAZ's and Che_Trader's decide at each close and fill at the next candle's open, so their tests don't depend on the live candle.
More on telling them apart in how to tell if an indicator repaints.
Buy sell indicator with target and stop loss
Three of the 11 give both:
- kelfry98's Buy Sell Signal: a stop half an ATR beyond the signal candle, a final target at 3R, and TP1 and TP2 marked at 1R and 2R, with an alert when the stop or the final target is hit. One quirk to know: when a single candle reaches both, it records the target, because it checks the target first. A chart can only show you the candle, not which price came first inside it.
- SerdarYILMAZ's strategy: a stop one ATR below the signal candle's low and a target one ATR above its close, tested in the Strategy Tester with no costs.
- Saleh_Toodarvari's ENVELOPE RSI: a target and a stop 0.15% either side of the signal candle's average price, drawn and not tracked.
The Range Filter's "High Target" and "Low Target" are bands that move every candle, and there's no stop. The other seven give no plan at all.
A stop and a target are only half a plan; the size is the other half. What a 3R target with a 1R stop is worth depends on how often each is hit, after costs, and none of these scripts measures that for you. The risk reward calculator works out the numbers for one trade before you take it.
Entry exit indicator TradingView
An entry exit indicator marks the entry and tells you both ways out: the stop, if the trade is wrong, and the target or the trail, if it's right. An arrow alone is an entry indicator. Of the 11 we read:
- kelfry98's Buy Sell Signal is the one full entry exit indicator: it sets the stop and the final target when the signal prints, marks TP1 and TP2 on the way, ends the trade with "INV BUY" or "INV SELL" when an opposite signal comes first, and alerts on each exit: Final Take Profit, Stop Loss and Entry Invalidated.
- SerdarYILMAZ's strategy places both exits as orders with its entry, one ATR away. It has no alerts of its own, but a strategy's fills can alert (see how to get buy sell signals on TradingView, below).
- Saleh_Toodarvari's ENVELOPE RSI draws an entry, a stop and a target, then forgets them: nothing tells you which was hit.
- The Range Filter alternates Buy and Sell. Nothing marks an exit before the opposite signal, and its "targets" move every candle.
Before you trust one, check four things in its code or on a live chart:
- The stop is set with the entry, from prices known at that candle, not drawn later where it would have worked.
- Which exit it scores first when one candle reaches both. kelfry98's checks the target first, so a candle that touched both is scored as a target.
- When the exits decide. An exit decided on the live candle can fire and vanish like an entry can; an alert set to once per bar close can't.
- Whether the exit moves, and on what: a trail on closed candles, or on every tick.
Is there an accurate buy sell signal indicator on TradingView?
No code read can tell you how often a signal will be right, and none of the 11 states an accuracy figure in its code. TradingView's own script publishing rules set the bar for any author who does: "Do not make unrealistic or unsubstantiated claims about your script's performance, whether on TradingView or elsewhere. If you make any claims about trading performance, signal accuracy, statistical reliability, etc., substantiate those claims clearly in your description. If you cannot substantiate a claim, it does not belong in your publication."
So no honest indicator can claim to be "100% accurate". For a strategy's results, the same rules ask for "more than 100 trades" in most cases, and say "A margin of 0 is unrealistic in any circumstance, because it represents infinite leverage."
Do buy and sell indicators work?
A code read can't answer that, and neither can boosts: they measure popularity, not results. Neither strategy among the 11 charges a commission or slippage, so their Strategy Tester reports leave out what every trade costs.
We asked the question of our own tool. We tested Signal Desk's graded signals on one NSE:NIFTY 5-minute chart, with costs on, and wrote up everything it measured, including the gates that made it worse: we graded the signals, then tested the grade. One symbol, one window: it tells you about that test, not about the next trade.
Which is the best free buy sell indicator?
It depends on the job:
- A signal with a plan: kelfry98's Buy Sell Signal. Of the 11, it is the only one that sets a stop and a target with every signal and alerts on the signal, the stop and the target. Before you rely on it, know that it decides on the live candle (set its alerts to once per bar close), scores the target first when one candle reaches both, uses a 3R target and a half-ATR stop as defaults that no test in its code backs, and is an indicator, so nothing is tested or charged costs.
- A backtest: neither strategy is ready as it stands. SerdarYILMAZ's author says it is for learning, and Che_Trader's has no stop. Either way, enter your commission and slippage in the tester's properties first.
- Buy and sell pressure, not entries: xel_arjona's oscillator and NathanTradeus's Delta Zones both read pressure, from volume and from wicks; neither gives an entry with a stop.
The most-boosted, tux's, is a close across an EMA with nothing else; the Range Filter, third, has alerts and no stop.
How to get buy sell signals on TradingView
Picking the script is half of it; the other half is hearing from it when it fires. (New to the idea of a signal? What a buy sell signal is starts from the beginning.) Three ways, in TradingView's own words:
- Put the indicator on your chart. From a script's page, TradingView's help says: "Click the Use on chart button, and a new tab will open with your chart where the selected indicator or strategy will be automatically applied." And: "If the button is unavailable, the indicator or strategy is invite-only, meaning you need permission from the author."
- Set an alert on its condition. "Press ALT + A (Windows) or ⌥ + A (macOS)." or "Click the Create alert button on the upper toolbar." Under Condition, pick the indicator and the condition it offers, such as kelfry98's BUY Signal; TradingView's help calls this "a technical alert for an indicator, strategy or drawing tool on your chart." Under Trigger, TradingView offers "only once, every time, once per bar close, or once per minute". Choose once per bar close: the eight indicators in the table that mark a signal decide on the live candle, and that's the trigger that can't fire on a candle that later changes. One more line from the same help: "If you change an indicator’s parameters after creating an alert, the alert will still trigger using the original settings."
- Or alert on a strategy's orders. A strategy's
alertcondition()lines give you nothing: "While the presence of alertcondition() calls in a strategy script will not cause a compilation error, alerts cannot be created from them." Its simulated fills do: "Order fill events require no special code for script users to create alerts on them". So an alert on SerdarYILMAZ's or Che_Trader's strategy fires on its entries and exits.
Steps 2 and 3 need a paid plan. TradingView's pricing page, read on 29 October 2026, shows "Active technical alerts on indicators, strategies, and drawings" as ✗ on Basic and 20 on Essential, so Basic runs the indicator but can't alert you when it fires.
How to create a buy sell signal in TradingView
The smallest buy and sell signal we could write: two EMAs, a mark when they cross, and an alert for each side. We compiled it on TradingView's own compiler on 29 October 2026: no errors, no warnings. Paste it into the Pine Editor and add it to a chart.
//@version=6
// This Pine Script™ code is subject to the terms of the Mozilla Public License 2.0 at https://mozilla.org/MPL/2.0/
// © ProEA
//
// Buy/Sell Crossover Example: the smallest buy and sell signal, a crossover of two EMAs, marked with plotshape() and
// offered as two alerts with alertcondition(). It draws no stop, no target and no size, and nothing in it is tested:
// it's an example to learn from, not a strategy.
// Both signals wait for the candle to close, so a mark never prints on the live candle and then vanishes.
indicator("Buy/Sell Crossover Example", overlay = true)

fastLen = input.int(9, "Fast EMA", minval = 1)
slowLen = input.int(21, "Slow EMA", minval = 1)

fast = ta.ema(close, fastLen)
slow = ta.ema(close, slowLen)

// A cross counts only once the candle has closed.
buySignal  = ta.crossover(fast, slow) and barstate.isconfirmed
sellSignal = ta.crossunder(fast, slow) and barstate.isconfirmed

plot(fast, "Fast EMA", color.teal)
plot(slow, "Slow EMA", color.orange)
plotshape(buySignal, "Buy", shape.triangleup, location.belowbar, color.teal, text = "BUY")
plotshape(sellSignal, "Sell", shape.triangledown, location.abovebar, color.red, text = "SELL")

alertcondition(buySignal, "Buy", "BUY {{ticker}} {{interval}} at {{close}}")
alertcondition(sellSignal, "Sell", "SELL {{ticker}} {{interval}} at {{close}}")
What each part does:
- The rule.
ta.crossover(fast, slow)is true on the candle where the 9-candle EMA crosses above the 21-candle EMA;ta.crossunderis the reverse. and barstate.isconfirmedmakes the signal wait for the close. TradingView's manual describes the same method: it "requires the script to be executing on the bar's last iteration, when it closes and prices are confirmed. It is a simple way to avoid repainting".plotshape()draws the BUY and SELL marks under and over the candles.alertcondition()offers the alert. "Each call to alertcondition() in a script will create a corresponding alert selectable in the “Condition” dropdown menu of the “Create Alert” dialog box." It sets no frequency: "The frequency of alertcondition() alerts is determined by users in the “Create Alert” dialog box." The{{ticker}},{{interval}}and{{close}}in the message "will be replaced with dynamic values when the alert triggers".
What it leaves out is everything after the arrow: no stop, no target, no size, and no test. It's a signal, not a plan; the target and stop loss section above is the rest.
Ours
We build two, and neither is free.
Signal Desk is an entry checklist indicator in Pine Pro Library ($49 once, every library desk with its Pine source). It grades five checks, trend, momentum, structure, location and candle, on a pullback or breakout trigger, blocks entries that chase, allows 2 entries a day by default with a 6-candle cooldown, and draws a reference plan: a structure stop and targets at 1R, 2R and 3R. Its page: "TP1 moves the stop to entry; TP2 moves it to TP1 and starts an ATR trail; TP3 ends the plan." On repainting: "Entries commit on confirmed candles." and "Pivots need five later candles by default; higher-timeframe context uses its last closed candle." Its grades count checks: "Raising the minimum reduces qualifying setups; it does not establish better outcomes." It has eight named alert conditions, which its page says to set to Once Per Bar Close, and a strategy twin whose defaults include a "cash fee 20 per order and one tick of slippage". On an index chart it can label longs BUY CE and shorts BUY PE; its page says the mapping "does not read an option chain, premiums, Greeks or available expiries."
Signal Desk Premium, $49 once, keeps those entries and adds the work around them: a GET READY heads-up before the signal, a trade ticket that sizes from your risk ("Risk ÷ (stop distance × money per point), rounded down."), scale-outs ("Half at TP1 by default, then the stop moves to entry. The rest runs to TP3, trailing after TP2."), a daily lock ("By default the day locks at −2R net"), a Radar of 20 markets with one alert, a strategy twin with costs included, and a relay for its alerts to Telegram and Discord. Its page says: "Premium uses the same entries as the library desk. It does not promise better results; it makes the same signals easier to prepare for, size, manage, filter and act on." Its scripts never place orders.
Their alerts, like every alert in the table above, need a paid TradingView plan. TradingView's pricing page, read on 29 October 2026, lists "Active technical alerts on indicators, strategies, and drawings" as ✗ on Basic, 20 on Essential, 100 on Plus, 400 on Premium and 1,000 on Ultimate.
Check one yourself
- The close: look for
barstate.isconfirmedoralert.freq_once_per_bar_close. Without either, an indicator decides on the live candle. A strategy decides at the close unless itsstrategy(line sayscalc_on_every_tick = true. - The future: search for
lookahead,security(andoffset = -. Alookahead_onwithout[1]on the value reads a higher-timeframe candle before it closes, and a negative offset draws a value before it was known. - Swings:
pivothigh(high, n, n)is confirmed n candles after the swing. Plotted where it's confirmed, it's late; plotted withoffset = -n, it appears back on the swing before anyone could have known it. - The plan: find the lines that check the stop and the target, and which one comes first when a candle reaches both.
- The costs: look for
commission_valueandslippageon thestrategy(line. When they're missing, the Strategy Tester charges nothing unless you enter them in its properties.
None of these runs on MT5 or MT4: they are written in Pine Script, TradingView's own language.
Limits
One code read, on 29 October 2026, of the versions TradingView served that day. Scripts change, and boosts measure popularity, not quality. We tested none of the 11. We build and sell Signal Desk and Signal Desk Premium, and we have no relationship with any author named here. Nothing here is financial advice.
Frequently asked questions
What is the best buy sell indicator on TradingView?
For a signal that comes with a stop and a target, kelfry98's Buy Sell Signal (16,935 boosts): a 5 and 13 EMA cross, a stop half an ATR beyond the signal candle, a final target at 3R with 1R and 2R marked, and alerts for the signal, the stop and the target. It decides on the live candle, and when one candle reaches both the stop and the target it scores the target. The most-boosted, tux's TonyUX EMA Scalper (21,008 boosts), is a close across a 20-candle EMA with no stop, no target and no alert. We tested none of them.
Which buy sell indicator does not repaint?
None of the 11 open-source scripts we read looks at a future candle, so the marks on closed candles stay put. But the eight indicators among them that mark a buy or sell decide on the live candle, so a mark can print and vanish before the candle closes. Set their alerts to fire once per bar close. The two strategies decide at each close and fill at the next open.
Is there a buy sell indicator with target and stop loss on TradingView?
Three of the 11 we read give both. kelfry98's Buy Sell Signal sets a stop half an ATR beyond the signal candle and a target at 3R, and alerts when either is hit. SerdarYILMAZ's strategy puts both one ATR away and tests them in the Strategy Tester, with no costs. Saleh_Toodarvari's ENVELOPE RSI draws both 0.15% from the signal candle's average price and doesn't track them. The Range Filter's High Target and Low Target are bands that move every candle, not a target.
Is there a 100% accurate buy sell indicator?
No honest indicator can claim it. TradingView's publishing rules say a script's author must substantiate any claim about signal accuracy in its description, and that a claim that can't be substantiated does not belong in the publication. None of the 11 scripts we read states an accuracy figure in its code.
What is the buy sell indicator name in TradingView?
There are many. In TradingView's script search on 29 October 2026, the most-boosted open-source script with buy and sell in its name was TonyUX EMA Scalper - Buy / Sell by tux (21,008 boosts), then Buy Sell Signal by kelfry98 (16,935) and Range Filter Buy and Sell 5min (14,980). Boosts measure popularity, not results.
Do buy sell indicator alerts work on TradingView's free plan?
No. TradingView's pricing page, read on 29 October 2026, shows no technical alerts on indicators, strategies or drawings on Basic, 20 on Essential, 100 on Plus, 400 on Premium and 1,000 on Ultimate. The scripts themselves run on any plan.
Do these buy sell indicators work on MT5 or MT4?
No. All 11 are written in Pine Script, TradingView's own language, and run only on TradingView. An MT5 or MT4 indicator has to be written in MQL5 or MQL4.
Which buy sell tool does ProEA make?
Two, and neither is free. Signal Desk, in Pine Pro Library, grades five checks on a pullback or breakout and draws a stop and targets at 1R, 2R and 3R, deciding on confirmed candles. Signal Desk Premium, $49 once, keeps the same entries and adds a heads-up before the signal, a trade ticket sized from your risk, scale-outs, a daily lock and a 20-market Radar with one alert. Neither places orders or promises better results.