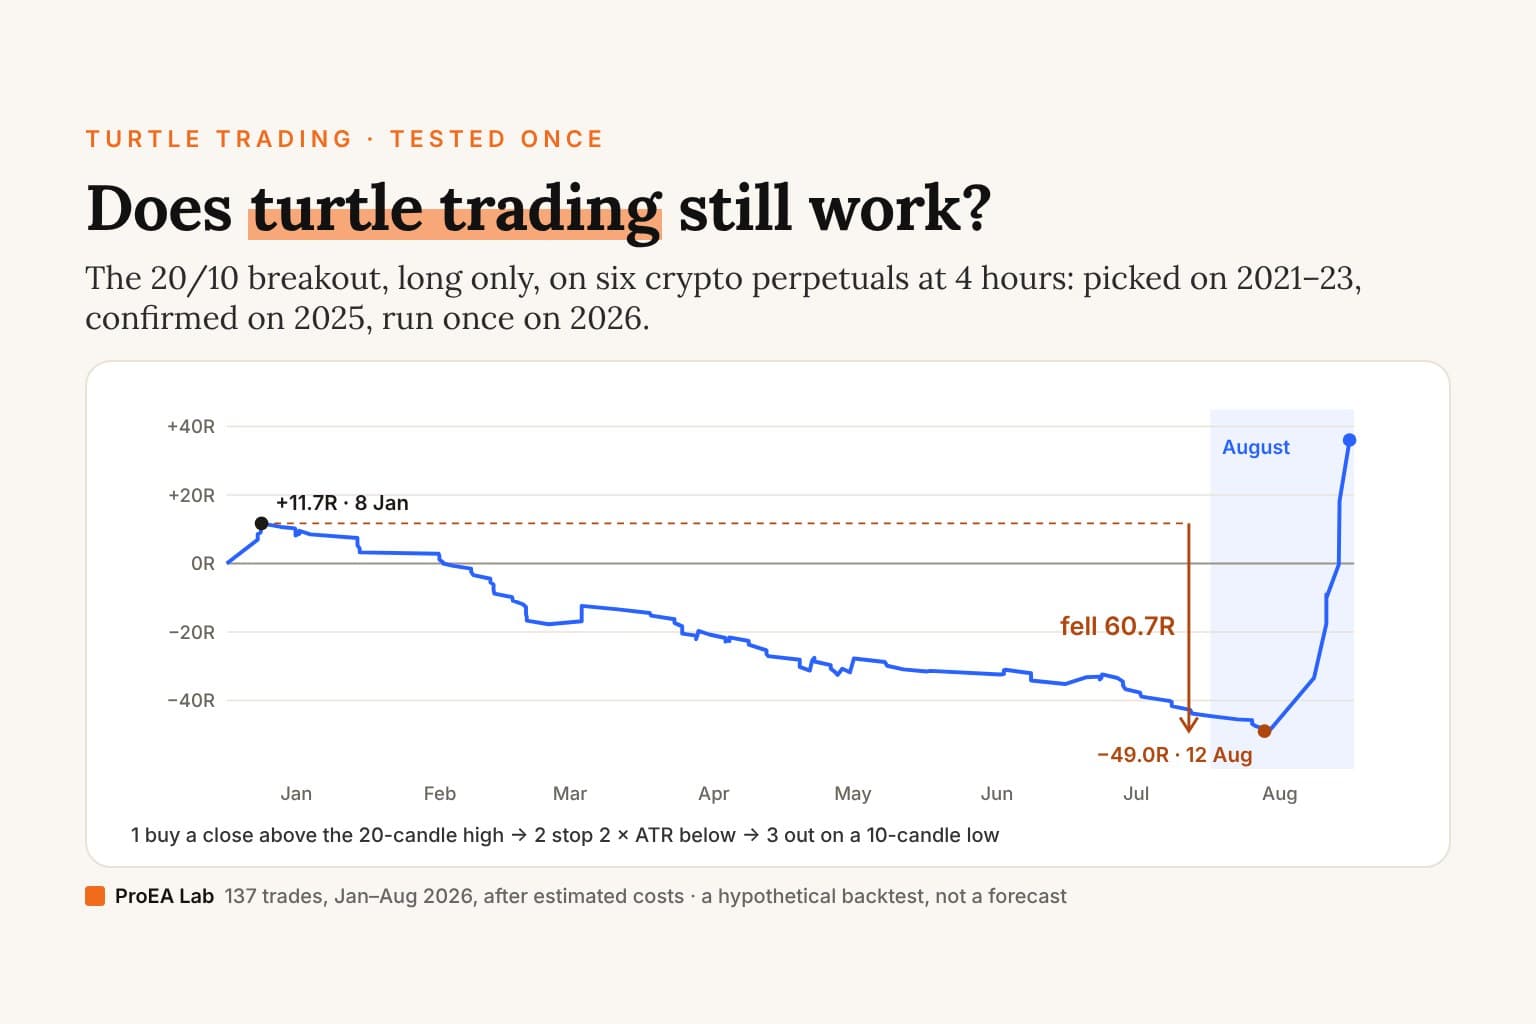
Breakaway Desk Premium's Trend Radar trades one rule: buy a 4-hour close above the 20-candle high, put the stop 2 × ATR below, and get out on a 10-candle low. That is the Turtle Traders' System 1 entry and exit lengths with their 2N stop, run long only on six crypto perpetuals. We picked it on 2021–23, confirmed it on 2025, then ran it once on January–August 2026 under a protocol fingerprinted on 24 Sep 2026, 14:30:23 UTC.
It passed. In the final test, Jan–Aug 2026, the rule made +36.1R over 137 trades with a profit factor of 1.41, and 5 of 6 markets ended up. Only 27% of trades won, and the result fell 60.7R before August recovered it.That answers the question for one rule, one market type and one window, nothing more. It is a hypothetical backtest after estimated costs, not a forecast, and not a live record.
"Does the Turtle system still work?" is a question the Original Turtles site itself puts on its home page: "The question everyone asks, and the reframing that makes it answerable." A 2005 reply on the Trading Blox forum gave the reframing: "The only way to find out is to test it and see." This is one such test, written down before it ran. (Not to be confused with ICT's turtle soup, which fades a 20-day breakout instead of buying it.)
The Donchian breakout strategy we tested, next to the Turtle rules
The original rules come from "The Original Turtle Trading Rules", a scanned PDF on the Original Turtles site, which now sits on tradingblox.com. The site describes it as "The complete rules of the Turtle Trading System, as taught by Richard Dennis and William Eckhardt to their students in the 1980s". The pages we read show no author's name and no year.
The PDF's chapter on entries opens: "The Turtles used two related system entries, each based on Donchian’s channel breakout system." System 1 is "A shorter-term system based on a 20-day breakout" and System 2 is "A simpler long-term system based on a 55-day breakout." System 1 is the original 20-day breakout strategy, and it is the one the Trend Radar borrows.
| The original Turtle rules | The Trend Radar | |
|---|---|---|
| Entry | System 1: a 20-day breakout. System 2: a 55-day breakout | A 4-hour close above the 20-candle high |
| Fill | "Turtles always traded at the breakout when it was exceeded during the day, and did not wait until the daily close or the open of the following day." | At the close of the breakout candle |
| Exit | System 1: "a 10 day low for long positions". System 2: "a 20 day low for long positions" | A close below the 10-candle low |
| Stop | "Turtle stops were set at 2 N below the entry for long positions" | 2 × ATR(20) below the entry, set once |
| Size | "Units were sized so that 1 N represented 1% of the account equity." | Counted in R, the amount the stop risks |
| Filter | System 1 signals "would be ignored if the last breakout would have resulted in a winning trade" | None: every breakout is taken |
| Adding | Units added "at ½ N intervals" up to a limit | None: one position per market |
| Direction | Long and short | Long only |
| Markets | Commodity futures, daily bars | Six crypto perpetuals, 4-hour candles |
N is the Turtles' volatility unit, and the PDF defines it plainly: "N is simply the 20-day exponential moving average of the True Range, which is now more commonly known as the ATR." To size a Turtle Unit from N, with the 2N stop and the ½N adds worked out, use the Turtle position size calculator; for the channel itself, its settings and how it differs from Bollinger Bands and Keltner Channels, see the Donchian channel strategy explainer.
What we kept: the 20-candle entry, the 10-candle exit and the 2 × ATR stop, with the ATR taken over 20 candles like N.
What we didn't keep:
- No System 1 filter. The Turtles skipped a System 1 breakout after a winning one and took the 55-day "Failsafe Breakout" instead. The Radar takes every 20-candle breakout, and has no 55-day system at all.
- No pyramiding. The Turtles added units as a trade moved their way. The Radar holds one position per market, and its stop never moves.
- No shorts. The Turtles sold 20-day lows; the Radar is long only. Versions that also went short made the shortlist, but the Premium page says they "lost money on 2025, so they never reached the final test."
- 4-hour candles, not days. 20 candles is 80 hours, a little over 3 days, and the 10-candle exit is 40 hours.
- Crypto perpetuals, not futures. BTC, ETH, SOL, XRP, BNB and DOGE perpetuals, on Binance data, with funding charged.
- Entry on the close. The Turtles bought the moment price crossed; the Radar waits for the 4-hour close. The study also checked a later fill: "Filling at the next candle's open instead of the close gives the same final test."
- Sizing in R. One Turtle unit put 1% of the account on 1 N, so the 2N stop risked 2%: "No trade could incur more than 2% risk." The test counts every result in R and leaves the percentage to you.
So this tests the Turtles' System 1 lengths and stop as a 4h trading strategy on crypto, not the whole Turtle system.
How it was picked: 96 rule sets, one bar, a shortlist of 6
Testing one famous rule and reporting it would be easy to flatter. This one came out of a search, and the search was written down:
- The search, 2021–2023 only: 96 rule sets, 72 Breakaway variants and 24 channel variants, on the same six markets.
- The bar: "≥ 150 trades, profit, profit factor ≥ 1.20, ≥ 4 of 6 markets, ≥ 2 of 3 years." 15 rule sets met it.
- The shortlist: "the best three of each family by net R ÷ max drop; 2024 kept out of every choice." That left 6.
- Confirmed on 2025: "the highest 2025 net R with profit factor ≥ 1.15 on ≥ 4 of 6 markets." One rule set came through: the Trend Radar's.
- The final test, written first: the protocol and its programs were fingerprinted on 24 Sep 2026, 14:30:23 UTC, with the pass rule "profit, profit factor ≥ 1.10, ≥ 4 of 6 markets, ≥ 30 trades". January–August 2026 "was never looked at until the one final run."
2024 was left out of every choice: it picked nothing and confirmed nothing. Its row below comes from the full trade list.
Every period, in numbers
| Period | Role | Trades | Won | Net R | Profit factor | Max drop | Markets up |
|---|---|---|---|---|---|---|---|
| 2021–23 | chosen | 554 | 30% | +314.2R | 1.96 | 59.8R | 6 of 6 |
| 2024 | left out | 197 | 34% | +118.7R | 2.13 | 21.6R | 6 of 6 |
| 2025 | confirmed | 203 | 29% | +21.6R | 1.18 | 28.2R | 4 of 6 |
| 2026 | final test | 137 | 27% | +36.1R | 1.41 | 60.7R | 5 of 6 |
All after estimated costs; 2026 is January–August. The final test met its pass rule: a profit, a profit factor of 1.41 against 1.10, 5 of 6 markets against 4, and 137 trades against 30.
Read the table for what it shows, not only for the last row:
- 2021–23 and 2024 look strongest. The chosen years were picked for it; 2024, which chose nothing, had the table's highest profit factor, 2.13.
- 2025 was thin. The year that confirmed the rule made +21.6R on 203 trades, with a profit factor of 1.18 and 4 of 6 markets up.
- The win rate never reached 35% in any period.
- The final test's fall was the deepest in the table: 60.7R in eight months, against 59.8R over the three chosen years.
Each market in the final test: BTC +6.9R, ETH +10.1R, SOL +9.8R, XRP +11.0R, DOGE +1.7R, and BNB −3.4R.
Turtle trading strategy win rate: how 27% can end positive
The Turtle rules warn about it in so many words: "The Turtle System enters on breakouts. Most breakouts do not result in trends. This means that most of the trades that the Turtles made resulted in losses."
In the final test, 37 of 137 trades won and 100 lost.
- The losses were small and capped. 62 trades hit the stop, at an average of −1.05R after costs; the worst was −1.10R. The other 38 losers left on the 10-candle low before the stop, for −22.45R between them.
- The wins were few and large. The average winner made +3.3R against an average loser of −0.9R, 3.8 times as much. Winners were held 6.3 days on average, losers 1.8 days.
- So the break-even win rate was about 21%. With those averages, a rule that wins 20.8% of the time breaks even. At 27% it kept +0.26R a trade.
The skew, trade by trade:
- The six biggest winners all came in August, one in each market: ETH +18.6R, SOL +17.8R, XRP +15.8R, BTC +15.4R, BNB +9.7R and DOGE +8.6R. Together they made +86.0R. The other 131 trades lost 49.9R.
- The best 14 trades, about 10% of the 137, made +110.1R; the other 123 lost 74.0R.
- The Premium page puts the whole record since 2021 the same way: "10% of trades made +924.9R since 2021; the rest lost 430.1R." Only the 2026 trades are published trade by trade, so that line is the Premium page's figure; we couldn't recompute it from them.
That is why the Turtles' win rate was low and why this one is too. A trend rule pays for many failed breakouts with small stops and waits for the few that run. Win rate on its own says almost nothing about it.
The fall: 60.7R before August
The result peaked at +11.7R on 8 Jan and slid to −49.0R on 12 Aug, a fall of 60.7R. The 122 trades that closed from January to July lost 43.8R between them; August's 15 trades made +79.9R.
- February: 15 trades, none won.
- The longest losing streak: 30 trades in a row, closed between 19 Jan and 11 Mar, for −27.3R. A second streak of 22 losses closed between 12 Jul and the low on 12 Aug.
- No single loss was bigger than 1.10R, and the most stops in a row was 6. The fall came from many small losses, not a few large ones.
What that means for an account depends on the risk per trade. As simple sums of R × risk, with no compounding:
| Risk per trade | Final test | Deepest fall |
|---|---|---|
| 0.25% | +9.0% | −15.2% |
| 0.5% | +18.0% | −30.3% |
| 1% | +36.1% | −60.7% |
At the Turtles' cap of 2% a trade, the same fall would be 121.4% as a simple sum: more than the account. The Premium page's advice is the plain one: "Trends come in bursts with quiet stretches between. Size small enough to be there when one runs." For what a fall like that takes to climb back from, see drawdown recovery.
What the costs were
Every R figure here is after the study's estimated costs: a 0.05% fee per side, one tick of stop slippage, and 0.01% funding per started 8 hours.
- That is why a stop-out averaged −1.05R, not −1R.
- Funding is charged per started 8 hours, so a long hold pays it many times: the six August winners were held between 5.7 and 13.3 days.
- Your costs may differ. Fees depend on your exchange and tier, and funding rates move. Check your own with the crypto perp fee calculator and the crypto funding rate calculator.
Is trend following profitable? What this test doesn't show
One pre-registered pass is evidence about one rule in one window. It doesn't show:
- A forecast. A rule that passed on January–August 2026 can fail in the next window. Nothing here is a live record.
- Other markets. Six large crypto perpetuals, on Binance data. No futures, stocks, forex or gold; in the Premium page's words, "Other markets were not tested."
- Shorts. Long only. This says nothing about the Turtles' short side.
- More than one window. 137 trades in eight months, and the result rests on one August: January to July was −43.8R.
- A different market climate. The Premium page's own answer about this year: "Crypto fell and chopped for most of 2026, and a trend rule pays for failed breakouts with small losses." A long-only rule spent most of the test buying breakouts in a falling market.
- Other settings. 20, 10 and 2 × ATR on 4-hour candles; "only these values were tested."
- A holding benchmark. The study doesn't report what holding the six coins long made over the same months, so it can't say the rule beat holding.
- The whole Turtle system. No filter, no 55-day system, no adding units, no shorts.
Not every trend rule we've tested got this far: our SuperTrend-style trend rule on 20 coins failed its written-first gate, and on the untouched coins holding long made more. For how much a sample of 137 trades can tell you, see how many trades you need to test a strategy.
What the research says about crypto trend following
Two papers, each with its status:
- Peer-reviewed: Liu and Tsyvinski, "Risks and Returns of Cryptocurrency", NBER Working Paper 24877 (August 2018), published in The Review of Financial Studies in 2021 (vol. 34(6), pages 2689–2727). From the abstract: "In contrast, we show that the cryptocurrency returns can be predicted by factors which are specific to cryptocurrency markets. Specifically, we determine that there is a strong time-series momentum effect and that proxies for investor attention strongly forecast cryptocurrency returns." It covers Bitcoin, Ripple and Ethereum, and time-series momentum is a cousin of a channel breakout, not the same rule.
- A 2025 working paper, not peer-reviewed: Zarattini, Pagani and Barbon, "Catching Crypto Trends: A Tactical Approach for Bitcoin and Altcoins", Swiss Finance Institute Research Paper No 25-80 (October 2025). From the abstract: "We propose an ensemble approach that aggregates multiple Donchian channel-based trend models, each calibrated with different lookback periods, into a single signal, as well as a volatility-based position sizing method. This model, applied to a rotational portfolio of the top 20 most liquid coins, achieved notable net-of-fees returns, with a Sharpe ratio above 1.5 and an annualized alpha of 10.8% versus Bitcoin." Those are backtest results stated in an abstract. We read the abstract on RePEc, not the full paper, and Carlo Zarattini is affiliated with Concretum Group, a fund manager.
Neither paper tests this rule. They are a reason the crypto trend following strategy question is worth a test, not evidence that this rule will keep passing.
How to check it yourself
- Rerun the study. Breakaway Desk Premium's Research Lab is in the download: "Download Binance's public data, reproduce every published figure, backtest your own rules, check TradingView's trade log against the engine." Its output, as the Premium page prints it:
dev      554 trades · net +314.154R · PF 1.962 · max drop 59.81R · 6/6 markets  matches the evidence note
val      203 trades · net +21.59R · PF 1.182 · max drop 28.168R · 4/6 markets  matches the evidence note
holdout  137 trades · net +36.055R · PF 1.412 · max drop 60.669R · 5/6 markets  matches the evidence note
REPRODUCED: every published figure matches.
- Check TradingView against the engine. "The TradingView script's trade log matched the research engine on 38 of 38 BTC trades."
- Run the rule on any chart with a free 20/10 Donchian breakout script for TradingView: copy the Pine code from this text file. It draws the channel, the 2 × ATR stop and each trade's R on one market, with no costs taken off and no alerts. The other open-source Donchian scripts are read line by line in the best Donchian channel indicator for TradingView, and the four rules, the Turtle originals and a sizing line fit on one page (PDF).
- Put your own numbers in. The trading expectancy calculator takes a 27% win rate with +3.3R winners and −0.9R losers; the Monte Carlo simulator shows how long losing streaks run at that win rate; and the crypto position size calculator sizes a 2 × ATR stop to the risk you chose.
Breakaway Desk, the intraday desk Premium builds on, is a different rule: it draws plans on 1–5 minute charts as a monitor, and its intraday rules lost money in validation.
Sources
- The study: its evidence note in the Premium download (
evidence/trend-study-2026-09-24.md), the protocol fingerprinted on 24 Sep 2026, and the 137 final-test trades the Premium page draws. Every final-test figure above is recomputed from those trades. - The Original Turtle Trading Rules (PDF) and the Original Turtles site, read 29 Oct 2026.
- The Trading Blox forum thread "Is turtle system still working or not?", read 29 Oct 2026.
- Liu and Tsyvinski, NBER Working Paper 24877 and Zarattini, Pagani and Barbon on RePEc, read 29 Oct 2026.
Disclosure
We, ProEA Lab, build Breakaway Desk and Breakaway Desk Premium, and sell them in Pine Pro Library and the Premium Vault. Every result here is a hypothetical backtest after estimated costs on historical Binance data, not a live record and not a forecast. Nothing in Premium places orders, and it is not the private Breakaway Bot or its signals. Trading involves risk.
Frequently asked questions
Does the turtle trading strategy still work?
Its System 1 lengths passed one pre-registered test. A 20/10 Donchian breakout with a 2 × ATR stop, long only on six crypto perpetuals at 4 hours, made +36.1R over 137 trades in January–August 2026 after estimated costs, with a profit factor of 1.41 and 5 of 6 markets up; 27% of trades won, and it fell 60.7R before August. That is one hypothetical backtest, not a forecast.
What is the turtle trading strategy win rate?
Low by design. The original rules say most Turtle trades lost, because most breakouts do not become trends. In our 20/10 final test, January–August 2026, 27% of 137 trades won, and the rule still made +36.1R with a profit factor of 1.41 and 5 of 6 markets up, after a 60.7R fall: a hypothetical backtest after estimated costs, not a forecast. The earlier periods won 29% to 34%. The average winner made 3.3R against an average loss of 0.9R, so with those averages the rule breaks even at a win rate of about 21%.
Is trend following profitable?
Not as a promise. A peer-reviewed paper by Liu and Tsyvinski found a strong time-series momentum effect in cryptocurrency returns, and our 20/10 breakout passed its pre-registered test on 2026. But the same rule made only +21.6R on 203 trades in 2025, a profit factor of 1.18, and our SuperTrend-style trend test failed its gate. A backtest that passed is not a forecast.
Does turtle trading work in crypto?
We only tested crypto: BTC, ETH, SOL, XRP, BNB and DOGE perpetuals on Binance data, 4-hour candles, long only. The 2026 final test, January–August, made +36.1R over 137 trades with a profit factor of 1.41 and 5 of 6 markets up, BNB the one down at −3.4R; 27% of trades won, and it fell 60.7R on the way. That is one hypothetical backtest after estimated costs, not a forecast. Versions that also went short made the shortlist but lost money on 2025, so shorts never reached the final test.
Is a 20-day breakout the same on a 4h chart?
No, the counts are candles. On 4-hour candles the 20-candle high covers 80 hours, a little over 3 days, and the 10-candle exit covers 40 hours. The Turtles counted days. Only 4-hour candles and the 20, 10 and 2 × ATR settings were tested here.
How was the Donchian breakout strategy backtested?
Written first. 96 rule sets were searched on 2021–23, 6 were shortlisted, one was confirmed on 2025, and the protocol was fingerprinted on 24 Sep 2026, 14:30:23 UTC before a single run on January–August 2026. 2024 was kept out of every choice. Costs: a 0.05% fee per side, one tick of stop slippage and 0.01% funding per started 8 hours.
Can I check the numbers myself?
Yes. Breakaway Desk Premium's Research Lab downloads Binance's public data, reruns the study and prints REPRODUCED when every published figure matches, and the TradingView script's trade log matched the research engine on 38 of 38 BTC trades. To run the rule on one chart, use a free 20/10 Donchian breakout script.