Short answer: "breakaway" means two different things on a chart. In classic chart analysis, a breakaway gap is a jump between two sessions that takes price out of a trading range: today's low above yesterday's high, at the start of a move. In ICT and smart money trading, a breakaway FVG is a fair value gap, three candles inside continuous trading, that passes one more test. Under LuxAlgo's rule, the gap forms beyond the high or low of a 20-candle Donchian channel; under the "3rd candle" rule scripts credit to Arjo, the third candle closes beyond the second. The same three candles can pass one test and fail another, as the example below shows.
What is a breakaway gap?
StockCharts' ChartSchool sorts gaps into four kinds: "Gaps can be subdivided into four basic categories: Common Gaps, Breakaway Gaps, Runaway Gaps, and Exhaustion Gaps". The breakaway gap is the one that starts something:
"Breakaway gaps are exciting. These occur when the price action is breaking out of a trading range or congestion area."
A gap, in this sense, is a jump between two sessions on a daily chart. The market closes, and the next session opens beyond the previous day's range: "For an up gap to form, the low price after the market closes must be higher than the high price of the previous day." Nothing traded in between.
StockCharts' advice is to read it as a beginning, not as something about to be undone: "Avoid falling into the trap of thinking this type of gap, if associated with good volume, will be filled soon. It might take a long time for the gap to be filled. Instead, go with the thought that a new trend in the direction of the stock has taken place and trade accordingly." And: "The point of the breakout now becomes the new support (if it's an upside breakout) or resistance (if it's a downside breakout)."
Breakaway gap vs runaway gap vs exhaustion gap
The four kinds differ by where they come in a move and what happens to them after, in StockCharts' words:
| Gap | Where it comes | Filled? |
|---|---|---|
| Common | "Common gaps are usually uneventful." | "usually get filled fairly quickly" |
| Breakaway | Out of "a trading range or congestion area": the start of a move | "It might take a long time for the gap to be filled." |
| Runaway, or measuring | "caused by increased interest in the stock"; "the measuring gap will occur in the middle of, or halfway through, the move" | Not always: see below |
| Exhaustion | "near the end of a good up or downtrend" | "Exhaustion gaps are quickly filled as prices reverse their trend." |
The exhaustion gap is the one to tell apart from the others: "They're identified by high volume and a large price difference between the previous day's close and the new opening price. They can easily be mistaken for runaway gaps if you overlook the exceptionally high volume." And on filling: "The adage that all gaps eventually get filled might not always hold true, especially in the case of Breakaway and Runaway gaps."
Why 24-hour markets rarely gap
A classic gap needs a pause. A stock's session ends, and the next one can open anywhere.
Crypto spot and perpetual futures trade around the clock, so each candle opens at, or a hair from, the last one's close. A candle that opens at or below the previous candle's high can't have its low above that high, so on a 24-hour chart two neighbouring candles almost always overlap. A gap between them needs the open itself to jump, which takes a pause in trading or in the data: a market closed for the weekend, like spot forex, or a feed that stops.
That is one reason the smart money vocabulary works with three candles instead of two. A fair value gap needs no pause.
What is a breakaway FVG in ICT?
A fair value gap is a three-candle pattern. In a bullish one, the third candle's low is above the first candle's high, so the prices between them traded only during the middle candle. LuxAlgo's code adds that the middle candle closes above the first candle's high: bull_fvg = low > high[2] and close[1] > high[2]. A bearish one mirrors it. If a later candle closes back through the far side of the gap, the same zone becomes an inverse fair value gap.
In ICT and smart money trading, "breakaway" is used for a kind of fair value gap. We found no definition of it from ICT himself. The two we found:
LuxAlgo's: an FVG at a new 20-candle high or low. LuxAlgo's library page: "Breakaway Fair Value Gaps isolates a specific breed of fair value gap: imbalances printed while price is breaking into new highs or lows of its range, with the range framed by Donchian Channels. Like the classical breakaway gap, these formations capture buyers or sellers driving the market aggressively beyond an extreme, which generally argues for continuation, yet because they form where price is already stretched, they can just as well precede the counter-move that rebalances them." In its code, a bullish FVG is breakaway when low > upper[2]: the third candle's low is also above the Donchian upper band two candles back, the highest high of the 20 candles up to and including the first candle. Its "Trend Length" input sets the 20. The page says the indicator "loads free from this LuxAlgo Library page" and that you "can also copy the source code from this page and run it anywhere Pine Script® runs", and the source there opens with its licence: "This work is licensed under a Attribution-NonCommercial-ShareAlike 4.0 International (CC BY-NC-SA 4.0)".
Arjo's: the third candle closes beyond the second. malk1903's open-source script, which its page says "is based on the teachings of 'Arjo'", puts it this way: "FVGs that are likely to be left un-touched by price are called 'Breakaway Gaps'." The rule: "For a bullish 'Breakaway Gap' we want to see the 3rd candle close above the high of the 2nd candle." And: "A bearish 'Breakaway Gap' is defined by the close of the 3rd candle being lower than the low of the 2nd candle." It comes with two warnings: "NOTE: As with all 'trading rules' this theory is not 100% accurate." And: "breakaway gaps will only remain 'breakaway' until a liquidity level is reached." ArjoioMMT's protected script describes its own version: "It identifies significant price gaps while tracking swing highs and lows, then evaluates if those gaps are likely to drive a strong directional move."
So LuxAlgo's rule asks where the gap is, at a new extreme, and Arjo's asks how its last candle closed. A third use turns up in make_raj's open-source SMC Engine: the first fair value gap after a break of structure, whatever its size or place. That is the shape our Breakaway Desk works with, below.
Breakaway gap vs fair value gap
Bullish versions; the bearish ones mirror them.
| Classic breakaway gap | Fair value gap | LuxAlgo's breakaway FVG | Arjo's breakaway FVG | |
|---|---|---|---|---|
| Candles | Two, across a session break | Three, in continuous trading | Three | Three |
| The gap | Today's low above yesterday's high | The third candle's low above the first's high | The same | The same |
| What makes it breakaway | It breaks out of a trading range | — | The third candle's low is above the 20-candle high, two candles back | The third candle closes above the second's high (malk1903's code also asks that the first candle's high reach the second's open and the third's low reach the second's close) |
| What the source expects | A new trend; slow to fill | — | Continuation, or a counter-move that rebalances it | Left untouched, until a liquidity level |
| Source | StockCharts' gap types | — | LuxAlgo's indicator | malk1903's script, after Arjo |
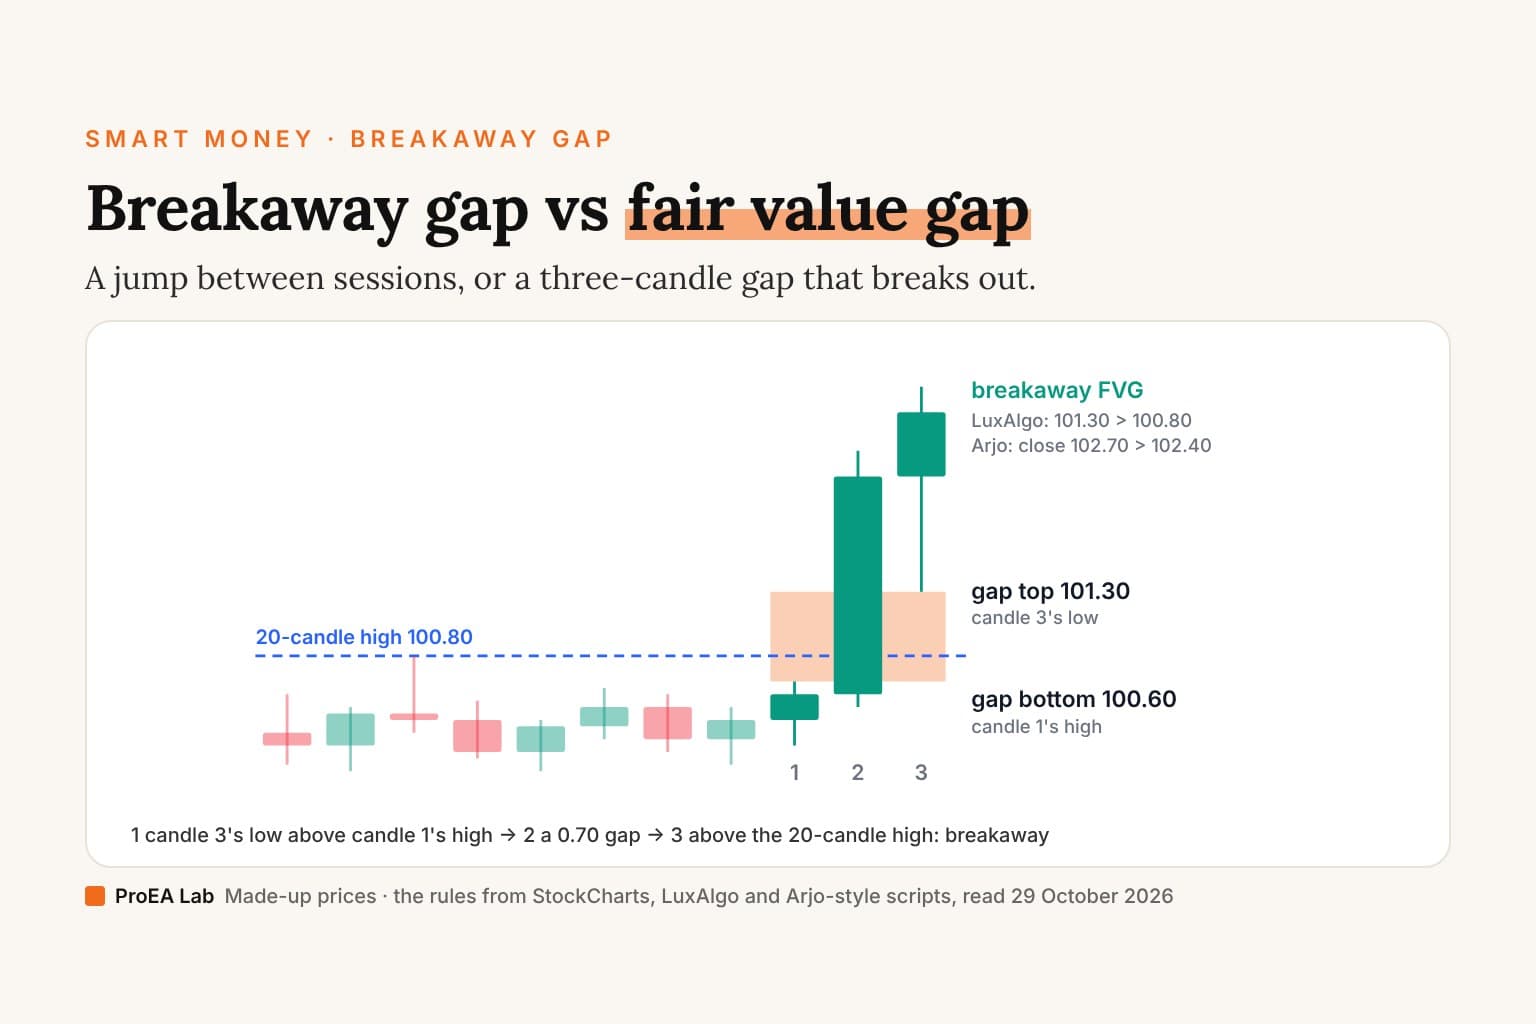
A worked example: three candles
Made-up prices. Say the highest high of the 20 candles up to and including candle 1 is 100.80.
| Candle | Open | High | Low | Close |
|---|---|---|---|---|
| 1 | 100.30 | 100.60 | 100.10 | 100.50 |
| 2 | 100.50 | 102.40 | 100.40 | 102.20 |
| 3 | 102.20 | 102.90 | 101.30 | 102.70 |
- The fair value gap. Candle 3's low, 101.30, is above candle 1's high, 100.60, so the prices between traded only inside candle 2. That is a bullish FVG with its bottom at 100.60 and its top at 101.30: 0.70 wide, its midpoint at 100.95. LuxAlgo's version also wants candle 2's close above candle 1's high: 102.20 is.
- Breakaway, LuxAlgo's rule. Candle 3's low must also clear the 20-candle high two candles back: 101.30 is above 100.80, so it is a breakaway FVG. Had that 20-candle high been 101.50, the same three candles would make an ordinary FVG.
- Breakaway, Arjo's rule. Candle 3 closes at 102.70, above candle 2's high, 102.40: breakaway again. Had it closed at 102.10, below 102.40, malk1903's script would draw it as what it calls a weak 3rd candle FVG.
- A classic gap? No. Each candle overlaps the one before it: candle 2's low, 100.40, is below candle 1's high, 100.60, and candle 3's low, 101.30, is below candle 2's high, 102.40. StockCharts would see no gap on these three.
- Filled? LuxAlgo's indicator would count this gap mitigated if a later candle closed below 100.60, its bottom, within 60 candles. That same close would turn the zone into an inverse FVG.
How to trade a breakaway gap
The three sources pull in different directions:
- StockCharts, the classic gap: a new trend; the breakout point becomes support.
- LuxAlgo's author, the breakaway FVG: "In theory, the Breakaway FVGs should generally be a good indication of market participation, showing favor in the FVG's breaking direction." And: "After identifying a Breakaway FVG, we could logically look for a reversion to re-balance the gap."
- Arjo-style scripts: breakaway FVGs are the ones "likely to be left un-touched by price".
The dashboard on LuxAlgo's TradingView page shows its count on an example chart: "Out of 949 Bearish Breakaway FVGs, 80.19% are shown to be mitigated within 60 bars, with the average mitigation time being 13 bars." In its code, "mitigated" means a close back through the far side of the gap. That is one chart's count, not a test of a trade.
We haven't tested a rule for either kind of breakaway gap, so we can't tell you which way to trade one. The one related rule that went through a validation, below, lost money.
The first FVG after a break: what Breakaway Desk does
Breakaway Desk, the intraday desk in Pine Pro Library, is our TradingView indicator built on the smart money version: a break of structure, then the first fair value gap after it. Its code calls itself an "Original, inspectable public-concept implementation", and our page says it is not the private Breakaway Bot or its signals. On standard 1–5 minute candles, version 2.0.0 works like this:
- The break. It finds confirmed swing highs and lows on 15-minute candles, pivots with 2 candles on each side. A candle that closes beyond a confirmed swing that is still unbroken is a break. It reads the 15-minute swings through
request.securitywith lookahead on, but only the previous 15-minute candle's values ([1]), so it never sees a 15-minute candle before it closes. - The first gap. The first same-direction fair value gap within the next ten chart candles becomes the return zone: for a long, a third candle's low at least one tick above the first candle's high, the same three candles as above. A displacement filter, the break candle's body as a multiple of ATR, is there and off by default.
- The limit. A resting limit at the gap's near edge (its midpoint, as an option) waits 10 minutes for price to come back. The stop goes beyond the latest opposite swing on the chart, the target is 1R, and entry, stop, target and size are frozen when the plan is made, sized to a $100 risk budget by default.
- Three endings. Target, stop, or no return: the limit expires and there's no trade.
In the example above, if candle 3 had completed the first such gap after a close above a 15-minute swing high, and its other checks passed, the desk's buy limit would rest at 101.30, the gap's top, or at 100.95 with Midpoint. Under Arjo's reading, that is a gap price is expected not to come back to.
Its rules lost money. In our page's words: "The rules lost money after estimated costs: core validation MGC −USD295 over 8 trades and MNQ −USD144 over 9, on two observed days." Breakaway Desk Premium's page says the same of these rules on six intraday markets: "A monitor: these intraday rules lost money in our validation." Breakaway Desk is a plan-drawing and monitoring tool. It draws the plan and says what is happening on your chart; it places no order unless you connect a live webhook to its Automation output, and its page says to keep Automation Off while you learn it. Its full Pine v6 source is in Pine Pro Library, $49 once.
Breakaway gap indicators on TradingView
TradingView's script search on 29 October 2026 found 10 scripts with "breakaway" in the name; 7 are open source. By boosts that day:
- Breakaway Fair Value Gaps [LuxAlgo] (5,266 boosts). Pine v6. It boxes bullish and bearish breakaway FVGs at a 20-candle Donchian extreme, draws a mitigation line at each gap's far edge, and its dashboard counts how many a close went back through within 60 candles. No alerts. CC BY-NC-SA 4.0, on LuxAlgo's page.
- Breakaway Gaps and Breakaway Areas | Arjoio (956 boosts, ArjoioMMT). Protected: we can't read its code.
- FVG Breakaway/3rd Candle (Arjo) [MK] (877 boosts, malk1903). Pine v5. It colours fair value gaps whose third candle closes beyond the second ("Breakaway FVGs") apart from those whose third candle doesn't ("Weak 3rd Candle FVGs"). Its code also asks that the first candle's high reach the second's open and the third's low reach the second's close. No alerts. MPL 2.0.
- DeLeBlanc's three scripts (230, 91 and 81 boosts) are open source too.
- SMC Engine (FVG, POI, Breakaway) (80 boosts, make_raj). Pine v6. It labels "BREAKAWAY GAP" on the first fair value gap after a close through a swing level, which it marks BOS or CHoCH: the same idea as Breakaway Desk's first gap after a break.
- 4H Breakaway/Inverse Gap (8 boosts, arthim) looks for the classic two-candle gap instead: a 4-hour candle whose low is above the previous 4-hour candle's high, or the mirror, at least 2% by default.
LuxAlgo frames its range with a Donchian channel; how the open-source Donchian scripts draw theirs is in our Donchian channel code read.
Sources
- StockCharts ChartSchool, "Gaps and Gap Analysis", read 29 October 2026.
- LuxAlgo, "Breakaway Fair Value Gaps", LuxAlgo's library page and its source, and the script's TradingView page, read 29 October 2026.
- TradingView pages for FVG Breakaway/3rd Candle (Arjo) [MK] and Breakaway Gaps and Breakaway Areas | Arjoio, read 29 October 2026.
- TradingView's script search for eight breakaway, FVG and Donchian terms, 29 October 2026, and the open-source scripts' code.
- Breakaway Desk 2.0.0's Pine source and its page.
Disclosure
We build and sell Breakaway Desk, in Pine Pro Library, and Breakaway Desk Premium. We have no relationship with LuxAlgo or any other author named here. The prices in the example are made up. Nothing here is financial advice.
Frequently asked questions
What is a breakaway gap?
In classic chart analysis, a gap that takes price out of a trading range: StockCharts says breakaway gaps occur when the price action is breaking out of a trading range or congestion area. A gap here is a jump between sessions: for an up gap, the low after the close must be above the previous day's high. StockCharts' advice is to treat it as the start of a new trend, with the breakout point as new support, rather than expect the gap to fill soon.
What is the difference between a breakaway gap and a fair value gap?
A breakaway gap is a jump between two sessions, so two neighbouring candles don't overlap. A fair value gap is a three-candle pattern inside continuous trading: in a bullish one, the third candle's low is above the first candle's high, so the prices between traded only during the middle candle. A breakaway FVG is a fair value gap that also passes a breakaway rule, and the rule depends on whose definition you use.
What is a breakaway gap in ICT?
In ICT and smart money trading, breakaway is used for a kind of fair value gap, not a gap between sessions. We found no definition from ICT himself. LuxAlgo's indicator calls an FVG breakaway when it forms beyond the high or low of a 20-candle Donchian channel. Scripts based on Arjo's teaching call it breakaway when the third candle closes beyond the second candle's high or low, and expect those gaps to be left untouched.
What is the difference between a breakaway gap and a runaway gap?
Where they come in the move. StockCharts' breakaway gap breaks price out of a trading range, at the start of a trend. Its runaway gap, also called a measuring gap, comes from increased interest in the stock during the move, and the theory is that it comes halfway through.
What is the difference between an exhaustion gap and a breakaway gap?
An exhaustion gap comes near the end of a trend, a breakaway gap at its start. StockCharts says exhaustion gaps come with high volume and a large jump from the previous close, are quickly filled as prices reverse, and can be mistaken for runaway gaps if you overlook the volume. A breakaway gap, it says, might take a long time to fill.
How do you trade a breakaway gap?
The sources disagree, and we haven't tested a rule for either kind. StockCharts treats a classic breakaway gap as a new trend, with the breakout point as new support. LuxAlgo's author suggests looking for a reversion that rebalances a breakaway FVG. Arjo-style scripts call breakaway FVGs the ones likely to be left untouched. Breakaway Desk, the intraday desk in Pine Pro Library, rests a limit in the first gap after a break; its rules lost money in the author's validation after estimated costs.
Is there a breakaway gap indicator on TradingView?
Yes. LuxAlgo's Breakaway Fair Value Gaps is the most-boosted, with 5,266 boosts on 29 October 2026; it is open source, and LuxAlgo's own page licenses it CC BY-NC-SA 4.0. malk1903's FVG Breakaway/3rd Candle (Arjo) [MK], with 877, draws the Arjo rule. ArjoioMMT's Breakaway Gaps and Breakaway Areas, with 956, is protected. Of the open-source ones, arthim's 4H Breakaway/Inverse Gap, with 8, looks for the classic two-candle gap, and make_raj's SMC Engine, with 80, calls the first fair value gap after a break of structure breakaway.
Do breakaway gaps get filled?
Not always, says StockCharts: the adage that all gaps get filled might not hold, especially for breakaway and runaway gaps. LuxAlgo's indicator counts how many breakaway FVGs a later close goes back through within 60 candles; the example dashboard on its page reads 80.19% of 949 bearish ones. That is one chart's count, not a test, and Arjo-style scripts expect the opposite.