Short answer: for the previous hour's high and low with an alert, the free script we'd pick is Custom Previous High/Low + Breakout Alerts by Ufonose (399 boosts). It reads the last closed hour in the form TradingView's Pine manual gives, so its lines don't move when the chart reloads, and its Wait for Close setting alerts once per level when a 15-minute candle closes beyond one. It draws no stop and no target. For a stop and a target on the chart, LuxAlgo's Breakout Detector (4,521 boosts) draws both on a timeframe you choose (60 for the hour), but it decides on the live candle and its licence is non-commercial. The most-boosted "Previous Candle High and Low", by Cogax (660 boosts), is two price labels.
Most lists name previous candle high low indicators.
This one reads them.
What we checked
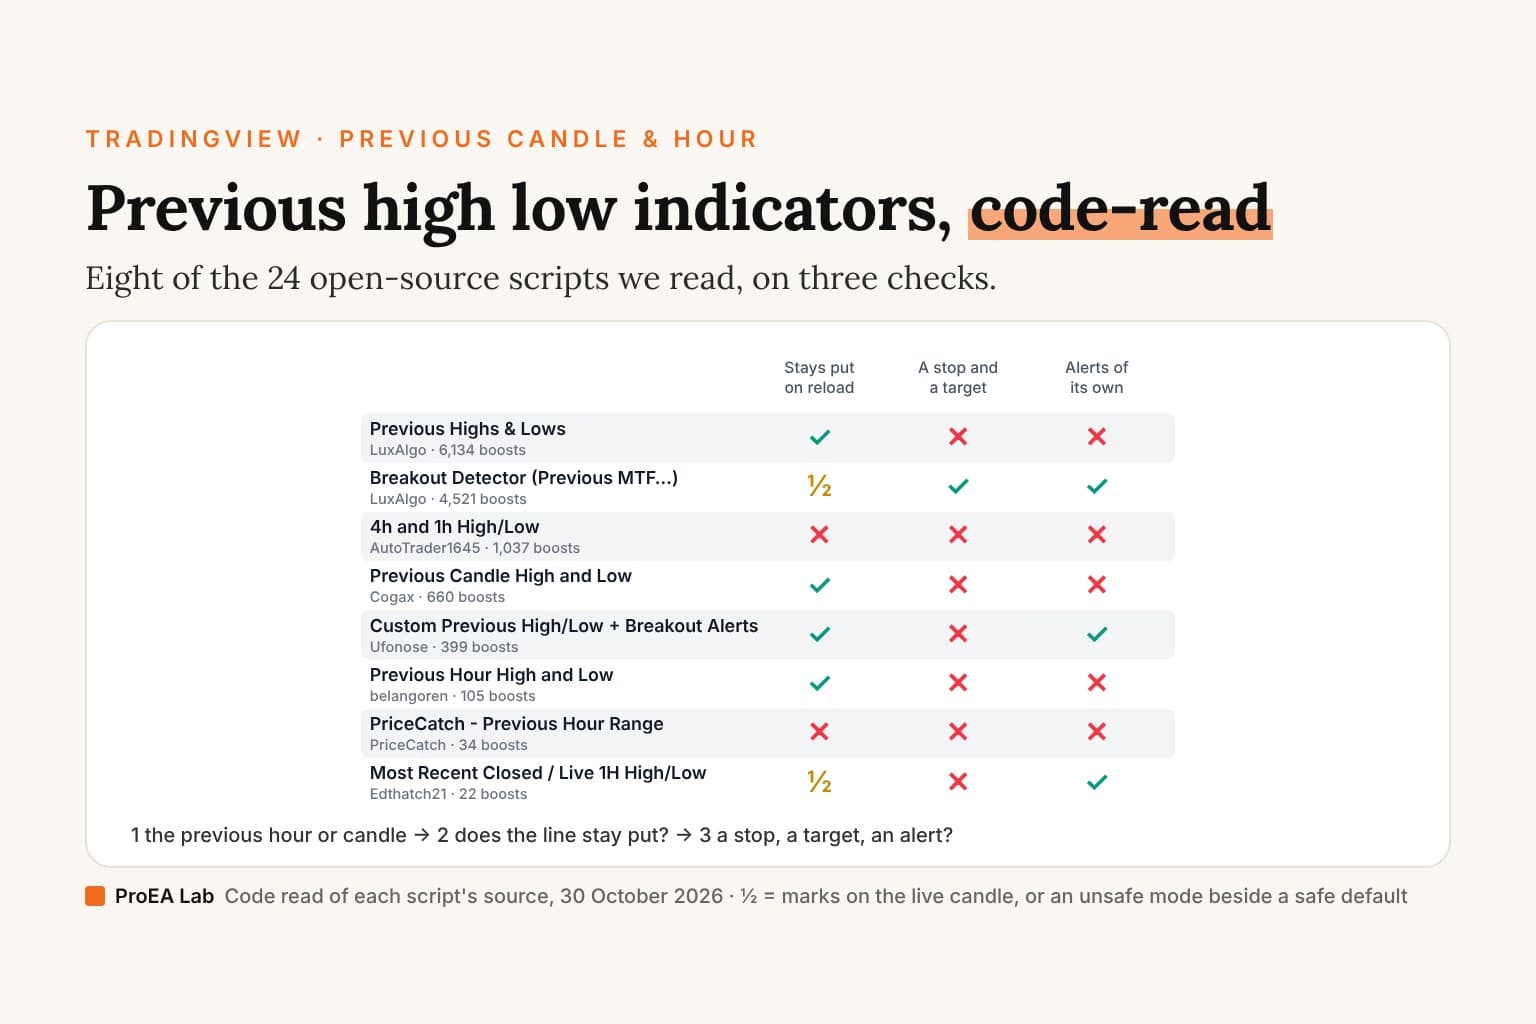
We searched TradingView's scripts for 24 terms on 30 October 2026, from "previous candle high low" and "previous hour high low" to "hourly high low", "h1 high low" and "hourly breakout". That returned 168 scripts: 135 open source, 30 protected (free to add, with the code hidden) and 3 invite-only. We read 24 of the open-source ones in full: the five most boosted, all eight with "previous candle" or "previous hour" in the title, and 11 more that draw an hourly or higher-timeframe high and low or signal on one. The other 111 open-source scripts, unread, include previous-day and session levels, first-hour ranges, hourly opens and separators, and statistics tables.
Four questions for each:
- Which previous? The chart's last candle, the last hour or the last day, and whose hour: TradingView's 1-hour candle or a clock hour.
- Does it repaint? How it asks for the level decides it: from the chart's own candles; with
request.security(),[1]andlookahead_on(the manual's form); with a plainrequest.security()call; withlookahead_onand no[1]; or in Pine version 1. - A signal? Does it mark or alert anything, and on a closed candle or the live one?
- A stop or a target, and alerts?
Boosts as TradingView's search showed them on 30 October 2026. "The manual's form" in the tables means request.security(…, high[1], lookahead = barmerge.lookahead_on).
Hourly high low indicators for TradingView
| Script | Boosts | The level | Repaints? | Signal | Stop / target | Alerts |
|---|---|---|---|---|---|---|
| Previous Highs & Lows [LuxAlgo] (LuxAlgo) | 6,134 | The last 4 hours, days, weeks, months or years (days by default), plus the forming one, dashed | No: drawn on the last candle only; the dashed current period moves by design | None | None | None |
| Breakout Detector (Previous MTF High Low Levels) [LuxAlgo] (LuxAlgo) | 4,521 | The previous higher-timeframe candle, built from chart candles; daily by default, 60 for the previous hour | On the live candle: nothing waits for the close, so a mark can print and vanish | One close beyond the level; "F" when the next candle closes back inside | Yes: a stop 3 times the average range of every loaded candle away, a 2:1 target | 8 alert conditions |
| CRT Hourly/15m dividers and opens (SpxGh0st) | 2,091 | Each finished hour's high, low, middle and open, from chart candles, on 15-minute charts or lower | No; the forming hour's lines move by design | None | None | None |
| 4h and 1h High/Low (AutoTrader1645) | 1,037 | The current 1-hour and 4-hour candle, not the previous one | Yes: Pine version 1, so on history each hour's final high shows from its first candle | None | None | None |
| Current Hourly Open Liquidity with Sweep Detection (outofoptions) | 905 | The previous hour's high and low and this hour's open, from chart candles, for the last two hours | No; its alert fires on the live candle | A trade through the previous hour's high or low in the hour's first 20 minutes | None | Its own alert() |
| Hourly Ranges [QuantVue] (QuantVue) | 410 | Not the previous hour: lines around each hour's open from the same hour's last 10 ranges | No: the manual's form | None | None | None |
| Custom Previous High/Low + Breakout Alerts (Ufonose) | 399 | The previous candle of any timeframe, 1 hour by default | No: the manual's form | Alerts only: price trading through (the default) or, with Wait for Close, a closed 15-minute candle beyond | None | Its own alert(), once per level per period, and 2 alert conditions |
| H1/H4/D1 High/Low (KikeAOR) | 242 | The last closed 30-minute, 1-hour, 3-hour, 4-hour and daily candles | No at its defaults: the manual's form. Show more than one level and an older level's "taken" check reads the forming candle | Touch alerts only | None | Its own alert() on a touch |
| Previous Hour High and Low (belangoren) | 105 | The previous hour | No: the manual's form | None | None | None |
| HTF Previous Candle High/Low (elvisnocoin) | 61 | The previous candle of any timeframe, 1 hour by default | No: the manual's form | None | None | None |
| PriceCatch - Previous Hour Range (PriceCatch) | 34 | The hour just ended, as a box | Yes: a plain call. Drawn live, the box takes the new hour's first candle; a reload redraws it | None | None | None |
| Most Recent Closed / Live 1H High/Low (Edthatch21) | 22 | The last closed hour by default; the forming one in Live 1H | No in Closed 1H; Live 1H uses lookahead without [1], so history shows each hour's final high early | Line colours: broken on a close beyond, rejected on a touch and a close back, read on the live candle | None | 4 alert conditions |
| Hourly High/Low Lines (andriv) | 9 | Not the previous hour: the low of one New York hour (18:00) and the high of another (19:00), each day | No | None | None | None |
An earlier script with the same title by KikeAOR (101 boosts) reads 15-minute, 1-hour, 4-hour and daily candles the same way, with the same touch alerts.
Previous candle high low indicators
| Script | Boosts | The level | Repaints? | Signal | Stop / target | Alerts |
|---|---|---|---|---|---|---|
| Previous Candle High and Low (Cogax) | 660 | The chart's previous candle, as two price labels | No | None | None | None |
| HTF Candle Highs and Lows with Labels + High Probability Signals (FXMAFIA20) | 401 | The previous 4-hour, daily and weekly candles | Levels no: the manual's form. Its markers can come and go on the live candle | The previous candle closed 0.1% beyond a level, in its direction, on volume above its 20-candle average, inside a session filter | None | None |
| Previous High/Low MTF (Trendoscope) | 346 | The previous candle of any timeframe, monthly by default | No at its defaults (an offset of 1, lookahead on); an offset of 0 with lookahead on would read the future | None | None | None |
| Previous Candle High/Low (Clean) (MSAProTrader) | 190 | The candle before the previous one: high[2] and low[2] | No | None | None | None |
| Previous Candle Sweep Indicator (lonsu) | 173 | The previous candle, only to colour outside bars | No | An outside bar: a high above the previous high and a low below the previous low | None | None |
| Previous Candle High/Low (Global Rays) (samb817) | 122 | The previous candle | Its break marks show only while a candle forms and clear at its close; on history none print | A trade above the previous high or below the previous low | None | 2 alert conditions, true only before a candle closes |
| Previous Candle High Low [JoeyWave] (Joeywave369) | 85 | The previous candle of any timeframe, 4 hours by default, from chart candles | No | None | None | None |
Previous day high low indicators
| Script | Boosts | The level | Repaints? | Signal | Stop / target | Alerts |
|---|---|---|---|---|---|---|
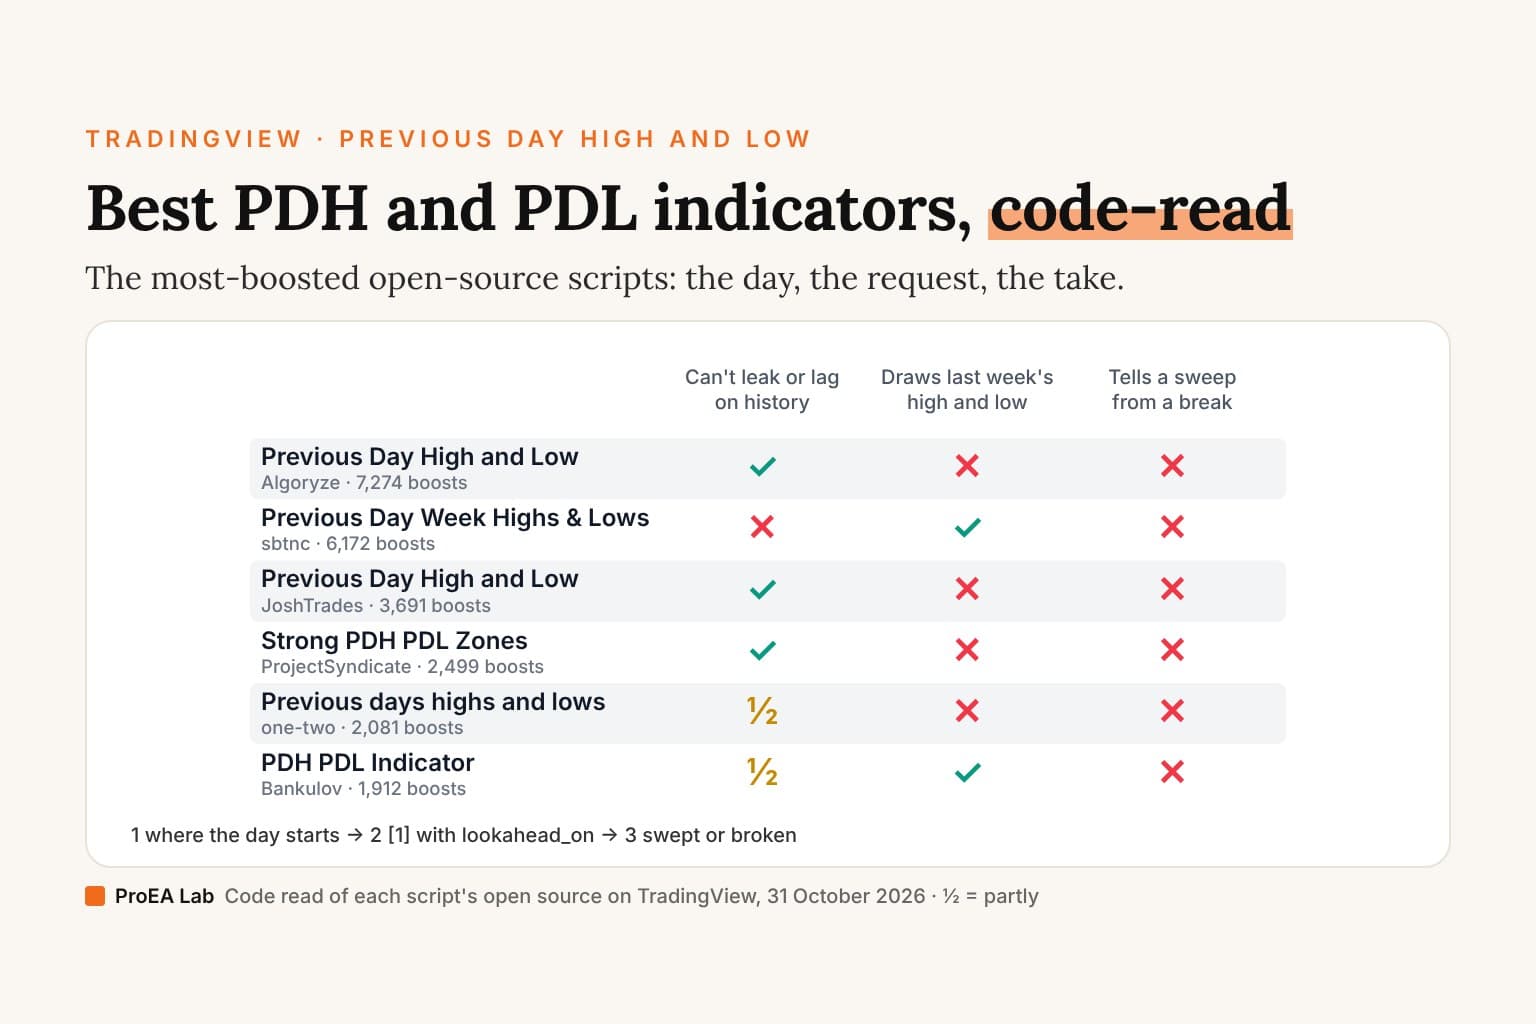
| Previous Day High and Low + Separators Daily/Weekly (Algoryze) | 7,269 | The previous day, from chart candles, with day and week separators | No | None | None | None |
| Previous Day Week Highs & Lows (sbtnc) | 6,169 | Previous days, weeks and months | Yes: lookahead on without [1]. A day that begins on a live chart keeps its first candle's high and low until a reload | None | None | None of its own |
| All-In-One Sessions, Weekly, Monday, Previous Highs/Lows (Texmoonbeam) | 5,184 | The previous day, week and month, Monday's range and three sessions | No: drawn on the last candle only | None | None | 26 alert conditions on crosses |
For the previous day on its own, where each script starts the day and whether any tells a sweep of the level from a break, we read the 15 most-boosted scripts that draw it: best previous day high low indicators, code-read.
What the code says
Ufonose's reads the hour right and tells you about it. It asks for the last closed candle of the timeframe you set, 1 hour by default, in the manual's form, so what it draws on history is what it drew live. Its alerts come two ways. Instant, the default, fires when price trades through a level. Wait for Close fires when a candle of its close timeframe, 15 minutes by default, has closed beyond the level, a close it reads in the same safe form. Each level alerts once per period. It draws no marker, no stop and no target, and its help text tells you to set the alert's condition to "Any alert() function call".
LuxAlgo's Breakout Detector is the only one here with a stop and a target. It builds the previous higher-timeframe candle's high and low from your chart's candles (daily by default; 60 makes it the previous hour), marks the first close beyond one, and draws a stop and a 2:1 target from that close. The stop's distance is 3 times the average range of every candle loaded on the chart, so it changes with how much history the chart has. It marks a false breakout, "F", when the very next candle closes back inside. It counts its target as hit on a wick and its stop only on a close, and its dashboard tallies wins and losses that way. Nothing waits for the candle to close, so a mark can print and vanish on the live candle. It's shared under CC BY-NC-SA 4.0, a non-commercial licence, as is outofoptions'.
Three read the hour the way the manual warns against. PriceCatch's Previous Hour Range asks for the hour with a plain request.security() call, so on a live chart the box for the hour just ended takes the new hour's first candle; after a reload it shows the right hour. AutoTrader1645's 4h and 1h High/Low has no version line, so it's Pine version 1, whose security() "systematically accessed future data from a higher timeframe on historical bars", in the manual's words; it also draws the current hour, not the previous one. Edthatch21's is right by default, in Closed 1H, but its Live 1H mode uses lookahead_on without [1]. The film below plays both mistakes, and the manual's form, on one hour.
sbtnc's previous-day lines, the census's second most boosted script, use the same unsafe form. Its daily request has lookahead_on and no [1], and each day's line is fixed when that day's first candle prints. On history that's the day's final high, drawn from its first candle. On a live chart it's whatever the day had made by its first candle's close, until you reload.
Some titles don't match the code. MSAProTrader's Previous Candle High/Low (Clean) draws the candle before the previous one, high[2] and low[2]; its own title in the code is "Before Previous Candle High/Low". lonsu's Previous Candle Sweep Indicator colours outside bars and prints how much bigger the range is: no sweep, no close back inside. QuantVue's Hourly Ranges draws lines around each hour's open from that New York hour's last 10 ranges, not the previous hour's high and low. andriv's Hourly High/Low Lines draws one fixed New York hour's low (18:00) and another's high (19:00).
samb817's break marks can't survive a close. It sets its level with barstate.isconfirmed, and the manual says "barstate.isconfirmed is true on all historical bars and on the last (closing) update of a realtime bar." So at every close the level becomes that candle's own high and low: on history no break ever prints, and live a break shows only while the candle forms. Its two alert conditions are true only then, so set to once per bar close they never fire.
Three decide on the live candle. LuxAlgo's Breakout Detector, Edthatch21's broken and rejected colours and FXMAFIA20's markers read the forming candle, so what they show can change before it closes. The manual, on a condition read that way: "The problem here is that nothing guarantees this condition will hold true until the end of the realtime bar." FXMAFIA20's signal reads the previous candle's close, but its volume average includes the forming candle, so a marker can show at a candle's open and go as its volume grows. The touch alerts, Ufonose's Instant default, outofoptions' sweep and KikeAOR's, fire on the live candle by design: they say price got there, not where it closed.
The best free one
For the previous hour's high and low: Ufonose's Custom Previous High/Low + Breakout Alerts. It reads the last closed hour in the manual's form, can make its alert wait for a 15-minute close whatever your chart's timeframe, and stops after one alert per level. If you only want the lines, belangoren's Previous Hour High and Low and elvisnocoin's HTF Previous Candle High/Low are short scripts built on the same call. For your chart's own previous candle, Cogax's labels or one line of Pine (below) do it. For a stop and a target drawn on the chart, LuxAlgo's Breakout Detector, with its live-candle marks and non-commercial licence in mind. We tested none of them for results.
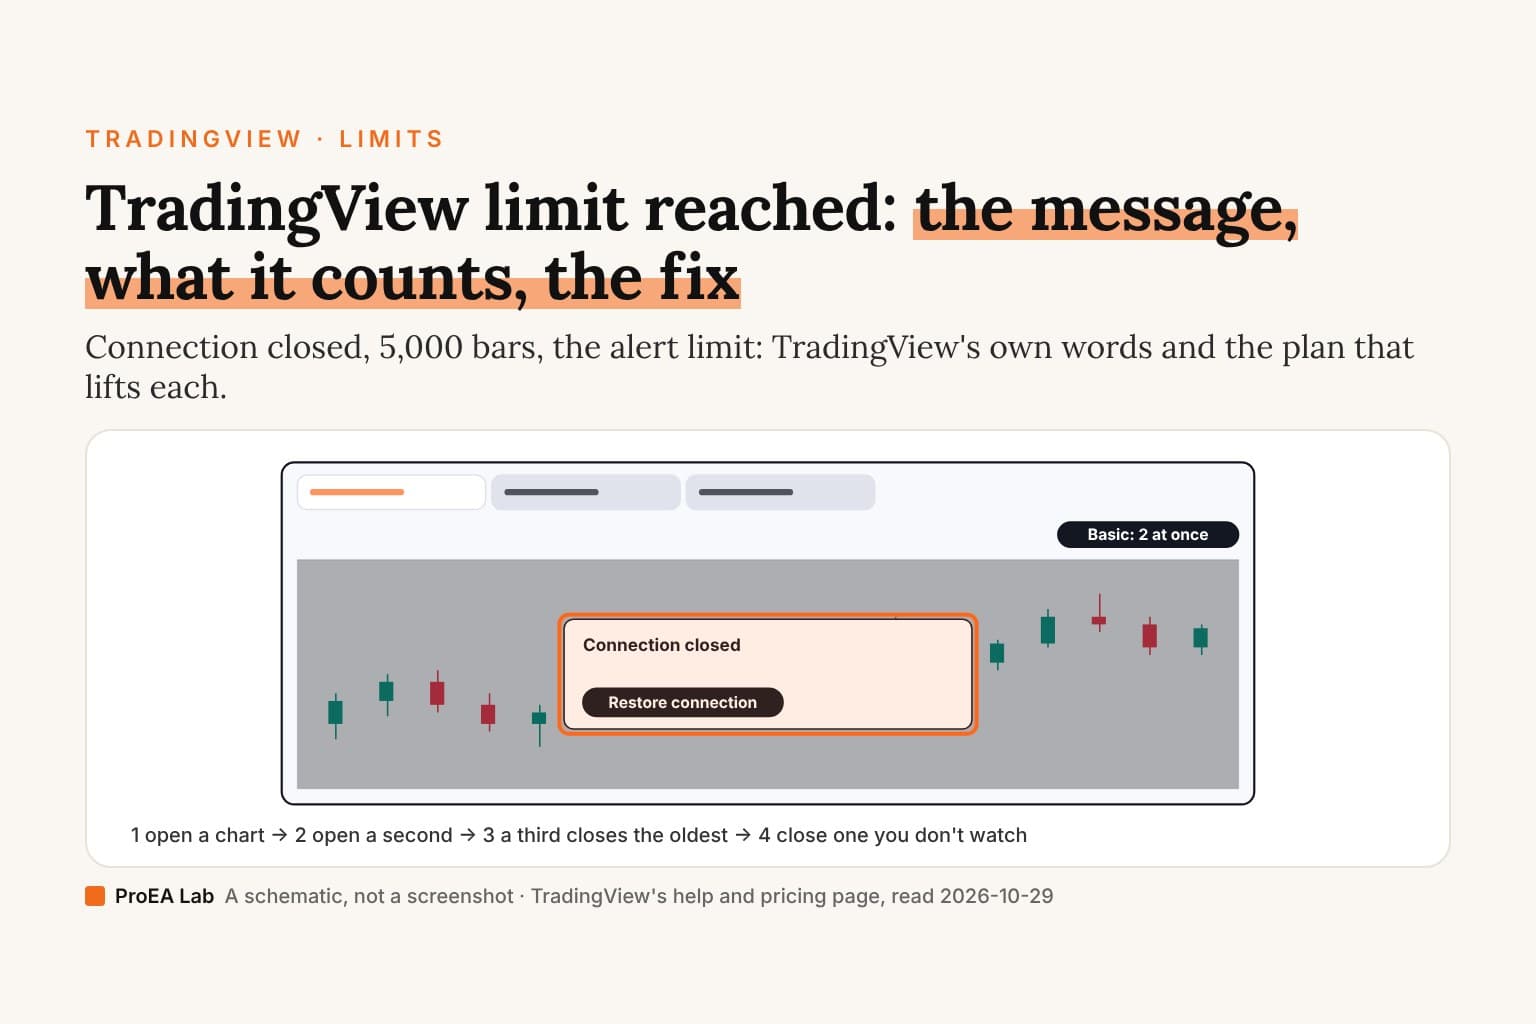
Alerts need a paid plan. Every alert above is a technical alert on an indicator. TradingView's pricing page, read on 29 October 2026, lists "Active technical alerts on indicators, strategies, and drawings" as ✗ on Basic, 20 on Essential, 100 on Plus, 400 on Premium and 1,000 on Ultimate. So the free plan runs these scripts but can't alert you when they fire. When you set one, TradingView's alert dialog offers "only once, every time, once per bar close, or once per minute"; for a script that reads the live candle, once per bar close is the one that can't fire on a candle that later changes.
Which hour is the previous hour?
The scripts that ask for the "60" timeframe read TradingView's 1-hour candle, and TradingView starts its candles at the session's open. Its help page: "On a 45-minute chart of META, candles start at 9:30, 10:15, 11:00, and so on." On a market that trades through the hour, that is the clock hour. On an NYSE stock, whose "Core Trading Session: 9:30 a.m. to 4:00 p.m. ET" is in NYSE's own hours, the hours run from 9:30, and on NSE, which lists "Normal / Odd lot market Open 09:15 hrs", from 9:15 India time. Range Verdict Desk (below) reads the clock hour in UTC instead, so on those markets the two are different hours.
The previous hour's high and low in Pine Script
TradingView has no built-in previous-hour line. Its Pivot Points Standard reads the previous period's high and low, but its help page says: "All available timeframes are daily or higher." So the previous hour takes a script, and the Pine manual gives the form:
"One can ensure higher-timeframe data requests only return confirmed values on all bars, regardless of bar state, by offsetting the expression argument by at least one bar with the history-referencing operator [] and using barmerge.lookahead_on for the lookahead argument in the request.security() call"
It also warns that the two halves go together: "The [1] offset to the series and the use of lookahead = barmerge.lookahead_on are interdependent. Neither can be removed without compromising the integrity of the function."
Here's why. The manual's own demo asks for an hour's high three ways, and this film plays the three on one simulated hour, live and then after a reload. Each frame prints the sentence of the manual it shows.
Simulated 15-minute candles and illustrative prices, not market data. Lines are drawn over the live hour only; the previous hour's box is the same on all three.
Read as text
- Simulated 15-minute candles, UTC, on a market that trades through the hour. The previous hour, 09:00 to 10:00, has a high of 100.90 and a low of 100.05: the range Range Verdict's engine reads as the prior complete UTC hour. Three indicators ask TradingView for its high: a plain request.security() call, the same call with lookahead_on, and the manual's pattern, [1] with lookahead_on. Pine manual (Other timeframes and data): "When requesting data from a higher-timeframe (HTF) context, the lookahead value determines whether the request.*() function can return values from times beyond those of the historical bars it executes on."
- 10:00, live. Calls 1 and 2 both draw the high the 10:00 candle has made so far (100.66 by its close), not the previous hour's 100.90. Call 3 draws 100.90. Pine manual (Other timeframes and data): "On realtime bars, the plot of the series without lookahead (blue) and the series with lookahead and no historical offset (fuchsia) show the same value (i.e., the HTF period’s unconfirmed high price), as no data exists beyond those points to leak into the past."
- In the 10:30 candle price trades above 100.90 and closes at 101.10. Calls 1 and 2 rise with it to 101.22, the high so far, so no candle can close above them. Call 3 stays at 100.90, and the close is above it. Pine manual (Other timeframes and data): "When executing on realtime bars, it returns recalculated values on each chart bar, similar to how a script recalculates values in the main context on the open chart bar."
- At 11:00 the hour closes with a high of 101.22. Live, calls 1 and 2 drew 100.66, 100.79, 101.22, 101.22. Call 3 drew 100.90 throughout, and the 10:30 and 10:45 candles closed above it. Pine manual (Other timeframes and data): "However, the function only confirms the requested values when a bar from its context closes."
- Then the chart reloads, and the four live candles become history. Pine manual (Other timeframes and data): "When the script restarts, what were previously realtime bars become historical bars."
- Call 1, after the reload: 100.90, 100.90, 100.90, 101.22. The line moved, and a close above it appears at 10:30, a break the live chart never showed. Pine manual (Other timeframes and data): "The series requested using barmerge.lookahead_off has a new historical value at the end of each HTF period…"
- Call 2, after the reload: 101.22 on every candle from 10:00, though price only reached it in the 10:30 candle. No close is above it. Pine manual (Repainting): "When request.security() is used with lookahead = barmerge.lookahead_on to fetch prices without offsetting the series by [1], it will return data from the future on historical bars, which is dangerously misleading."
- Call 3, after the reload: 100.90, 100.90, 100.90, 100.90, the same as live, with the same closes above it at 10:30 and 10:45. Two closes in a row above the previous hour's high is what Range Verdict's Accept counts: its engine counts 2 here. Pine manual (Other timeframes and data): "The series that uses lookahead and a historical offset (aqua) does not repaint its results, because it always uses the last confirmed value from the higher timeframe."
How this window was chosen: The three calls are the Pine manual's own lookahead demo, asking for the previous hour's high on a 15-minute chart. The previous hour (high 100.90, low 100.05) is what Range Verdict's engine reads as the prior complete UTC hour on these candles, and the live hour's high (101.22) is the range it confirms at 11:00. The market trades through the hour, so TradingView's 1-hour candle and the UTC hour are the same hour. Each quote is word for word, read 2026-10-30.
What the three calls do:
- A plain call (lookahead off, the default) gives the hour that is still forming on a live chart, so a "previous hour high" drawn live is this hour's high so far, and price can never close above it. After a reload it gives the previous hour again, until the hour's last candle. The line moves.
lookahead_onwithout[1]gives the same forming hour live, and after a reload the hour's final high from its first candle: in the film, 101.22 from 10:00, though price only got there at 10:30. The manual: "When request.security() is used with lookahead = barmerge.lookahead_on to fetch prices without offsetting the series by [1], it will return data from the future on historical bars, which is dangerously misleading."[1]withlookahead_ongives the last closed hour, 100.90 in the film, live and after a reload: "it always uses the last confirmed value from the higher timeframe."
A small example in that form. We compiled it on TradingView's own compiler on 30 October 2026: no errors, no warnings. Paste it into the Pine Editor and add it to a chart whose timeframe is under an hour, a 15-minute chart for example.
//@version=6
// This Pine Script™ code is subject to the terms of the Mozilla Public License 2.0 at https://mozilla.org/MPL/2.0/
// © ProEA
//
// Previous High/Low Example: the last closed candle's high and low from the timeframe you pick, asked for the way
// TradingView's Pine manual gives for confirmed higher-timeframe values: [1] inside request.security(), with lookahead
// on. "60" draws the previous hour (TradingView's 1-hour candle), "D" the previous day, your chart's own timeframe the
// previous candle. It draws two lines and nothing else: no signal, no stop, no alert. An example to learn from.
indicator("Previous High/Low Example", overlay = true)

string tf = input.timeframe("60", "Previous candle of")

// [1] asks for the last closed candle of tf, and lookahead on hands it over from the first chart candle after it
// closed. Drop the [1] and history shows each hour's high before it happens; drop the lookahead and the lines move
// when the chart reloads.
[prevHigh, prevLow] = request.security(syminfo.tickerid, tf, [high[1], low[1]], lookahead = barmerge.lookahead_on)

plot(prevHigh, "Previous high", color.teal, 2, plot.style_stepline)
plot(prevLow, "Previous low", color.red, 2, plot.style_stepline)
What each part does:
input.timeframe("60", …)is the setting: 60 is the previous hour, D the previous day, W the previous week.[high[1], low[1]]asks for both values in one call.[1]is one candle back on the requested timeframe: the last one that has closed.lookahead = barmerge.lookahead_onhands that closed value over from the first chart candle of the new hour. Without the[1], the same setting would hand over the hour that hasn't happened yet.plot.style_steplinedraws each value as a flat step, so the line jumps once an hour.
It's the previous hour as TradingView builds it, so on an NYSE stock it is 9:30 to 10:30, not a clock hour.
Previous candle and previous day high low in Pine Script
On your chart's own timeframe you don't need request.security(). The manual's history-referencing operator does it: "The value used inside the square brackets of the operator is the offset in the past we want to refer to." So high[1] and low[1] are the previous candle's high and low, low[1] alone is the previous candle's low, and high[2] is the candle before that, the one MSAProTrader's script draws. They come from candles that have closed, so they don't repaint.
For the previous day, set the example's timeframe to D: it then asks for request.security(syminfo.tickerid, "D", high[1], lookahead = barmerge.lookahead_on) and the same for the low. That's TradingView's daily candle, so the day follows the symbol's session. The other safe route is the one Algoryze's and SpxGh0st's scripts take: track the high and low from the chart's own candles while the period runs, and keep them when it ends.
Range Verdict Desk, ours
We build and sell Range Verdict Desk. It isn't in TradingView's search: its full Pine v6 source comes in Pine Pro Library, $49 once for every desk and every update. Its page puts it in one line: "It reads every 15-minute close against the last UTC hour's range and, on two closes beyond it in the New York morning, freezes one plan: a stop of at least 1 ATR and a 2R objective."
It takes the previous hour without a request.security() call: it builds the previous complete UTC hour from four 15-minute candles on your chart and decides on closed candles, so there's nothing to look ahead with. Where the scripts above stop at the level, it adds a rule:
- Accept, the default: two closes in a row beyond the same side, inside the current hour. Fade: a wick through one side and a close back inside; through both sides is no signal.
- One attempt an hour, inside one of four New York windows, 08:00 to 12:00 by default, following daylight saving.
- A frozen plan: the stop one risk behind the signal close, the risk being the larger of 1 ATR(14) and the distance to the range's edge (the candle's wick, for Fade); the objective at 2R; the entry at the next open. It ends at the stop, at the objective (the stop when one candle touches both), or at the window's end.
- Two alert conditions, one per side, when a plan is confirmed. Like every alert here, they need Essential or above.
In the film, call 3's two closes above the previous hour's high, at 10:30 and 10:45, are what Accept counts.
Its limits, in its own terms: only the previous complete UTC hour, which on an NYSE stock isn't TradingView's 1-hour candle; standard 15-minute candles only, and any other chart stops with an error; one attempt an hour; one New York window at a time; and a plan, not an order: it places no orders. We make no promise of results.
Range Verdict Pro runs the same engine unchanged, so on the same chart and settings it confirms the same plans. It adds the game plan on your chart before and during the New York window, each plan with its size for your risk, plain-English alerts (Essential or above, like every alert here), a Radar that reads the same rule on eight markets on one board, and a strategy in which a confirmed plan submits a qty 1 simulated entry in TradingView's Strategy Tester. It places no orders either. It is $49 once, or in the Complete Suite, and we build and sell it too.
Library desk · plan alerts
Prior UTC range visible. Last close: Outside NY 08:00-12:00.
Range Verdict Pro · indicator · Radar · strategy
Both candidate levels drawn and explained, with a configurable heads-up alert.
Starts at 4.00, the risk in the 1 hour candle strategy post's worked plan. A wider stop means a smaller size for the same risk.
07:45 New York: the same plan, more on Pro's screen
Range Verdict Pro at your risk: ≈ 25 units · nominal 100 USD risk at signal close.
What each one shows, in the Pro page's own words (its "Library desk or Pro" comparison of one simulated morning). The same simulated morning on both screens. The plan is the same on both sides. The size line is Pro's own formula, risk ÷ (stop distance × point value), with an example point value of 1 USD. Uses symbol point value. Check broker contract and lot rules. No currency conversion; gaps and costs can change actual risk. Alerts on TradingView need a paid plan: its pricing page (read 29 October 2026) shows no technical alerts on indicators on Basic and 20 or more from Essential up.
Check one yourself
- Find the request. Search the code for
request.security.[1]withlookahead_onreads the last closed candle. No offset with lookahead off, the default, reads the forming candle on a live chart.lookahead_onwith no[1]reads the future on history. No//@versionline at the top means Pine version 1. - Find the close. Look for
barstate.isconfirmedbefore a mark or an alert. Without it, the mark is decided on the live candle. As the only check on the level, as in samb817's, it means a break can't last to the close. - Count the brackets.
high[1]is the previous candle;high[2]is the one before it. - Watch an hour. Let an hour close on a live chart, note where the line is, and reload the chart. If the line moved, it repaints. How to tell if an indicator repaints has the full check.
Every script here is Pine Script and runs only on TradingView. For what a level is worth once price breaks it, see the breakout trading strategy explainer.
Limits
One code read, on 30 October 2026, of the versions TradingView served that day. Scripts change, and boosts measure popularity, not quality. The film runs simulated candles, not market data, and the Pine example is an example to learn from, not a strategy. We build and sell Range Verdict Desk, and we have no relationship with any author named here. Nothing here is financial advice.
Use this animation on your site.
Frequently asked questions
What is the best previous candle high low indicator on TradingView?
For the previous hour, free, in our read: Custom Previous High/Low + Breakout Alerts by Ufonose (399 boosts). It reads the last closed candle of any timeframe, 1 hour by default, in the form TradingView's Pine manual gives for confirmed values, so its lines don't move on reload, and it can alert once per level when a 15-minute candle closes beyond one. It draws no stop and no target. For the chart's own previous candle, the most boosted is Previous Candle High and Low by Cogax (660 boosts): two price labels.
Is there an hourly high low indicator for TradingView?
Not built in: TradingView's Pivot Points Standard reads only daily or higher timeframes. Among free scripts, Previous Hour High and Low by belangoren (105 boosts) and HTF Previous Candle High/Low by elvisnocoin (61) draw the last closed hour's high and low in the safe form, and Ufonose's script adds alerts. LuxAlgo's Previous Highs & Lows (6,134) has an Hour setting and shows the last 4 hours.
Does a previous candle high low indicator repaint?
It depends on how it asks for the level. Scripts that use request.security() with [1] and lookahead on, or build the level from the chart's own closed candles, don't. A plain request.security() call, as in PriceCatch's Previous Hour Range, draws the forming hour on a live chart and something else after a reload. Lookahead on without [1], as in sbtnc's previous-day lines and Edthatch21's Live 1H mode, or Pine version 1, as in AutoTrader1645's 4h and 1h High/Low, shows a high on history before price made it.
How do I get the previous candle high and low in Pine Script?
On the chart's own timeframe, high[1] and low[1]: the number in the brackets is how many candles back, so low[1] is the previous candle's low. For another timeframe, ask request.security() for the last closed candle: request.security(syminfo.tickerid, "60", high[1], lookahead = barmerge.lookahead_on) is the previous hour's high, the form the Pine manual gives for values that don't repaint. Drop the [1] or the lookahead and the line shows the future on history or changes after a reload.
How do I plot the previous day high and low in Pine Script?
The same call with "D": request.security(syminfo.tickerid, "D", high[1], lookahead = barmerge.lookahead_on), and the same with low[1]. The compiled example on this page takes the timeframe as a setting, 60 by default; set it to D and it draws the previous day's high and low.
Do previous high low alerts work on TradingView's free plan?
No. TradingView's pricing page, read on 29 October 2026, shows no technical alerts on indicators, strategies or drawings on Basic, 20 on Essential, 100 on Plus, 400 on Premium and 1,000 on Ultimate. The scripts themselves run on any plan.
Which previous hour indicator does ProEA make?
Range Verdict Desk, in Pine Pro Library ($49 once for every desk, with the full Pine v6 source). It draws the previous complete UTC hour's high and low from four 15-minute candles and reads each closed 15-minute candle against them: two closes in a row beyond one side by default, or a wick through one side and a close back inside. One attempt an hour, inside a New York window, and a frozen plan with a stop of at least 1 ATR and a 2R objective. It places no orders, and we make no promise of results.