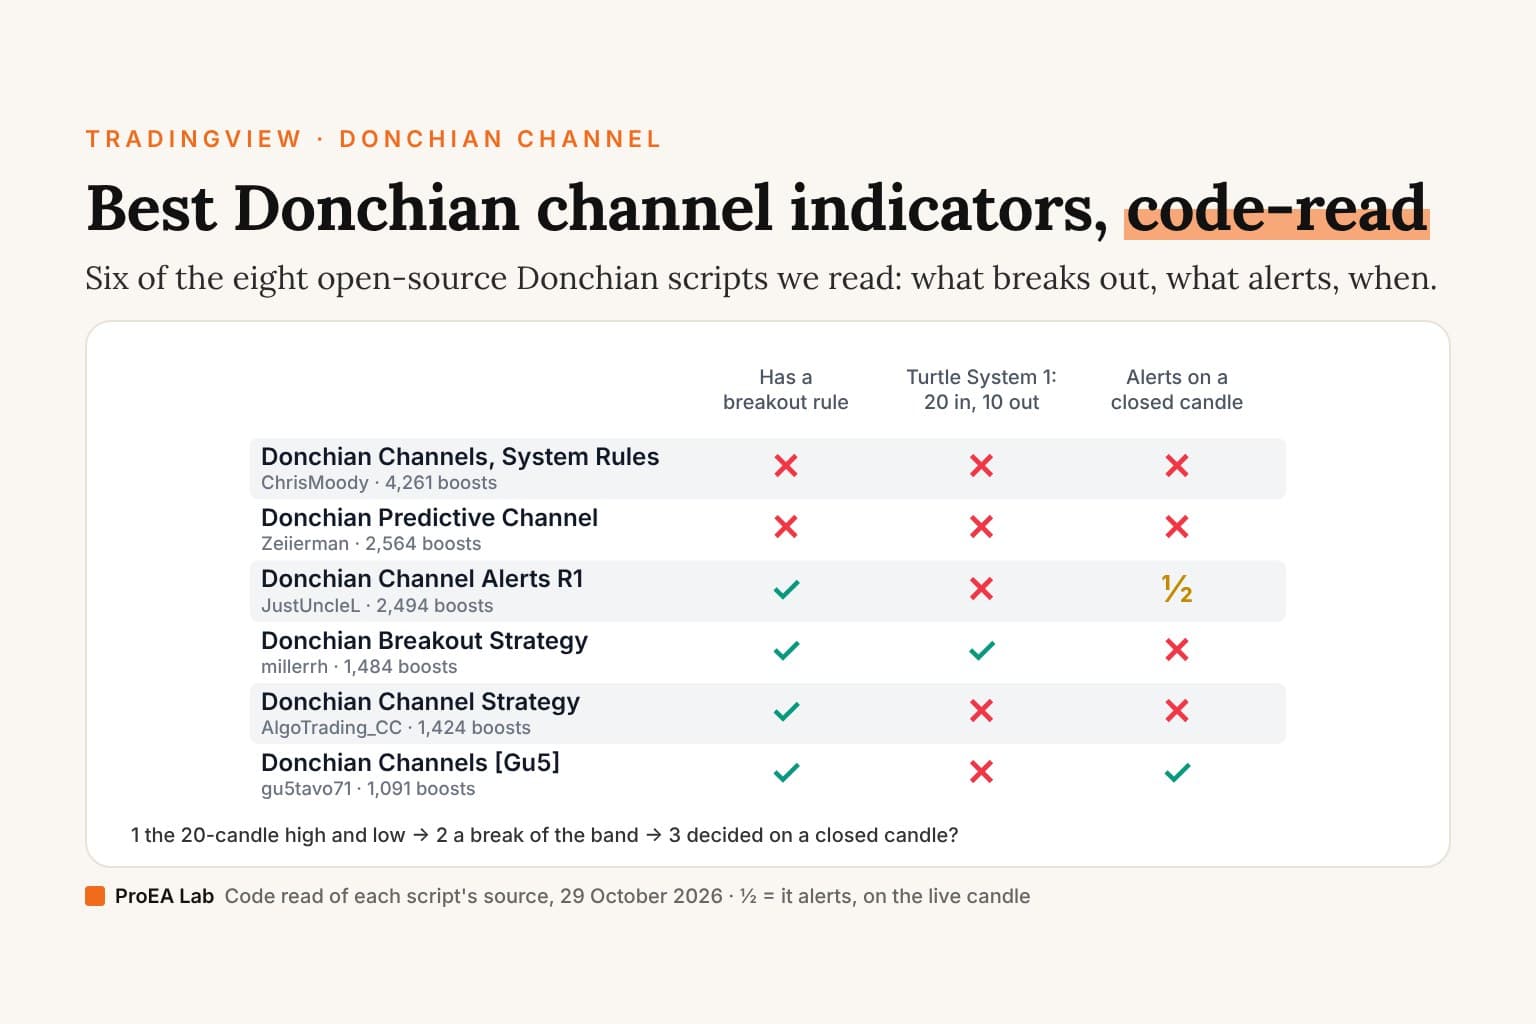
Short answer: TradingView's built-in Donchian Channels draws the classic channel, the 20-period high, the 20-period low and the line halfway between, and no buy or sell signal. Of the open-source scripts, the one closest to the Turtle Traders' System 1 is millerrh's Donchian Breakout Strategy (1,484 boosts): 20 candles in, 10 out, a buy-stop order at the 20-candle high and 0.1% commission by default. The most-boosted, ChrisMoody's (4,261 boosts), draws a 4-candle high and a 60-candle low and prints no signal at all. None of the eight we read reads a future candle; what separates them is what they call a breakout, and when they decide it.
Most lists name Donchian indicators.
This one reads them.
How the channel itself works, and why 20 and 10, is in the Donchian channel strategy, explained. This post is about the scripts.
What we checked
We searched TradingView's scripts for eight terms on 29 October 2026 ("breakaway gap", "breakaway fvg", "breakaway fair value gap", "fvg breakout", "donchian channel", "donchian breakout", "crypto trend following" and "displacement fvg"), which returned 98 scripts. 66 have Donchian in their name, and 55 of those are open source. We took the seven most-boosted of the 55, down to 1,091 boosts, with none skipped, and one more strategy, Greg_007's (372 boosts), whose title promises a backtest. Then we read every line that draws a band or decides a signal. Six questions:
- The bands: which prices, how many candles, and is the live candle one of them?
- The breakout: a close beyond the band, a wick through it, or something else?
- When it decides: on a closed candle, or on the live one?
- Repainting: does it read another timeframe or a future candle, or draw something back in time?
- Alerts: what can it send you?
- Strategies: what does it trade, and with what costs?
We add TradingView's own Donchian Channels, from its Help Center page, and one protected script, DashTrader's Crypto Turtle, from its page: its code is closed, so we can't read it.
One thing all eight share: their bands are the highest high and the lowest low of the last n candles, the live one included (highest(high, n), not highest(high, n)[1]). The live candle's high is always inside its own upper band, so a close can never be above it. A breakout has to be measured against the previous candle's band, or seen as the band itself rising, or caught by a stop order resting at the band. Which of those a script does is most of what separates them. StockCharts' version of the same channel leaves the live candle out: "Price Channels are based on prices prior to the current period."
The table
Boosts as TradingView's search showed them on 29 October 2026. "20-candle high" is the highest high of the last 20 candles, the live one included.
| Script | Boosts | The bands, by default | The breakout | Decides on | Alerts |
|---|---|---|---|---|---|
| Donchian Channels (TradingView's built-in) | — | 20-period high, 20-period low, the line halfway | None: three lines | — | — |
| Custom Indicator for Donchian Channels!!! System Rules Included! (ChrisMoody) | 4,261 | 4-candle high, 60-candle low, their average | None: three lines | — | None |
| Donchian Predictive Channel (Zeiierman) | 2,564 | 20-candle high, low and average; a 30-candle forecast cone | Not a breakout: a new 20-candle high or low that fails to extend | The live candle | None |
| Donchian Channel Alerts R1 by JustUncleL | 2,494 | 30-candle high, low and average; EMA(8) | A close back above the mid-line, or two highs in a row above the last candle's band; and a close above EMA(8) | The live candle | Buy, Sell, and an exit for each |
| Donchian Breakout Strategy (millerrh) | 1,484 | 20-candle high, 10-candle low | A buy-stop at the 20-candle high (a wick); a close, as an option | Orders set at each close, and again after each fill | None of its own |
| Donchian Channel Strategy [for free bot] (AlgoTrading_CC) | 1,424 | Long: 10-candle high; short: 20-candle low | Stop orders at the band (a wick) | Orders set at each close | None of its own |
| Donchian Channel - Pivot High-Low (Trendoscope) | 1,235 | 20-candle high and low, held at the last confirmed swing | None: lines and swing labels | — | None |
| Donchian Channels [Gu5] (gu5tavo71) | 1,091 | 20-candle high, low and average | A high above the previous 20 candles' high (a wick) | Alerts: closed candles; colours: the live candle | Long, Short, two exits, any |
| Donchian Channels strategy with backtest (Greg_007) | 372 | 20-candle high, low and average | Two new 20-candle highs in a row (a wick); reverses on two new lows | Live: every tick; backtest: each close | None of its own |
| Crypto Turtle - Trend Following Strategy (DashTrader) | 3,152 | Protected: we can't read it | — | — | — |
Three of the eight are strategies, and their costs are whatever their strategy( line sets:
| Strategy | Trades | Size, by default | Commission | Slippage | Tested from |
|---|---|---|---|---|---|
| millerrh | Long only | 100% of equity; 100,000 USD of capital | 0.1% per order | None | 1 January 2019 |
| AlgoTrading_CC | Long and short, a 2.5% target on each | 20% of equity; 1,000 of capital | 0.036% per order | None | 2005 |
| Greg_007 | Always long or short | 10% of equity; 10,000 of capital | None | None | The chart's whole history |
None of the three has a stop based on ATR, and none charges slippage. Two of the eight alert on their own, JustUncleL's and gu5tavo71's, and only gu5tavo71's alerts wait for the candle to close.
What the code says
TradingView's built-in Donchian Channels is the reference. Its Help Center page gives the formula: "Upper Channel = 20 Day High", "Lower Channel = 20 Day Low", "Middle Channel = (20 Day High + 20 Day Low)/2". It has two inputs, Length ("20 is the Default") and Offset ("0 is the default"), and says it "simply takes a user defined number of periods (20 Days for example) and calculates the Upper and Lower Bands". It calls the indicator a volatility measure: "Donchian Channels (DC) are used in technical analysis to measure a market's volatility." Three lines, no signals. The page doesn't say whether the live candle counts.
ChrisMoody's draws a different length on each side. It is Pine v1 (it has no version line). The upper band is the highest high of 4 candles, the lower band the lowest low of 60, and the mid-line their average, all counting the live candle. Its page describes it as an "INDICATOR - Donchian Channel that allows you to pick different Periods for the Upper and Lower Band." The "system rules" of its title are in its comments, not its code: when you expect a big move up, set a short upper length (3 or 4) and a long lower one (40 to 100) and use the lower line as the stop; in a long, take partial profits at the mid-line and move the stop to break even, unless the lower line rises above the entry first, in which case the lower line is the stop. It prints no signal and sends no alert, and its code carries no licence line.
Zeiierman's Donchian Predictive Channel marks fades, not breakouts. The bands are the 20-candle high, low and average. A down triangle marks a candle whose high stays under the 20-candle high right after the candle before set it, with the close still above the mid-line; an up triangle mirrors that at the low. Any triangle needs 20 candles since the last one, filter or not. With "Filter Signals" on, the default, a down triangle also needs the close below the 100-candle simple average and an up triangle needs it above. So an up triangle is a new 20-candle low that didn't go lower, in a market above its 100-candle average: a pullback buy. The "predictive" part runs on the last candle only. It draws a 30-candle cone ahead of price: the mid-line extended along the slope of its 20-candle linear regression, the width along the slope of the width's, stepped every 10 candles. Its page says it "projects where the Donchian mid, high, and low boundaries are statistically likely to move based on recent directional bias and volatility regime"; in the code, that is the two slopes. The cone is deleted and redrawn on every new candle, so there's no record of what it forecast. Triangles are decided on the live candle, and there are no alerts. Pine v6, CC BY-NC-SA 4.0.
JustUncleL's alerts trade the mid-line. The channel is 30 candles, not 20, and its page says it "combines the Donchian Channel centre line price action with a directional coloured EMA (default length 8) to provide entry and exit signals." A buy needs a green candle, a close above EMA(8), and one of two things: a fresh close above the previous candle's mid-line (at least one of the two candles before it closed at or below theirs), or a high above the previous candle's 30-candle high for the second candle running. Sells mirror it. The EMA's colour is decoration: the signal only asks whether the close is above it. A trade exits, by default, on the first close back below EMA(8); "Cross Centre" and "Brick Colour" are the other two exits. Four alerts: Break BUY, Break SELL and an exit for each. Everything is decided on the live candle, so an arrow can print and vanish before the close. Its comments suggest Renko or Heikin Ashi charts. Pine v3, no licence line.
millerrh's Donchian Breakout Strategy is the Turtle System 1 shape. Its page: "This strategy buys when the Donchian Channel is broken to the upside and uses the lower Donchian Channel line as a trailing stop." The upper band is 20 candles, the lower 10. With "Execute Trades On..." at Wick, the default, it rests a buy-stop order at the 20-candle high and a sell-stop at the 10-candle low, both set at each close for the next candle, so it buys the moment price trades through the high. Set it to Close and it buys on a close at or above the previous candle's 20-candle high, and sells on a close at or below the previous candle's stop line. Long only. A tighter 8-candle stop until the trade is in profit, moving-average filters on the chart's timeframe and a higher one, and a filter that skips a setup when the channel, as a share of price, is wider than 120% of the 21-day average daily range are all there, all off by default. The daily values come through request.security with no lookahead argument, so lookahead is off: no future candle. One quirk: its last line cancels the pending buy order on any candle where the 5-day average stops rising, even with that filter off, so there's no buy order on the next candle. Its strategy( line sets 100,000 USD of capital, 100% of equity per trade and 0.1% commission per order, with no slippage, from 1 January 2019. No alerts of its own. Pine v5, no licence line.
AlgoTrading_CC's strategy caps every winner at 2.5%. Long and short have separate channels: flat, it rests a buy-stop at the 10-candle high and a sell-stop at the 20-candle low. A long exits at the 10-candle channel's mid-line (its low, as an option) or at a 2.5% take-profit; a short at the 20-candle channel's mid-line or 2.5%. That's a breakout entry with a fixed target, the opposite of the Turtle exit, which had none. Its strategy( line sets 1,000 of capital, 20% of equity per trade and 0.036% commission, with no slippage, tested from 2005. No alerts of its own. Pine v4, MPL 2.0.
Trendoscope's channel holds the last swing. Its "Channel Base" is "Combined" by default: the top is the higher of the 20-candle high and the last confirmed swing high (an older, higher swing stays for 20 candles after a newer one replaces it), and the bottom mirrors that with the lows. So after a swing high older than 20 candles, the top stays at it while the plain 20-candle high falls away. Swings are pivots with 2 candles on the left and 4 on the right, and with "waitforclose" on it uses each one a candle after it's confirmed: 5 candles after the swing. The channel uses a swing only from then on, so its history doesn't change, but the HH, HL, LH and LL labels are drawn 5 candles back, on the swing itself: looking back, they appear 5 candles before anyone could know them. No signals and no alerts. Pine v4, MPL 2.0, © HeWhoMustNotBeNamed.
gu5tavo71's Donchian Channels [Gu5] waits for the close to alert. The bands are the 20-candle high, low and average. "Long" is the first candle whose high is above the previous 20 candles' high after the last signal was Short or flat; "Short" mirrors it at the low. With "Close Alert" on, off by default, a close across the mid-line exits to flat. Its five alerts (Any Alert, Long Entry, Short Entry, Long Exit and Short Exit) fire once per bar close, so they are decided on the closed candle. The Long and Short labels, off by default, and the candle colours, on, follow the live candle. The labels sit behind an input called "Alert On/Off", which doesn't switch the alerts. Pine v6, CC BY-NC 4.0.
Greg_007's strategy is always in the market, and its live trades won't match its backtest. It buys when the 20-candle high rose on this candle and on the one before ("Wait for double confirmation?", on by default). With "Include short positions" on, also the default, it reverses short when the 20-candle low falls twice in a row, so after the first signal it is always long or short, with market orders. Its strategy( line sets 10,000 of capital and 10% of equity per trade, no commission and no slippage, and calc_on_every_tick=true. On a live chart it runs on every price change and enters mid-candle the moment the second new high prints; its backtest checks only at each close and fills at the next candle's open. A high, once made, stays, so the signal won't vanish, but the live fill and the backtest's will differ. No alerts of its own. Pine v4, no licence line.
DashTrader's Crypto Turtle is protected. It has 3,152 boosts, more than any open-source Donchian script but ChrisMoody's. Its page: "This represents a bot I have written that uses a heavily modified version of the Turtle strategy for cryptocurrency trading. This is meant to be traded on the 4 Hour candlestick." And: "This script is published as closed-source. However, you can use it freely and without any limitations". It is a strategy, first published on 10 October 2017. We can't read its code, so we can't say what it modified, how it decides or what costs it assumes.
Repainting and the live candle
None of the eight reads a future candle. None uses lookahead_on, and the only request.security calls, millerrh's daily filters, leave lookahead off. Once a candle has closed, nothing in its bands changes. What still moves:
- The live candle. Every script's upper band rises with the live candle's high. Zeiierman's triangles and JustUncleL's arrows and alerts are decided as the candle forms, so they can print and vanish before the close; setting an alert to fire once per bar close is the workaround. gu5tavo71's alerts already wait.
- Drawn back in time. Trendoscope's swing labels sit on the swing, 5 candles before they were known.
- Drawn forward and thrown away. Zeiierman's cone is redrawn on every candle; yesterday's forecast isn't on the chart.
- Strategies. millerrh's and AlgoTrading_CC's stop orders rest at levels known at the previous close, and fill when price touches them. millerrh's
strategy(line also setscalc_on_order_fills=true, so in the backtest it recalculates inside the candle after each fill. Greg_007's runs on every tick live and only at the close in its backtest.
More on telling them apart in how to tell if an indicator repaints.
Turtle trading strategy on TradingView
The Turtle rules, as the Original Turtles site publishes them in a scanned PDF, use two systems: "System 1 – A shorter-term system based on a 20-day breakout" and "System 2 – A simpler long-term system based on a 55-day breakout." System 1 exits on "a 10 day low for long positions", System 2 on a 20-day low. They entered during the day: "Turtles always traded at the breakout when it was exceeded during the day, and did not wait until the daily close or the open of the following day." The stop was "2 N below the entry for long positions", where N is "the 20-day exponential moving average of the True Range, which is now more commonly known as the ATR". System 1 also skipped a breakout when the last one "would have resulted in a winning trade", and the rules sized every position in Units and added to winners.
None of the eight Donchian scripts has all of that. millerrh's has System 1's 20 and 10 and the intraday stop entry. None has the 2N stop, the Units, adding to winners or the skip-after-a-winner filter. The rules also say: "Most breakouts do not result in trends. This means that most of the trades that the Turtles made resulted in losses."
TradingView's own search for "turtle trading", read the same day, shows only open-source scripts by default. Its most-boosted results are jeanobrega's "Turtle trading strategy (Donchian/ATR)" (1,861 boosts) and fiki's "Turtles Modified Alerts" (1,261). They weren't in the search we code-read, so we haven't read them. Our search did turn up Semtex76's Turtle 20-Day Breakout (Donchian), with 32 boosts.
Not to be confused with turtle soup, which fades a new 20-day high or low instead of following it.
Donchian channel settings
TradingView's default length is 20, and so is StockCharts': "a 20-period Price Channel, which is the default setting in SharpCharts." The MQL5 Code Base's Donchian page says: "Richard Donchian himself recommended to use period 20 to build the Channel. In those days trading was usually conducted on day charts and 20 is exactly an average number of days in a month."
The eight scripts' defaults:
- 20: Zeiierman's, millerrh's upper band, Trendoscope's, gu5tavo71's and Greg_007's.
- Other lengths: ChrisMoody's 4 above and 60 below; JustUncleL's 30; AlgoTrading_CC's 10 for longs and 20 for shorts.
- Exits: millerrh's 10-candle low (8, as the optional tighter stop); AlgoTrading_CC's mid-lines and 2.5% targets.
Nothing in the eight scripts' code tests its defaults, and we tested none of them. Two things follow from the arithmetic alone: a shorter length puts the band nearer price, so price breaks it more often; and an exit length shorter than the entry's, like 10 against 20, gets out sooner than it got in. Which setting suits your market is a question for a test on that market, after costs, on candles you didn't pick the setting on.
Which is the best free Donchian indicator?
It depends on the job:
- The channel, nothing else: TradingView's built-in Donchian Channels.
- The Turtle System 1 shape, as a backtest: millerrh's Donchian Breakout Strategy. It is the only one of the eight whose defaults are 20 in and 10 out, it enters on a stop order at the high, as the Turtles entered during the day, and it charges commission. Before you trust its Strategy Tester, know that it is long only, has no ATR stop, puts 100% of equity in every trade, charges no slippage, recalculates inside the candle after each fill (
calc_on_order_fills=true), and cancels its pending buy whenever the 5-day average stops rising, even with that filter off. - Alerts on a 20-candle breakout: gu5tavo71's Donchian Channels [Gu5], the only one whose alerts wait for the candle to close. Its breakout is a wick, and it has no stop.
The most-boosted, ChrisMoody's, is a channel with two lengths and a rule of thumb in its comments; Zeiierman's, second, signals fades, not breakouts.
Ours
Our free 20/10 breakout script, Donchian Breakout 20/10 in R [ProEA], draws the Turtle System 1 lengths: a 20/10 Donchian breakout with a 2 × ATR stop, on one market at a time, with each trade counted in R. It decides on closed candles and uses highest(high, 20)[1], so a close can break the band. It has no alerts and takes no costs off. Copy the Pine code from this text file and paste it into TradingView's Pine Editor.
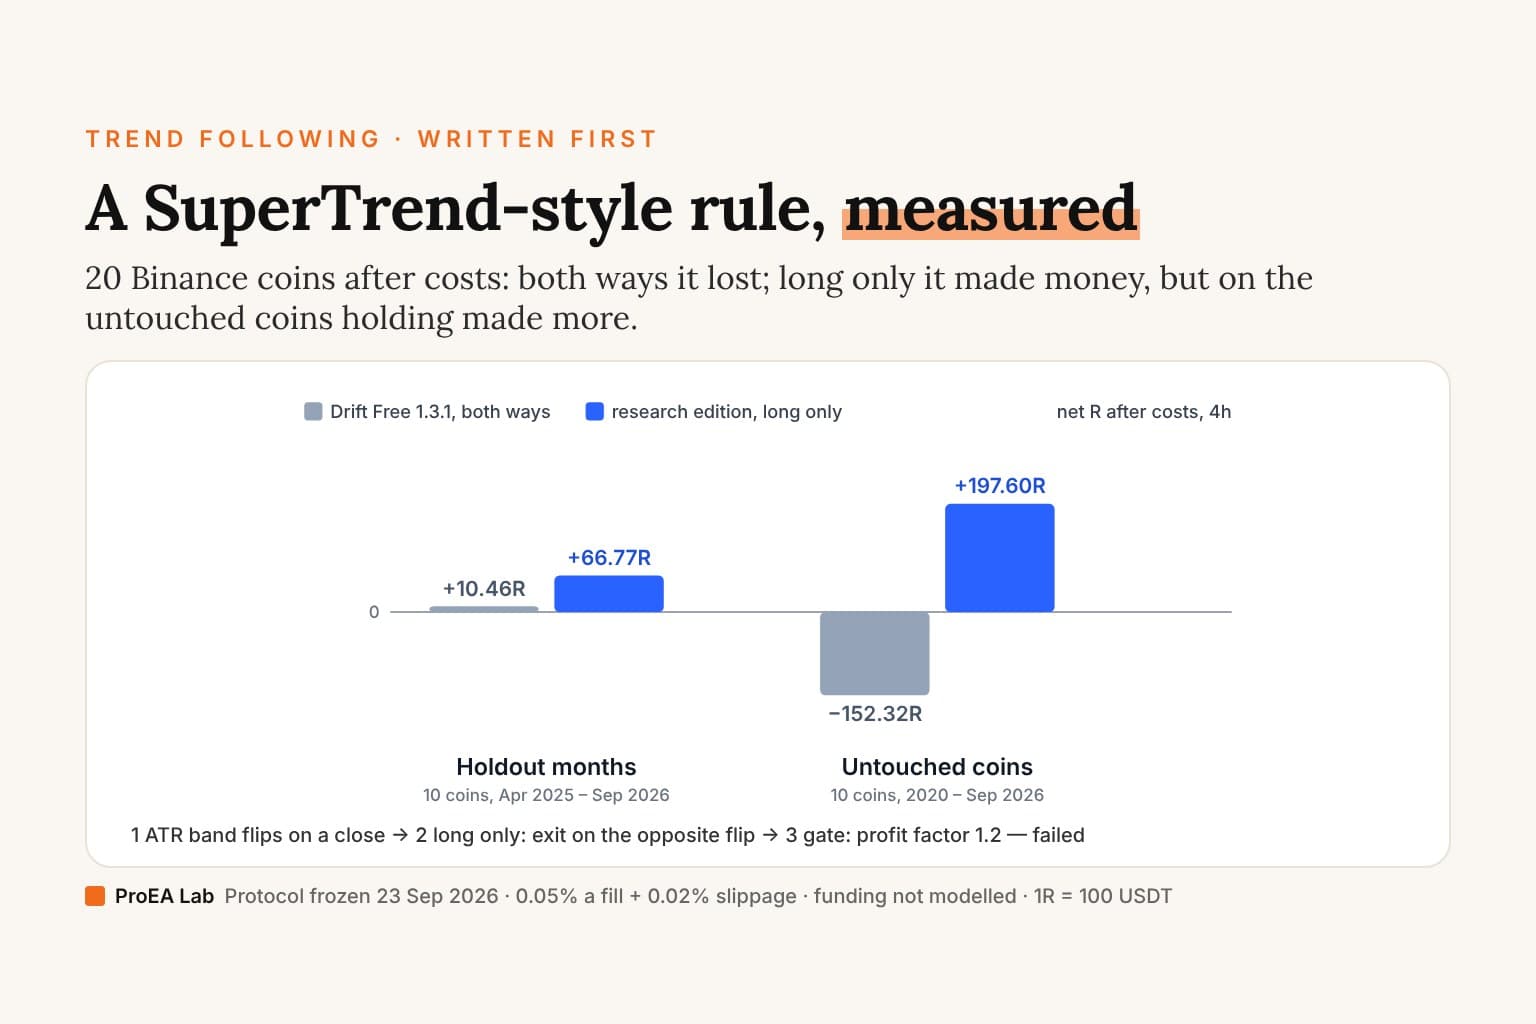
Breakaway Desk Premium, $49 once, runs the same 20/10 rule in its Trend Radar on six crypto perpetuals at 4 hours: a 4-hour close above the 20-candle high, a stop 2 × ATR(20) below, no target, and out on a close below the 10-candle low. It is long only, and one alert covers all six markets, as text or JSON. Unlike the Turtles, it waits for the close. It is the rule its pre-registered test picked, and what that test measured, losing stretches included, is in Does turtle trading still work?: a hypothetical backtest after estimated costs, not a forecast. It never places orders.
Check one yourself
- The band:
highest(high, 20)counts the live candle;highest(high, 20)[1]is the 20 candles before it. - The breakout:
close > upper[1]is a close;high > upper[1],upper > upper[1]orstop = upperon an order is a wick. - The close: look for
barstate.isconfirmedoralert.freq_once_per_bar_close. A strategy decides at the close unless itsstrategy(line sayscalc_on_every_tick = true;calc_on_order_fills = trueadds a recalculation after each fill. - The future: search for
lookahead,security(andoffset = -. Alookahead_onwithout[1]on the value reads a higher-timeframe candle before it closes, and a negative offset draws a value before it was known. - The costs: look for
commission_valueandslippageon thestrategy(line. When they're missing, the Strategy Tester charges nothing unless you enter them in its properties.
None of these runs on MT5 or MT4: they are written in Pine Script, TradingView's own language.
Limits
One code read, on 29 October 2026, of the versions TradingView served that day. Scripts change, and boosts measure popularity, not quality. We tested none of the eight. We build and sell Breakaway Desk Premium, and we have no relationship with any author named here. Nothing here is financial advice.
Frequently asked questions
What is the best Donchian channel indicator on TradingView?
For the plain channel, TradingView's built-in Donchian Channels: the 20-period high, the 20-period low and the line halfway between. For the Turtle System 1 shape, start with millerrh's Donchian Breakout Strategy (1,484 boosts): 20 candles in, 10 out, a buy-stop order at the 20-candle high and 0.1% commission by default. It is long only, has no ATR stop and charges no slippage. For alerts on the channel, gu5tavo71's Donchian Channels [Gu5] sends its alerts once per bar close. We tested none of them.
Does TradingView have a built-in Donchian channel indicator?
Yes. TradingView's Donchian Channels draws an upper band at the period's highest price, a lower band at its lowest, and a middle line halfway between. Its two inputs are Length, 20 by default, and Offset, 0 by default. It draws the three lines and no buy or sell signal.
Is there a turtle trading indicator on TradingView?
Several scripts use the name, but none of the eight Donchian scripts we read has all the Turtle rules. millerrh's Donchian Breakout Strategy comes closest: System 1's 20-candle entry and 10-candle exit, with a stop order at the high, as the Turtles entered during the day. None of the eight has the 2N stop, the unit sizing, adding to winners or the skip-after-a-winner filter. The most-boosted result in TradingView's turtle trading search, jeanobrega's Turtle trading strategy (Donchian/ATR) with 1,861 boosts, wasn't in our code read.
What is the Crypto Turtle strategy on TradingView?
DashTrader's Crypto Turtle - Trend Following Strategy, with 3,152 boosts on 29 October 2026. Its page calls it a bot that uses a heavily modified version of the Turtle strategy for cryptocurrency, meant for 4-hour candles. Its code is protected, so we can't say what it changed, how it decides or what costs it assumes.
What are the best Donchian channel settings?
No setting is best on every market, and we tested none. TradingView's and StockCharts' default is 20. The Turtle rules used 20 to enter and 10 to exit in System 1, and 55 and 20 in System 2. The eight scripts' defaults run from a 4-candle upper band to a 60-candle lower band, both ChrisMoody's, and 20 is the most common. A shorter length puts the band nearer price, so price breaks it more often.
Does the Donchian channel repaint?
Not on closed candles, in the eight scripts we read: none reads a future candle. But each counts the live candle in its bands, so the upper band rises with the live candle's high, and a signal decided on the live candle can print and vanish before the close. Two draw things to know about: Trendoscope's swing labels sit 5 candles before they were known, and Zeiierman's forecast cone is redrawn on every candle and never kept.
Which Donchian breakout tool does ProEA make?
Two. A free TradingView script runs the 20/10 breakout with a 2 × ATR stop on one market and counts each trade in R. Breakaway Desk Premium, $49 once, runs the same 20/10 rule in its Trend Radar on six crypto perpetuals at 4 hours, with one alert for all six. Its test is a hypothetical backtest after estimated costs, not a forecast, and it never places orders.