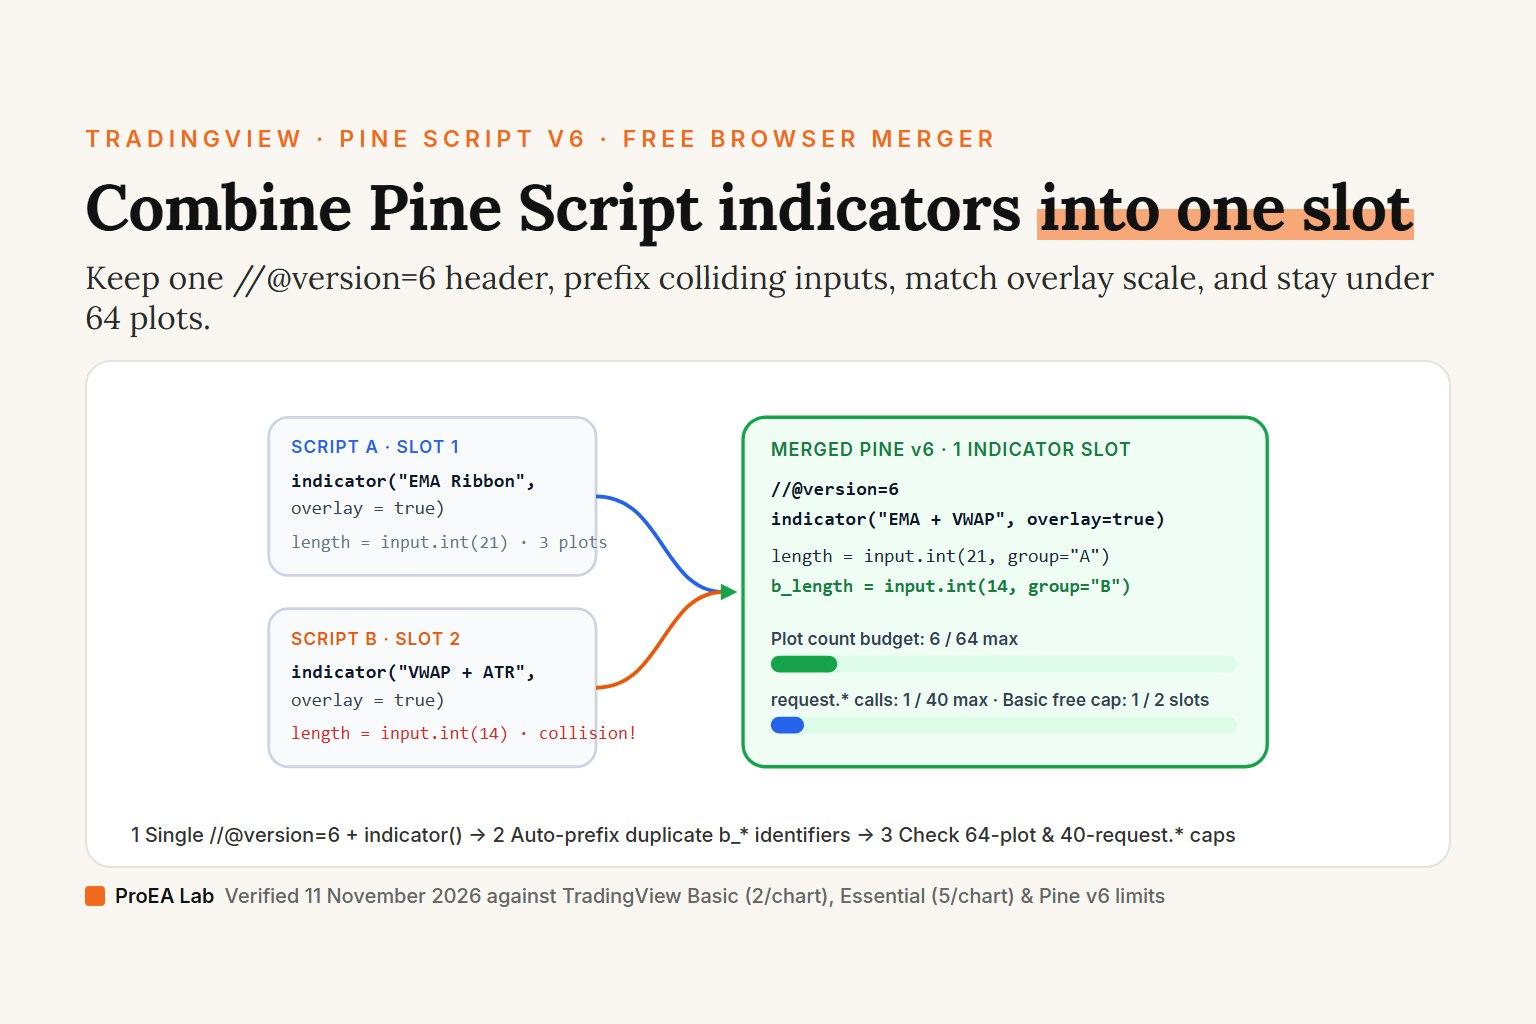
To combine two TradingView indicators into one script, keep a single //@version=6 and a single indicator() declaration at the top, rename any duplicate variable or input.* identifiers in the second script, match their overlay scale, and stay within 64 plots and 40 request.* calls. The browser merger above handles the header, renames colliding variables (b_src, b_length), and checks both compiler budgets locally.
Why traders merge Pine scripts (and what each plan allows)
Every indicator you add from TradingView's Indicators menu consumes one per-chart indicator slot. On TradingView's pricing comparison (verified 11 November 2026), the per-chart indicator caps are:
| TradingView plan | Indicators per chart | Active technical alerts | Annualized monthly price (read 2026-11-11) |
|---|---|---|---|
| Basic (Free) | 2 | 0 (3 price alerts) | $0 |
| Essential | 5 | 20 | $12.95 / mo |
| Plus | 10 | 100 | $29.95 / mo |
| Premium | 25 | 400 | $59.95 / mo |
| Ultimate | 50 | 1,000 | $199.95 / mo |
If your chart stacks three separate moving averages, a session VWAP, and an ATR band, five separate scripts fill an entire Essential chart—or exceed Basic before you add your second average. Merging open-source scripts that share the same pane collapses them into 1 indicator slot. (If you are comparing paid tiers for Bar Replay, multiple chart tabs, or webhooks rather than indicator slots alone, run our TradingView plan picker or TradingView limit fixer.)
The four compiler rules that break copy-pasted scripts
When traders paste two scripts one after another into the Pine Editor and hit Add to chart, TradingView's compiler rejects the file on four predictable traps:
1. Duplicate //@version and indicator() headers
A Pine file can declare indicator() (or strategy()) once. Strip the second script's //@version= comment and its indicator(...) line so only the top header remains:
//@version=6
indicator("EMA Ribbon + Session VWAP", overlay = true)
If one script is Pine v5 and the other is Pine v6, bring the v5 lines up to v6 first (for example, security() became request.security(), ema() became ta.ema(), and lazy and/or evaluation tightened in v6—covered step by step in our Pine Script v6 migration guide).
2. Variable and input name collisions
Almost every community script names its lookback length and its price input src:
// Script A
src = input.source(close, "Source")
length = input.int(20, "Length")

// Script B — FAILS if pasted unchanged: 'src' and 'length' are already defined!
b_src = input.source(hlc3, "VWAP Source")
b_length = input.int(14, "RSI Length")
In Pine Script, = declares a new variable while := reassigns an existing mutable variable of the same type. Declaring length = ... twice throws an immediate compile error. Prefixing every colliding identifier in Script B (b_src, b_length) keeps both input controls independent inside TradingView's Settings dialog—and adding group = "Script B" to each input.*() call groups them neatly under their own heading.
3. The overlay = true vs overlay = false scale trap
A single Pine script draws in one place:
overlay = truedraws directly on the instrument's price candles (for example, XAUUSD at2,700or NQ at21,000).overlay = false(Pine's default whenoverlayis omitted!) opens a separate sub-pane below the candles (for example, RSI or Squeeze Momentum oscillating around0or0–100).
If you merge an overlay = true EMA (2,700) with an overlay = false RSI (0–100) and plot both as lines, TradingView stretches the Y-axis from 0 to 2,700: both the candles and the RSI flatten into unreadable horizontal lines.
How to combine an overlay indicator with an oscillator cleanly: keep overlay = true so your EMAs, session or cash-open VWAP, or bands sit on price, compute the oscillator variable in the background without calling plot(rsiVal), and surface the oscillator state through scale-free calls:
barcolor(rsiVal > 70 ? color.lime : na)to tint overbought/oversold bars,bgcolor(rsiVal < 30 ? color.new(color.teal, 90) : na)to shade extremes, orplotshape(ta.crossover(rsiVal, 50), style = shape.triangleup, location = location.belowbar)to mark triggers right under the candle.
4. TradingView's 64-plot and 40-request.* single-script caps
Combining scripts does not give infinite drawing calls inside one slot. TradingView enforces per-script ceilings regardless of subscription tier:
- 64 plot counts maximum: Every
plot(),plotshape(),plotchar(),plotarrow(),plotbar(),plotcandle(),bgcolor(),barcolor(), andfill()adds to the script's plot count (some multi-series built-ins count more than one plot internally). - 40
request.*calls maximum: Multi-timeframe dashboards callingrequest.security()across 25 symbols and two timeframes will exceed 40 calls if merged naively. Pack multiple expressions from the same symbol and timeframe into a single tuple request ([htfEma, htfRsi, htfAtr] = request.security(syminfo.tickerid, "240", [ta.ema(close, 21), ta.rsi(close, 14), ta.atr(14)])) so three series cost 1request.security()call instead of 3.
What you cannot merge into one Pine script
- Protected and invite-only scripts: If no
{}Source code icon appears next to the indicator's name on your chart, TradingView does not expose its Pine source. You cannot merge closed-source indicators; each one requires its own indicator slot. - Compiled MetaTrader
.ex4/.ex5or closed.algobinaries: Compiled.ex4,.ex5, and closed.algofiles have no readable source. If you have the editable.mq4,.mq5, or C#.cssource file, translate its formulas to Pine v6 first in our MQL4 to Pine Script converter, MQL5 to Pine Script converter, NinjaScript to Pine converter, cTrader to Pine converter, or thinkScript to Pine converter, then merge the resulting Pine v6 code above.
Where we stand
We verified TradingView's per-chart indicator and alert limits on tradingview.com/pricing on 11 November 2026. The merger at the top of this page runs entirely in your browser: your scripts are never uploaded or stored, and TradingView's Pine Editor compiler is always the final check on any merged script.
Frequently asked questions
How many indicators can you put on one TradingView chart?
On TradingView's pricing page (read 11 November 2026), the free Basic plan allows 2 indicators per chart, Essential allows 5, Plus allows 10, Premium allows 25 and Ultimate allows 50. Combining two or three open-source scripts into one saved Pine v6 indicator uses a single chart slot.
Why do I get a syntax error when pasting two Pine scripts together?
Usually for one of two reasons: leaving two indicator() or //@version= lines in the same file, or declaring the same variable name (such as src, length or ma) twice at the top level. Keep one //@version=6 and one indicator() header at the top, and prefix any duplicate input or variable names in the second script.
Can you combine an overlay indicator (like EMA) with RSI in one Pine script?
Not as two full lines on the same Y-axis without squashing one of them. An EMA on gold sits near 2,700 while RSI stays between 0 and 100, and one Pine indicator has one primary scale (overlay = true on the price bars or overlay = false in a sub-pane). To combine them cleanly, keep overlay = true for the EMAs and express RSI conditions via barcolor(), bgcolor() or plotshape() markers on the bars.
How many plots can one combined Pine Script have?
TradingView's Pine compiler enforces up to 64 plot counts per script (counting plot(), plotshape(), plotchar(), plotarrow(), plotbar(), plotcandle(), bgcolor(), barcolor() and fill()) and up to 40 unique request.* calls such as request.security(). The merger above counts both before you paste into TradingView.
Can you merge invite-only or closed-source TradingView indicators?
No. Invite-only and protected scripts hide their Pine source code in TradingView, so there is no code to paste into a combined script. Only open-source scripts (including TradingView's built-in indicators whose source opens in the Pine Editor) can be merged.