TradingView limits how many chart tabs you keep open at once (2 on the free Basic plan), how many intraday bars a chart loads (5,000 on Basic), and how many alerts run (3 price alerts on Basic), and each paid plan raises the numbers. Two limits aren't about the plan at all: an alert that fires more than 15 times in 3 minutes is stopped, and a layout that grows too large can't be saved. The tool above takes the message you see and gives what TradingView counts, the free fix and the plan that lifts it. Every number is from TradingView's pricing page and help, read on 2026-10-29.
A simulated schematic, not a screenshot: no TradingView artwork, simulated candles. The message's wording on your screen may differ.
Read as text
- 1. Open a chart: one tab is one connection.
- 2. Open a second: Basic allows 2 at once.
- 3. Open a third: the oldest tab is closed.
- 4. Restore it: another tab closes instead.
- 5. Close one you don't watch: back under the limit.
- On Essential and up, one tab can hold a multi-chart layout: several charts, one connection.
How this window was chosen: From TradingView's help on parallel chart connections and closed connections, and its pricing page, read 2026-10-29.
What does "connection closed" mean on TradingView?
You have more chart tabs open than your plan allows, and TradingView closed the oldest one. From its help, Parallel chart connections: "Each tab in the web version and apps is counted as one connection. Opening one tab in your browser and one in an app counts as two connections." And: "Once the limit is reached, the oldest connection (the earliest opened tab) will get closed."
The closed tab shows a message with a Restore connection button. Don't click it to get the tab back while you're still at the limit: "Restoring the current connection when the maximum connections limit has already been exceeded will terminate the connection in another tab." Another help article, Why was the connection closed?, adds that closing the message with its cross leaves you on a disconnected chart you can only bring back by refreshing the page.
The pricing page's "Simultaneous chart connections" row on 2026-10-29: 2 on Basic, 10 on Essential, 20 on Plus, 50 on Premium, 200 on Ultimate. Two tabs is little: a chart on your computer and the app on your phone already make two on Basic.
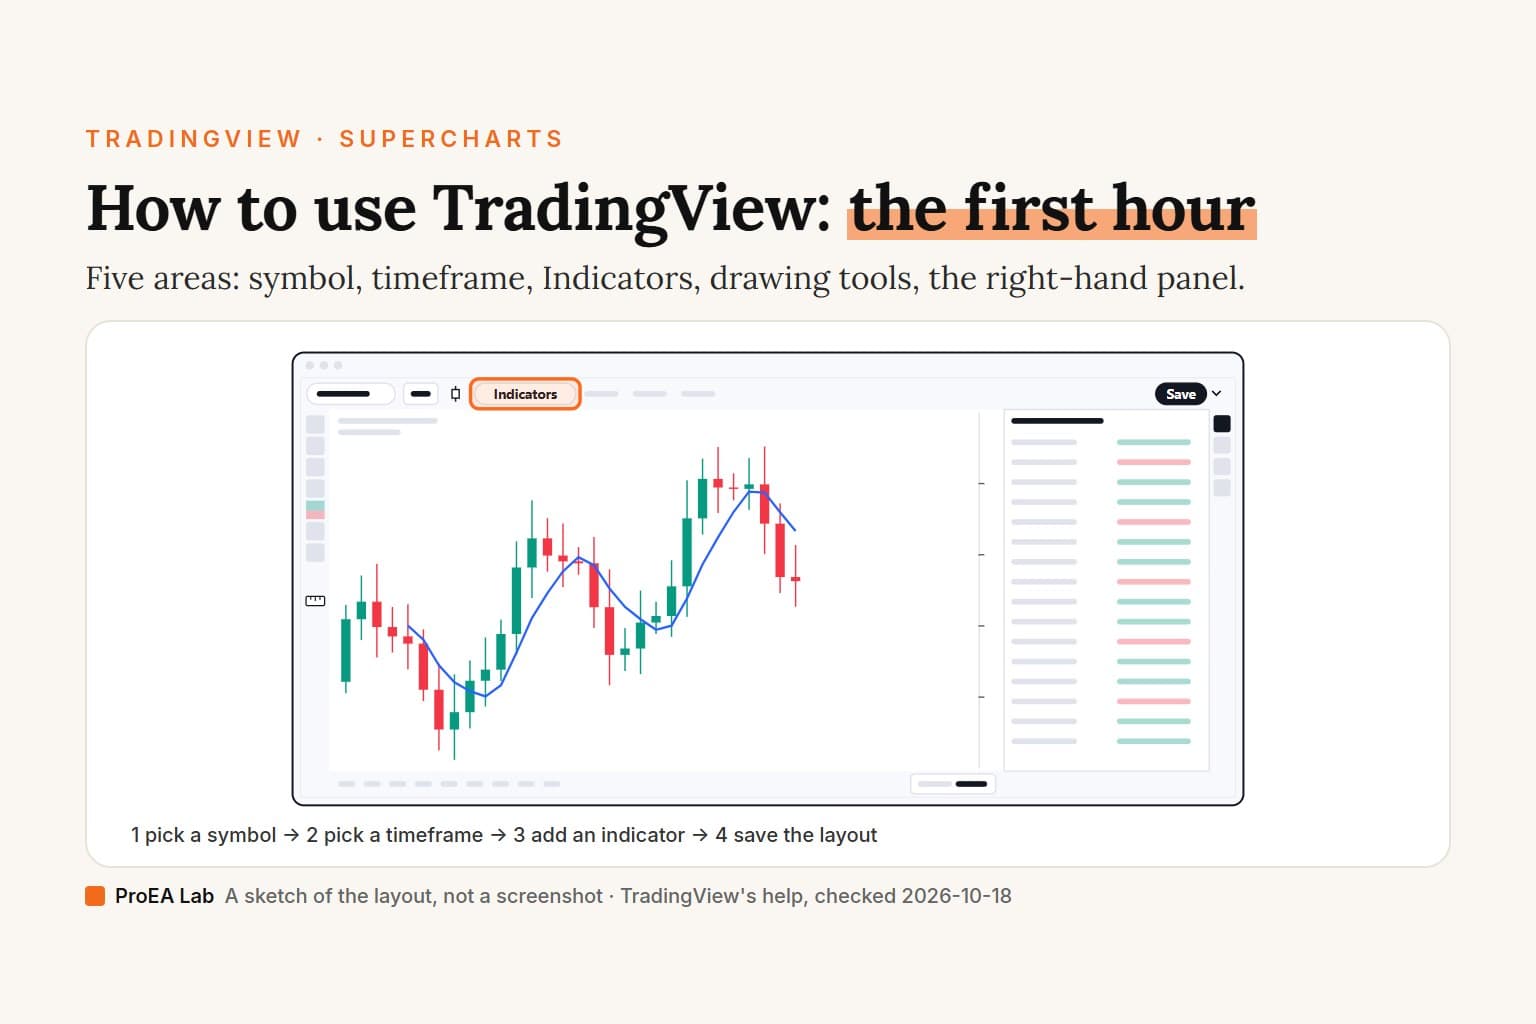
The free fix is fewer tabs. On a paid plan, put the charts you watch into one tab instead: TradingView's help says "you can optimize your connections using multi-chart layouts", and one tab holds 2 charts on Essential, 4 on Plus, 8 on Premium and 16 on Ultimate. Basic allows 1 chart per tab.
Why does my chart stop at 5,000 bars?
Intraday charts load a set number of bars by plan, and 5,000 is Basic's. TradingView's help, Historical intraday data: bars and limits explained: "The length of historical data for any intraday interval (i.e. chart timeframe) is 5000 bars/candles (for Essential and Plus account holders it is doubled to 10000 bars and for Premium holders it's quadrupled to 20000)". Ultimate "can have the maximum number of historical intraday bars, which is 40000". The pricing page's "Historical bars available" row says the same: 5K, 10K, 10K, 20K, 40K.
The limit can't be raised by asking: "Unfortunately, these limits cannot be extended for now due to technical reasons." Two ways around it, both from the same article:
- Use a daily or higher timeframe. "We display all available data for daily-based intervals." That's on every plan.
- For a strategy, use Deep Backtesting, which calculates "on all historical data available for the selected symbol, and not just on those loaded on the chart". Deep Backtesting is a Premium and Ultimate feature on the pricing page. Our backtesting guide covers both ways to test.
How far back 5,000 bars reach depends on the market and the timeframe. The tool's calculator divides the bars by the bars in a trading day (a short last bar of the session counts as one, so a US stock's 1-hour chart has 7) and ignores holidays; a few examples of its arithmetic:
| 5,000 bars of | Crypto (24/7) | Forex (24/5) | US stocks, regular session |
|---|---|---|---|
| 1 minute | about 3 days | about 5 days | about 18 days |
| 5 minutes | about 17 days | about 24 days | about 3 months |
| 1 hour | about 7 months | about 10 months | about 2.7 years |
Why can't I create another alert?
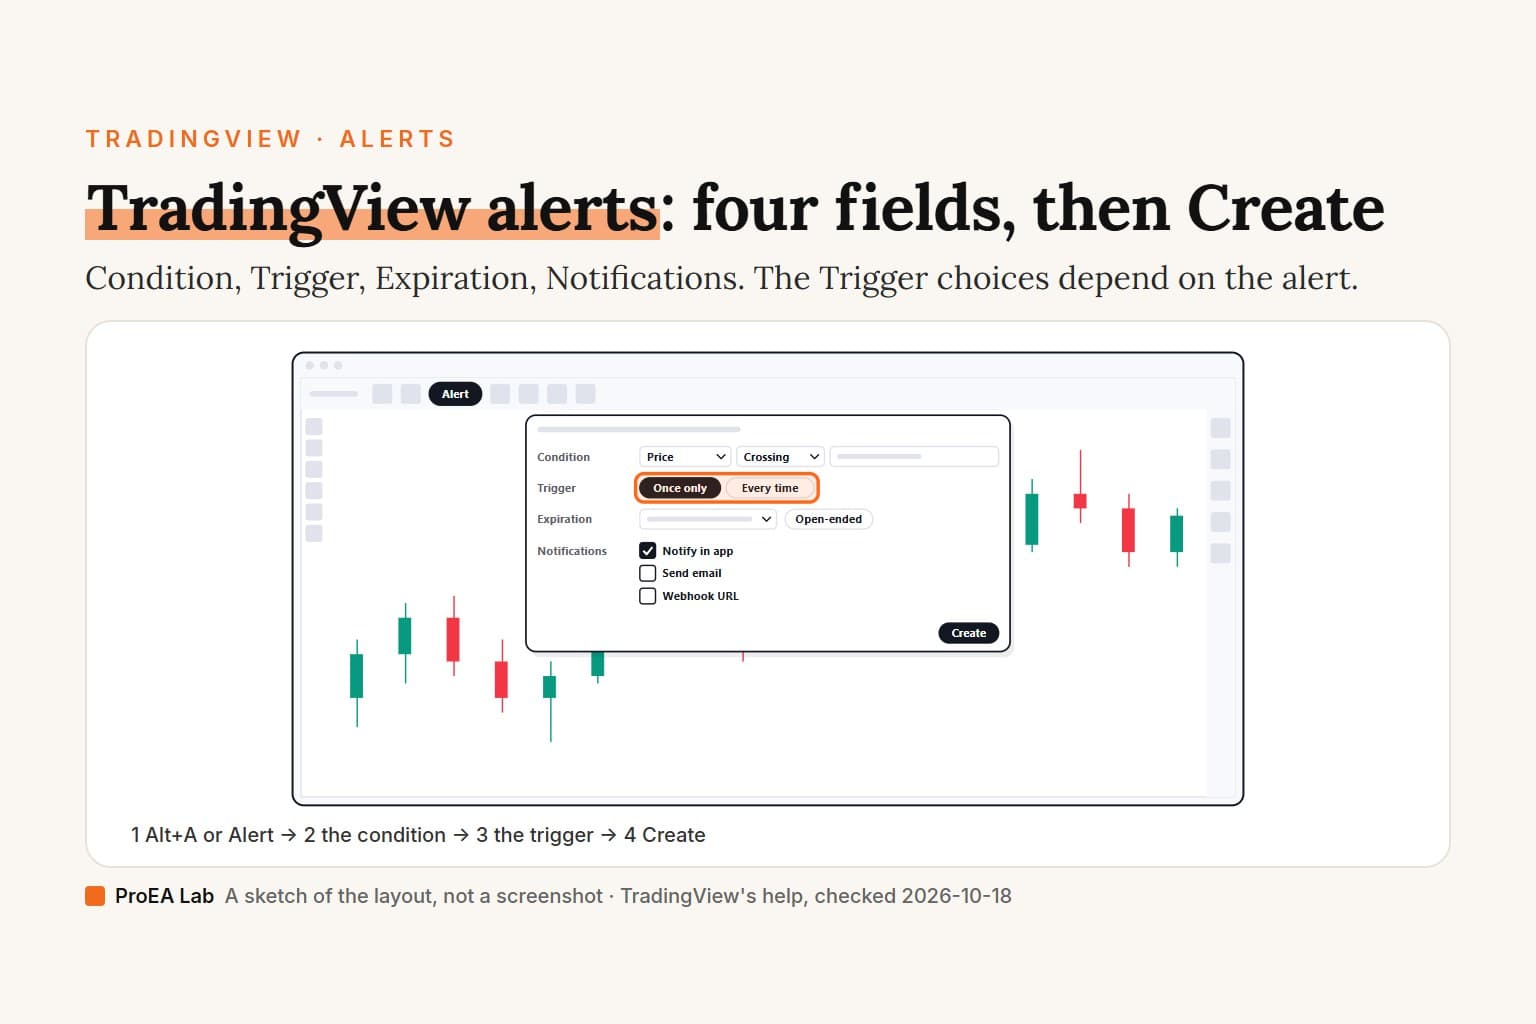
Your plan's limit for that type of alert is reached, and TradingView counts three types separately. From Alerts separation by type: "Each type has a separate limit on the number of active alerts". The three are price, technical and watchlist alerts. An alert is technical when it "uses an overlay symbol, indicator, drawing or strategy" or has multiple conditions; a plain price crossing is a price alert.
The pricing page on 2026-10-29:
| Plan | Price alerts | Technical alerts | Watchlist alerts | How long alerts last |
|---|---|---|---|---|
| Basic | 3 | 0 | 0 | 1 month |
| Essential | 20 | 20 | 0 | 2 months |
| Plus | 100 | 100 | 0 | 2 months |
| Premium | 400 | 400 | 2 | No limit |
| Ultimate | 1,000 | 1,000 | 15 | No limit |
The free fix is to delete or stop the active alerts you no longer need: the limit counts active alerts. A Pine script can also put several conditions into one alertcondition() or alert() call, so one technical alert does the work of several. If an alert is set but doesn't fire, that's a different problem: why a TradingView alert isn't triggering.
Why was my alert stopped?
It fired too often, and no plan changes that. TradingView's help gives the limit for regular alerts as "no more than 15 triggers in 3 minutes." For a watchlist alert, each symbol has the same 15 in 3 minutes and the whole alert at most 1,000 triggers in 3 minutes. TradingView's advice: "changing the alert trigger condition" and "reducing the number of symbols in the watchlist". A condition checked once per bar close fires at most once a bar.
What does "Your chart is too large and cannot be saved" mean?
The layout is over TradingView's size limit, and drawings are what usually fill it. The help article: "the size of your chart layout has exceeded our maximum limit. Please remove any drawings that you do not need in Manage Drawings window or create a new chart layout." It isn't a plan limit; a higher plan doesn't raise it.
Which plan lifts the limit I keep hitting?
The one whose row covers your number: the tool shows it for each limit, and the plan picker does it for several at once. The rows that most often decide an upgrade, from the pricing page on 2026-10-29, with each plan's price per month billed yearly:
| Plan | Price | Chart tabs at once | Intraday bars | Indicators per chart | Saved layouts |
|---|---|---|---|---|---|
| Basic | $0 | 2 | 5,000 | 2 | 1 |
| Essential | $12.95 | 10 | 10,000 | 5 | 5 |
| Plus | $29.95 | 20 | 10,000 | 10 | 10 |
| Premium | $59.95 | 50 | 20,000 | 25 | Unlimited |
| Ultimate | $199.95 | 200 | 40,000 | 50 | Unlimited |
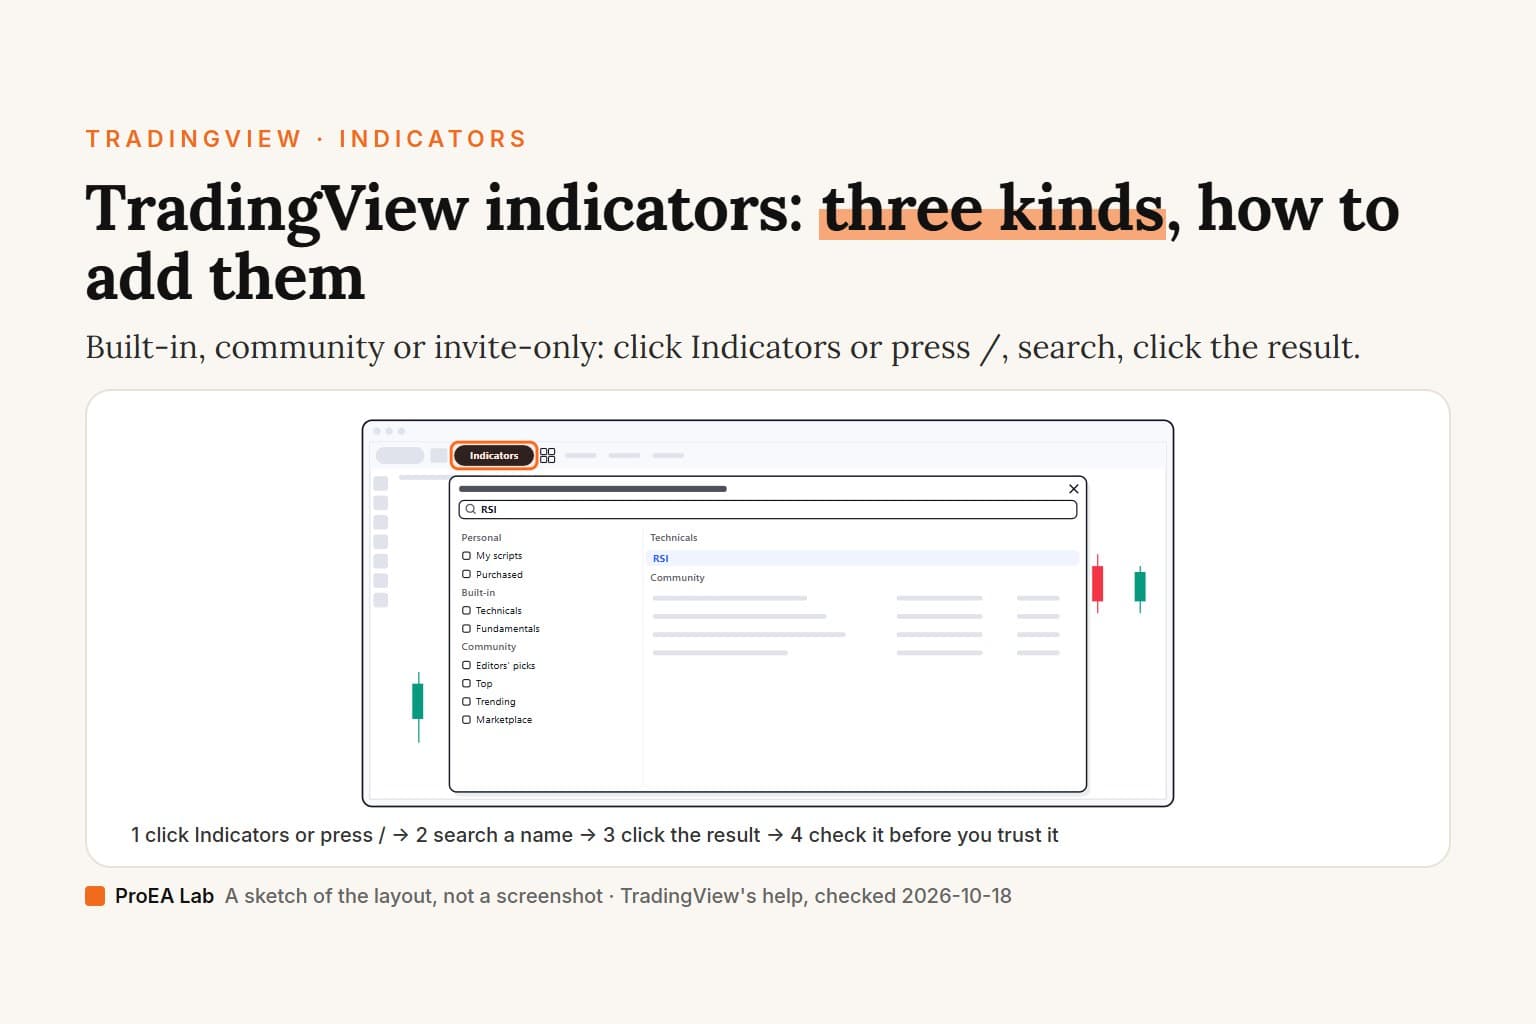
Before paying for indicators per chart, note that one Pine script takes one slot however many lines it draws, so several indicators merged into one script fit in one.
Use itPay for the limit you hit every day, and try the free fix first: fewer tabs, a daily chart, fewer active alerts.
Watch outTwo of these limits, an alert stopped for firing too often and a layout too large to save, are the same on every plan.
The deep version, as a PDF
TradingView Power-User Guide
The plan you actually need, Pine without the pain, alerts that fire, and backtests you can trust.
- Every plan's limits on one page, which plan each kind of trader needs, and how to fit more on the one you have
- Original research: two strategies, three Strategy Tester settings and two fill-order assumptions on a year of gold and Bitcoin, and how far each result moved
- Alerts and webhooks that fire when they should, with the full why-it-didn't checklist and a JSON template
One payment, instant download. Refund within 7 days if you haven't downloaded it.
Where we stand
On 2026-10-29 we read TradingView's pricing page and its help articles on chart connections, intraday bars, alert types, stopped alerts and chart size. We're on the free Basic plan and haven't reached each paid plan's limits ourselves; the messages are TradingView's descriptions, and the wording on your screen may differ. The calculator's "how far back" is our arithmetic on TradingView's bar counts, not a figure TradingView publishes.
We make Pine indicators: each tool in our Pine v6 stack is a .pine file you paste into the Pine Editor, and one script takes one indicator slot. TradingView doesn't endorse us. We're in its partner program, so our links to TradingView are partner links: if you open a new account through one and buy a plan, TradingView may pay us, at no cost to you.
Use this animation on your site.
Frequently asked questions
What does connection closed mean on TradingView?
You opened more chart tabs than your plan allows at once, so TradingView closed the oldest one. Each tab in the browser or the apps counts as one connection: 2 on Basic, 10 on Essential, 20 on Plus, 50 on Premium and 200 on Ultimate, per the pricing page on 2026-10-29. Restoring the closed tab closes another one.
Why does my TradingView chart stop at 5000 bars?
Intraday charts load a set number of bars by plan: 5,000 on Basic, 10,000 on Essential and Plus, 20,000 on Premium and 40,000 on Ultimate. TradingView's help says these limits can't be extended. Daily and higher timeframes show all the data on every plan.
How many alerts can I have on TradingView?
Price alerts: 3 on Basic, 20 on Essential, 100 on Plus, 400 on Premium, 1,000 on Ultimate. Alerts on indicators, strategies or drawings have their own, separate limit: none on Basic, then the same 20, 100, 400 and 1,000. Watchlist alerts: 2 on Premium, 15 on Ultimate.
Why was my TradingView alert stopped?
It fired too often. TradingView's help gives the limit for regular alerts as no more than 15 triggers in 3 minutes. Change the trigger condition, for example to once per bar close; no plan raises this limit.
What does 'Your chart is too large and cannot be saved' mean?
The chart layout is over TradingView's size limit, usually from drawings. Remove the drawings you don't need in the Manage Drawings window, or start a new layout. It isn't a plan limit.
Can I open TradingView on two devices?
Yes. Each chart tab, in a browser or an app, is one connection, and your plan sets how many can be open together: 2 on Basic, so one tab on your computer and one on your phone is already the limit.