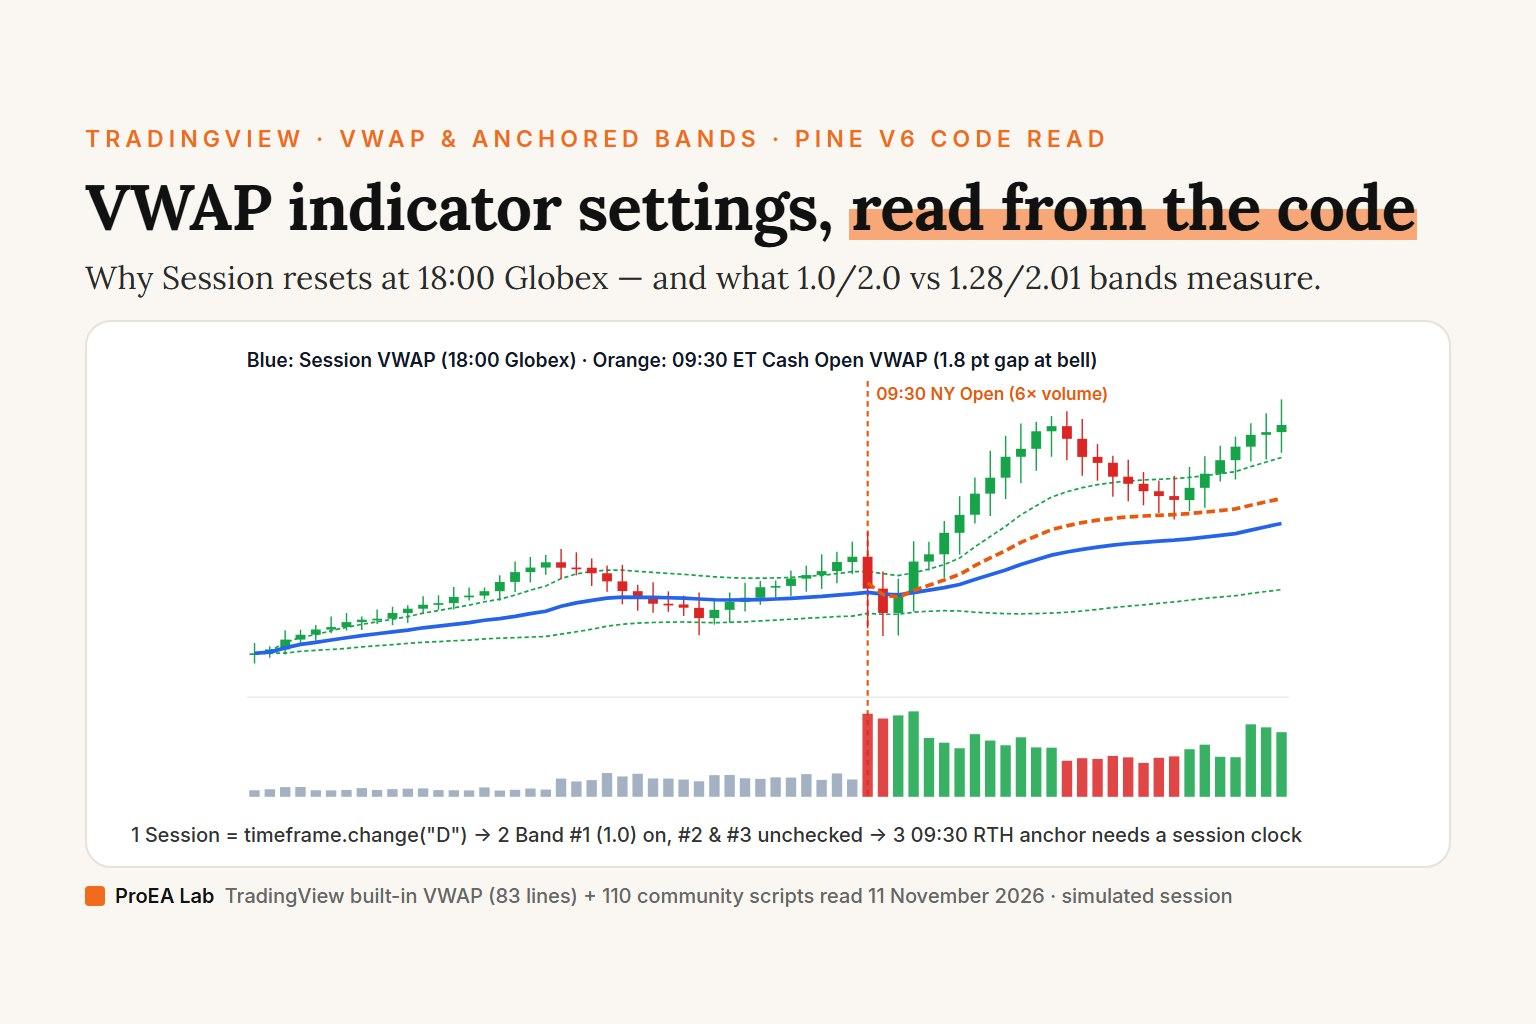
No single VWAP setting fits every session or asset class, and reading TradingView's 83-line built-in Pine v6 source (Volume-weighted average price) explains three behaviors that confuse intraday traders every week: Session on line 35 calls timeframe.change("D") (anchoring CME futures at 18:00 ET Globex rather than the 09:30 ET New York cash open), Hide VWAP on 1D or Above on line 4 now defaults to false (meaning Session VWAP on a 1D chart resets every bar and collapses its bands to zero), and Bands Multiplier #2 (2.0) and #3 (3.0) ship unchecked on lines 15–18. Switch between the 18:00 ET Globex anchor, 09:30 ET cash open, hlc3 vs hl2, and community Z-score bands on the simulated futures session below.
Globex 18:00 Session · hlc3 · ±1.00σ: closing VWAP 5025.45 (Band #1 width 25.71 pts).
At the 09:30 ET New York cash bell, 18:00 Globex Session VWAP and 09:30 RTH VWAP sit 1.83 points apart because Globex carries 40 bars of overnight Asia/London drift. Across the active window, 46 simulated candles close outside Band #1 (±1.00σ) — turn on Band #2 above to add the ±2σ envelope TradingView leaves unchecked on line 15.
Simulated US index futures session (18:00 ET Globex open through 16:00 ET close), not market data: generated deterministically to illustrate STD;VWAP lines 4–67 and TheYangGuizi's n1Ub6FXK (read 11 November 2026). Counts describe these simulated bars only.
Read preset comparison as table
| VWAP Preset | Anchor & Source | Closing VWAP | Band #1 Width | Closes Outside #1 |
|---|---|---|---|---|
| Session · hlc3 · 1.0σ (TV Default) | globex-session · hlc3 | 5025.45 | 25.71 pts | 46 bars |
| NY 09:30 Open · 1.0σ / 2.0σ | ny-rth · hlc3 | 5030.31 | 22.57 pts | 18 bars |
| 1.28 · 2.01 · 2.51 · hl2 (v2 Mod) | globex-session · hl2 | 5025.23 | 32.71 pts | 39 bars |
| Rolling 20-bar (RVWAP) | rolling-20 · hlc3 | 5037.83 | 8.76 pts | 47 bars |
What we read
On 11 November 2026 we pulled TradingView's official 83-line Pine Script v6 built-in Volume-weighted average price (STD;VWAP) alongside community scripts from TradingView's search for "vwap", "anchored vwap" and "vwap stdev".
The open-source scripts we read include RagingRocketBull's Volume Profile Free Ultra SLI (100 Levels Value Area VWAP) (21,072 boosts), Zeiierman's Dynamic Swing Anchored VWAP (16,092 boosts), TheYangGuizi's VWAP Stdev Bands v2 Mod (14,516 boosts), LuxAlgo's VWAP Periodic Close (6,800 boosts), and TradingView's own Rolling VWAP (5,456 boosts) and Chart VWAP (4,151 boosts). Every line reference below comes directly from those raw Pine files as served on 11 November 2026 (for side-by-side grading of eight community overlays, see our best VWAP indicators on TradingView code-read roundup).
TradingView's built-in VWAP: every input on lines 4–18
TradingView's built-in STD;VWAP declares eleven settings across two groups ("VWAP Settings" and "Bands Settings"):
| Input in Settings | Default | Line | What STD;VWAP actually computes |
|---|---|---|---|
Hide VWAP on 1D or Above | false | 4 | Gates lines 56–66 with if not (hideonDWM and timeframe.isdwm). Contrary to older Pine v3/v4 tutorials, this ships off (false). |
Anchor Period | "Session" | 5–6 | Selects when isNewPeriod resets ta.vwap(): "Session" (timeframe.change("D")), "Week", "Month", "Quarter" ("3M"), "Year" ("12M"), "Decade", "Century", "Earnings", "Dividends", or "Splits". |
Source | hlc3 | 7 | Price weighted by each bar's volume: (high + low + close) / 3 by default. |
Offset | 0 | 8 | Shifts the plotted lines horizontally by offset bars (plot(..., offset = offset)). |
Bands Calculation Mode | "Standard Deviation" | 12 | Switches line 60 between volume-weighted stdevAbs and _vwap * 0.01 ("Percentage", where multiplier 1.0 = ±1%). |
Bands Multiplier #1 | true, 1.0 | 13–14 | Plots ±1.0 band in green with a 95% transparent fill. Only band enabled out of the box. |
Bands Multiplier #2 | false, 2.0 | 15–16 | Computed on lines 63–64 (±2.0), but hidden (display.none) until checked. |
Bands Multiplier #3 | false, 3.0 | 17–18 | Computed on lines 65–66 (±3.0), hidden until checked. |
Here are lines 35–66 of TradingView's built-in STD;VWAP verbatim:
	"Session"   => timeframe.change("D")
	"Week"      => timeframe.change("W")
	"Month"     => timeframe.change("M")
	"Quarter"   => timeframe.change("3M")
	"Year"      => timeframe.change("12M")
	"Decade"    => timeframe.change("12M") and year % 10 == 0
	"Century"   => timeframe.change("12M") and year % 100 == 0
	=> false

isEsdAnchor = anchor == "Earnings" or anchor == "Dividends" or anchor == "Splits"
if na(src[1]) and not isEsdAnchor
	isNewPeriod := true
...
if not (hideonDWM and timeframe.isdwm)
    [_vwap, _stdevUpper, _] = ta.vwap(src, isNewPeriod, 1)
	vwapValue := _vwap
    stdevAbs = _stdevUpper - _vwap
	bandBasis = calcModeInput == "Standard Deviation" ? stdevAbs : _vwap * 0.01
	upperBandValue1 := _vwap + bandBasis * bandMult_1
	lowerBandValue1 := _vwap - bandBasis * bandMult_1
Two practical consequences fall straight out of those 30 lines (alongside lines 21–22, where if barstate.islast and ta.cum(volume) == 0 halts on volume-less spot feeds with runtime.error("No volume is provided by the data vendor.")):
- Why CME futures Session VWAP ignores the
09:30 ETcash open: OnES1!,NQ1!,MES1!,MNQ1!, andGC1!charts set to Electronic (ETH) hours,timeframe.change("D")fires at the18:00 ETGlobex open, not at09:30 ETwhen the New York cash equity book opens. By09:30 ET,SessionVWAP already carries 15.5 hours of overnight drift—as you can see in the drill above where the two anchors sit points apart right at the opening bell. If your playbook measures intraday opening-range structure around09:30 ET(compare our Opening Range Breakout guide and Initial Balance vs Opening Range breakdown), either switch the chart's bottom-right session toggle to RTH or run an explicit0930-1600America/New_Yorkanchor like the Pine v6 script below. - Why
SessionVWAP looks flat without bands on a1Dchart: BecausehideonDWMisfalseon line 4,STD;VWAPstill plots on a1Dchart—buttimeframe.change("D")istrueon every daily candle. Resettingta.vwap()on every bar reduces_vwapto(hlc3 * volume) / volume = hlc3and forcesstdevAbsto0, collapsing every band onto the center line. On1Dcharts, changeAnchor PeriodtoWeek,Month,Quarter, orYear(and on4Hcrypto or swing charts,WeekorMonthavoids noisy 24-hour00:00 UTCresets).
1.0 / 2.0 / 3.0 vs 1.28 / 2.01 / 2.51: what the bands actually measure
Inside each anchor period, volume-weighted average price and standard deviation accumulate three running sums across bars k = 1..n:
VWAP_n  = sum(P_k * V_k) / sum(V_k)
sigma_n = sqrt(max(0, sum(P_k^2 * V_k) / sum(V_k) - VWAP_n^2))
Notice how TheYangGuizi's 14,516-boost VWAP Stdev Bands v2 Mod (n1Ub6FXK, lines 3–33) differs from TradingView's built-in in two places:
devUp1 = input(1.28, title="Stdev above (1)")
devUp2 = input(2.01, title="Stdev above (2)")
devUp3 = input(2.51, title="Stdev above (3)")
devUp4 = input(3.09, title="Stdev above (4)")
devUp5 = input(4.01, title="Stdev above (5)")
...
vwapsum = iff(newSession, hl2*volume, vwapsum[1]+hl2*volume)
volumesum = iff(newSession, volume, volumesum[1]+volume)
v2sum = iff(newSession, volume*hl2*hl2, v2sum[1]+volume*hl2*hl2)
- Source (
hl2vshlc3):n1Ub6FXKhardcodeshl2((high + low) / 2), ignoring where each candle closed, whereas TradingView's built-in weightshlc3((high + low + close) / 3). On wide directional trend bars whereclosefinishes nearhighorlow,hlc3pulls VWAP faster toward the trend thanhl2. - Multipliers (
1.28 / 2.01 / 2.51 / 3.09vs1.0 / 2.0 / 3.0):1.28,2.01,2.51, and3.09are two-sided Z-scores of a standard normal bell curve (~80%, ~95.5%, ~98.8%, and ~99.8%). Remember that cumulative intraday price dispersion around a moving anchor is not an independent normal sample: right after an anchor resets (bar 1),stdev = 0, so all bands pinch to zero and expand as the session unfolds. Treat standard deviation bands as session-scaled volatility envelopes—just like Value Area High and Low on a TradingView Volume Profile (our empirical study of Volume Profile levels explains why volume nodes map auction liquidity rather than acting as guaranteed magnets).
How the built-in and four open-source VWAP scripts compare
| Script & author | Boosts (2026-11-11) | Anchor & source | Band defaults | Code details & repainting check |
|---|---|---|---|---|
Built-in VWAP (TradingView, STD;VWAP) | Built-in | Session ("D"), hlc3 | 1.0 on; 2.0, 3.0 off | Pine v6; Earnings/Dividends/Splits use lookahead_on event timestamps (lines 26–33), which is causal once the corporate event bar exists; zero alertcondition(). |
Dynamic Swing Anchored VWAP (Zeiierman, SxgyrEde) | 16,092 | 50-bar swing high/low, hlc3 | None (trend polyline) | Not a plain cumulative VWAP: applies an EWMA half-life (baseAPT = 20, lines 65–68 & 107–109) and deletes/redraws polyline.new whenever a new 50-bar extreme updates the swing! |
VWAP Stdev Bands v2 Mod (TheYangGuizi, n1Ub6FXK) | 14,516 | "D" via security(), hl2 | 1.28, 2.01, 2.51 on (3.09, 4.01 off) | Legacy Pine v2 study(); hardcodes hl2; optional prevwap plots prior day's closing VWAP. |
VWAP Periodic Close (LuxAlgo, yEBIUAAK) | 6,800 | D, W, M on (Q, Y off), hlc3 | None (horizontal close levels) | Carries forward 1 Daily, 3 Weekly and 2 Monthly prior-period closing VWAP lines as horizontal reference levels. |
Rolling VWAP (TradingView, ZU2UUu9T) | 5,456 | Auto-scaled sliding time window, hlc3 | 0.0 (all 3 bands off by default) | Pine v6; scales window automatically (1H on 1m, 4H on 5m, 1D on 1H, 30.4D on 1D, lines 83–94) and enforces minBarsInput = 10 across gaps. |
Watch Zeiierman's SxgyrEde closely if you audit indicators for historical stability (see our repainting audit guide): lines 96–113 call vwap.poly.delete() and loop for i = barsback to 0 whenever dir != dir[1], and its smoothing weights p := (1.0 - alpha) * p + alpha * pxv decay older volume exponentially rather than weighting the whole swing equally.
Clean Pine Script v6: NY 09:30 ET Cash-Open + Session VWAP with alerts
TradingView's built-in STD;VWAP has no 09:30 ET RTH anchor option on ETH futures charts and zero alertcondition() calls. This compact //@version=6 script gives you both: pick "NY 09:30 Cash Open" (or "Exchange Session", "Week", "Month"), customize all three deviation multipliers (1.0 / 2.0 / 3.0 or 1.28 / 2.01 / 2.51), and trigger alerts strictly on barstate.isconfirmed closes—ready to combine with other overlays via our Pine Script indicator merger or compare against Squeeze Momentum settings:
//@version=6
indicator("ProEA Session & NY 09:30 RTH VWAP (v6)", shorttitle = "VWAP RTH v6", overlay = true)

anchorMode = input.string("NY 09:30 Cash Open", "Anchor Mode", options = ["NY 09:30 Cash Open", "Exchange Session (D)", "Week (W)", "Month (M)"])
rthSession = input.session("0930-1600", "NY Cash Session", tooltip = "Used when Anchor Mode is NY 09:30 Cash Open.")
rthTz      = input.string("America/New_York", "Session Timezone")
src        = input.source(hlc3, "Source")
mult1      = input.float(1.0, "Band #1 StDev", minval = 0.1, step = 0.05)
show2      = input.bool(true, "Show Band #2", inline = "b2")
mult2      = input.float(2.0, "", minval = 0.1, step = 0.05, inline = "b2")
show3      = input.bool(false, "Show Band #3", inline = "b3")
mult3      = input.float(3.0, "", minval = 0.1, step = 0.05, inline = "b3")

inRth    = not na(time(timeframe.period, rthSession, rthTz))
rthStart = inRth and not inRth[1]

isNewPeriod = switch anchorMode
    "NY 09:30 Cash Open"   => rthStart
    "Exchange Session (D)" => timeframe.change("D")
    "Week (W)"             => timeframe.change("W")
    "Month (M)"            => timeframe.change("M")
    => timeframe.change("D")

var float cumPV  = 0.0
var float cumV   = 0.0
var float cumP2V = 0.0

if barstate.isfirst or isNewPeriod
    cumPV  := src * volume
    cumV   := volume
    cumP2V := src * src * volume
else
    cumPV  += src * volume
    cumV   += volume
    cumP2V += src * src * volume

active = anchorMode != "NY 09:30 Cash Open" or inRth
vwapVal = active and cumV > 0 ? cumPV / cumV : na
stdevVal = active and cumV > 0 ? math.sqrt(math.max(0.0, cumP2V / cumV - vwapVal * vwapVal)) : na

u1 = vwapVal + stdevVal * mult1
l1 = vwapVal - stdevVal * mult1
u2 = show2 ? vwapVal + stdevVal * mult2 : na
l2 = show2 ? vwapVal - stdevVal * mult2 : na
u3 = show3 ? vwapVal + stdevVal * mult3 : na
l3 = show3 ? vwapVal - stdevVal * mult3 : na

plot(vwapVal, "VWAP", color = #2962ff, linewidth = 2, style = plot.style_linebr)
pU1 = plot(u1, "Upper Band #1", color = #16a34a, style = plot.style_linebr)
pL1 = plot(l1, "Lower Band #1", color = #16a34a, style = plot.style_linebr)
fill(pU1, pL1, color = color.new(#16a34a, 93), title = "Band #1 Fill")
plot(u2, "Upper Band #2", color = #eab308, style = plot.style_linebr)
plot(l2, "Lower Band #2", color = #eab308, style = plot.style_linebr)
plot(u3, "Upper Band #3", color = #14b8a6, style = plot.style_linebr)
plot(l3, "Lower Band #3", color = #14b8a6, style = plot.style_linebr)

bool crossUpVwap = ta.crossover(close, vwapVal)
bool crossDnVwap = ta.crossunder(close, vwapVal)
bool crossUpB2   = ta.crossover(close, u2)
bool crossDnB2   = ta.crossunder(close, l2)

alertcondition(barstate.isconfirmed and crossUpVwap, "Confirmed Close Above VWAP", "Closed above VWAP on {{ticker}} ({{interval}})")
alertcondition(barstate.isconfirmed and crossDnVwap, "Confirmed Close Below VWAP", "Closed below VWAP on {{ticker}} ({{interval}})")
alertcondition(barstate.isconfirmed and crossUpB2, "Confirmed Close Above +Band #2", "Closed above Upper VWAP Band #2 on {{ticker}} ({{interval}})")
alertcondition(barstate.isconfirmed and crossDnB2, "Confirmed Close Below -Band #2", "Closed below Lower VWAP Band #2 on {{ticker}} ({{interval}})")
Note style = plot.style_linebr on the plots: when "NY 09:30 Cash Open" is selected on a 24-hour futures chart, vwapVal evaluates to na outside 09:30–16:00 ET so overnight Globex bars never bridge diagonal lines across cash-session closes. If you are migrating custom VWAP or volume-band code from MetaTrader or NinjaTrader onto TradingView, drop your source into our free MQL5 to Pine Script v6 converter, MQL4 to Pine Script v6 converter, or NinjaScript to Pine Script v6 converter, and test sample size and costs first with our TradingView backtesting guide.
Use this animation on your site.
Frequently asked questions
What are the default VWAP indicator settings on TradingView?
TradingView's 83-line Pine v6 built-in Volume-weighted average price (STD;VWAP) ships Hide VWAP on 1D or Above = false, Anchor Period = Session, Source = hlc3, Offset = 0, Bands Calculation Mode = Standard Deviation, Bands Multiplier #1 = 1.0 checked on, and Bands Multiplier #2 (2.0) and #3 (3.0) unchecked.
Why does Session VWAP on futures not reset at the 09:30 AM New York open?
Line 35 of TradingView's built-in VWAP maps Anchor Period = Session to timeframe.change('D'), which resets when the instrument's exchange trading day opens. On CME Globex futures (ES, NQ, MES, MNQ, GC) set to Electronic Trading Hours, the exchange day starts at 18:00 ET, so Session VWAP carries 15.5 hours of overnight Asia and London volume into 09:30 ET unless you switch the chart to Regular Trading Hours or run a session-clock Pine script.
Why does Session VWAP have no bands on a Daily (1D) chart?
When Anchor Period is left on Session on a 1D chart, timeframe.change('D') evaluates to true on every single daily bar. Because ta.vwap() resets on every bar, each bar's VWAP equals that single candle's hlc3 and the within-period standard deviation is identically zero, collapsing Upper and Lower Bands onto the VWAP line. Switch Anchor Period to Week, Month, Quarter or Year on 1D charts.
Where do the 1.28, 2.01, 2.51 and 3.09 VWAP standard deviation multipliers come from?
Those multipliers come from TheYangGuizi's open-source VWAP Stdev Bands v2 Mod (14,516 boosts on TradingView, lines 3–16), which sets standard normal Z-score quantiles: ±1.28 covers roughly 80% of a theoretical normal distribution, ±2.01 covers ~95.5%, ±2.51 covers ~98.8% and ±3.09 covers ~99.8%. Note that intraday volume-weighted price deviations are fat-tailed and non-stationary, so those percentages are bell-curve reference marks rather than empirical market probabilities.
What is the difference between Session VWAP, Anchored VWAP and Rolling VWAP?
Session VWAP resets at each calendar or exchange period boundary (Day, Week, Month or Year). Event- or swing-anchored VWAP pins the cumulative volume-weighted sum to a chosen bar—such as Earnings, a 09:30 ET cash open, or a swing high/low. TradingView's Rolling VWAP (RVWAP, 5,456 boosts) never resets to zero; instead it slides a time window (for example 4 hours on a 5-minute chart or 1 day on a 1-hour chart) across bars so no overnight reset jump occurs.
Does TradingView's VWAP indicator repaint or work on Forex pairs without volume?
Standard cumulative Session, Weekly and Monthly VWAP use closed-bar hlc3 and volume on the current timeframe without lookahead, so historical bars never repaint (only the live forming bar updates with incoming volume). Swing-anchored community scripts that re-anchor when a new pivot extreme forms do redraw their active polyline. On spot feeds that supply zero tick volume, lines 21–22 of STD;VWAP halt with runtime.error('No volume is provided by the data vendor.').