Short answer: an option buying strategy is a plan for five things: the direction, the strike, the size, the exit and the day's limit. None of them can promise a profit, and SEBI's own count is the reason to start with the arithmetic: in FY26, 90% of the traders who only bought options lost money. A NIFTY lot is 65 units, so a call bought at an illustrative ₹120 costs ₹7,800 a lot, breaks even at expiry 120 points above its strike, and loses all of it if NIFTY settles at or below the strike. Size from a stop on the premium, not from the premium you can afford, and set the day's cap and loss limit before the open.
Every premium, delta and theta below is illustrative: made up to show the arithmetic, roughly what a pricing model gives on such a morning, and not a quote. The rules quoted are NSE's and SEBI's, the definitions TradingView's, each read on 29 October 2026.
What is option buying?
NSE's own page for Nifty 50 derivatives: "An option gives a person the right but not the obligation to buy or sell something. An option is a contract between two parties wherein the buyer receives a privilege for which he pays a fee (premium) and the seller accepts an obligation for which he receives a fee."
For a Nifty option buyer that means:
- Calls and puts. A call (CE) gains when NIFTY rises above its strike; a put (PE) when NIFTY falls below it. NSE's page: "CE - Call European, PE - Put European."
- The lot is 65. NSE's circular FAOP70616 set NIFTY's lot at 65 from the 6 January 2026 weekly expiry, and NSE's lot file, read on 29 October 2026, shows 65 for every NIFTY contract listed. Every rupee below is a premium × 65.
- Strikes are 50 apart. For weekly and monthly contracts NSE lists strikes 50 points apart, "35-1-35": 35 in the money, one at the money and 35 out of the money.
- The premium moves in ₹0.05 steps. "The price step in respect of Nifty 50 index options contracts is Re.0.05."
- Expiry is on Tuesday. "Nifty 50 index options monthly contracts expire on the last Tuesday of the expiry month and weekly contracts expire on every Tuesday of the expiry week. If the Tuesday of the expiry period is a trading holiday, the contracts expire on the previous trading day."
- You pay the premium upfront, and it's the most you can lose. SEBI's circular of October 01, 2024 decided "to mandate collection of options premium upfront from option buyers", from February 01, 2025.
Option buying example: one Nifty call, worked by hand
An illustrative morning: NIFTY at 25,000, four days before Tuesday's expiry. You buy one lot of the 25,000 CE at ₹120.
The premium you pay
₹120 × 65 = ₹7,800 a lot, collected upfront. That's the most the lot can lose, before brokerage and taxes.
What it controls is much bigger. One lot's contract value is the index × the lot: 25,000 × 65 = ₹16,25,000, or 16.25 lakh. SEBI's circular says why that matters: "Options prices move in a non-linear way and carry very high implicit leverage."
Intrinsic value and time value
TradingView's help defines the two parts of any premium:
- "Intrinsic value is the amount an option would be worth if it were exercised right now." For a call, "it’s the difference between the underlying price and the strike price, if the underlying is above the strike."
- "Time value is everything in an option’s price beyond intrinsic value." It depends on "Time left to expiration (more time = higher time value)".
With NIFTY at 25,000, the 25,000 call's intrinsic value is 0, so all ₹120 is time value.
Theta: what a day costs
TradingView: "Theta shows how the price of an option will change in 1 day, or in other words, it shows the effect of time decay on the price of an option as it moves towards the expiration date."
Say the chain shows an illustrative theta of −₹16 on this call. One day passing, with nothing else changing, takes ₹16 × 65 = ₹1,040 a lot.
If NIFTY sits at 25,000 all the way to expiry, the whole ₹120 of time value goes: ₹7,800 a lot, an average of ₹30 a unit, or ₹1,950 a lot, on each of the four days. Today's ₹16 is below that average because the decay isn't even. In TradingView's words: "Out-of-the-money and in-the-money options decay almost linearly, while at-the-money options decay, intensifying as expiration approaches."
Breakeven at expiry
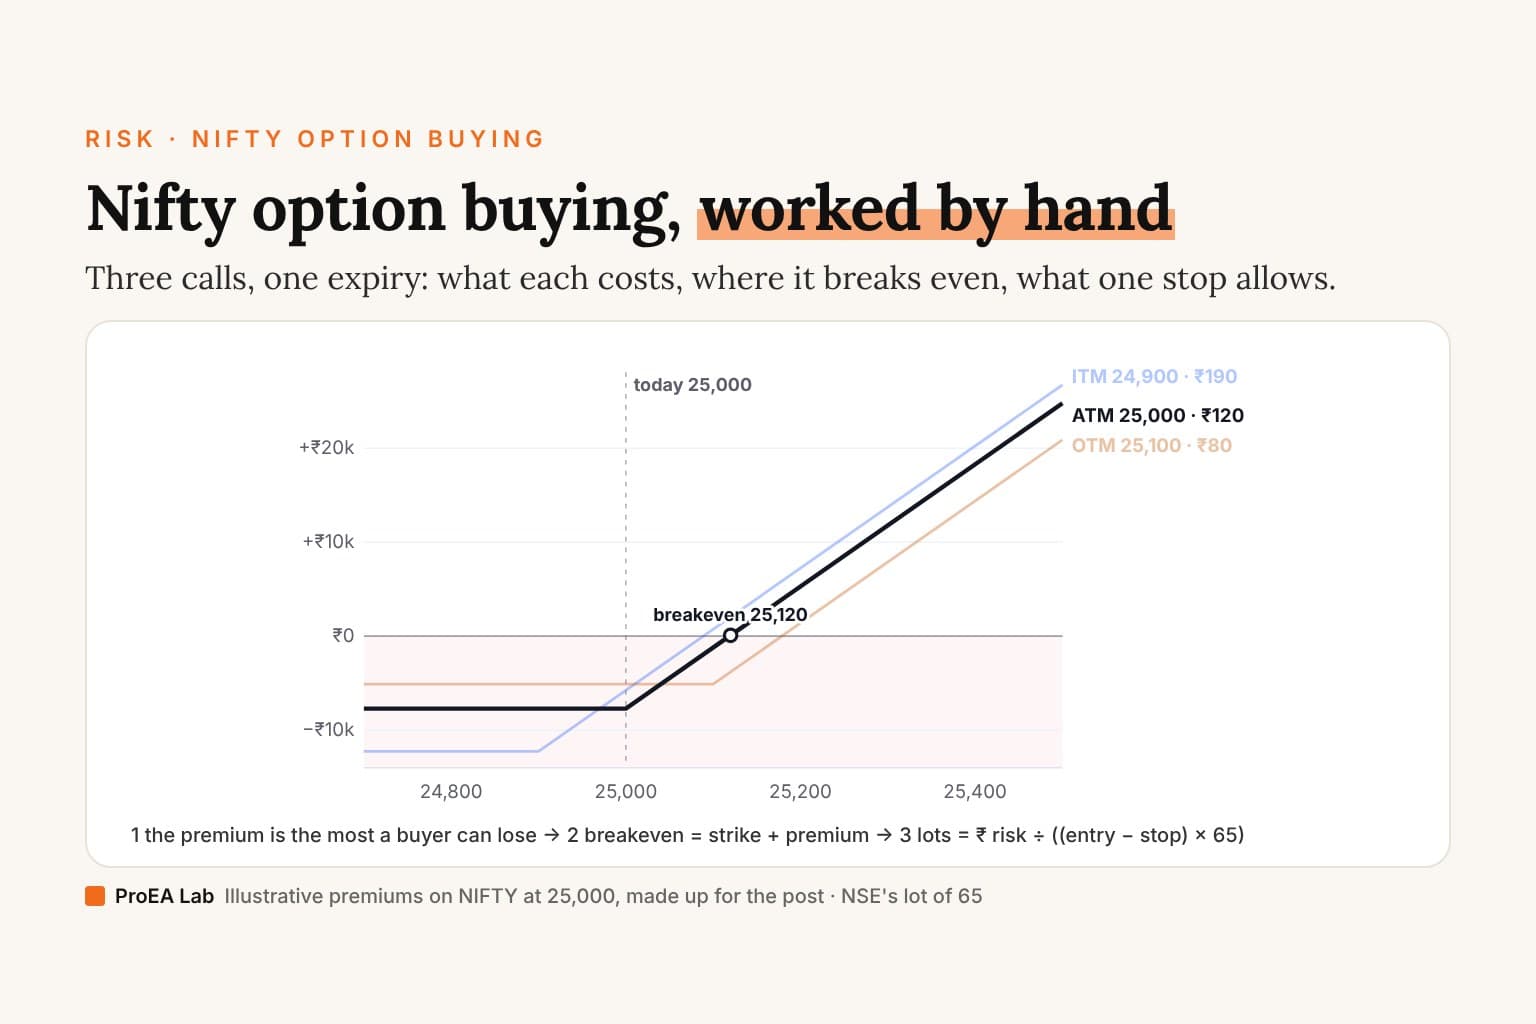
At expiry the call is worth only its intrinsic value, so it breaks even where that repays the premium: the strike + the premium. 25,000 + 120 = 25,120.
| NIFTY settles at | The call is worth | A lot makes, before costs |
|---|---|---|
| 24,950 | ₹0 | −₹7,800 |
| 25,000 | ₹0 | −₹7,800 |
| 25,120 | ₹120 | ₹0 |
| 25,200 | ₹200 | +₹5,200 |
A put mirrors it: a 25,000 PE bought at an illustrative ₹110 breaks even at 25,000 − 110 = 24,890. TradingView's options chain prints this as its "BE: Break-even price (the underlying asset's price at which the options strategy results in zero profit)" column, so you can check your arithmetic against it.
How to select strike price for option buying
Same morning, three calls. The premiums are illustrative; the arithmetic is the point.
| Call | Moneyness | Premium | Intrinsic | Time value | A lot costs | Breakeven at expiry | NIFTY must rise |
|---|---|---|---|---|---|---|---|
| 24,900 CE | In the money (ITM) | ₹190 | ₹100 | ₹90 | ₹12,350 | 25,090 | 90 points, 0.36% |
| 25,000 CE | At the money (ATM) | ₹120 | ₹0 | ₹120 | ₹7,800 | 25,120 | 120 points, 0.48% |
| 25,100 CE | Out of the money (OTM) | ₹80 | ₹0 | ₹80 | ₹5,200 | 25,180 | 180 points, 0.72% |
The trade-offs, row by row:
- The premium a lot. ITM costs the most, OTM the least. Cheaper isn't safer: it's a smaller amount on a longer shot.
- How far NIFTY must move. OTM needs 180 points by expiry just to break even, ITM 90. Part of what you pay for ITM is ₹100 of intrinsic value it already has.
- How much the premium follows NIFTY. TradingView's delta page: "In-the-money call options, where the strike price is significantly below the current price of the underlying asset, generally have delta values closer to 1", while "out-of-the-money call options, where the strike price is above the current price of the underlying asset, typically have delta values closer to 0." Illustrative deltas this morning: 0.6, 0.5 and 0.4.
- What time takes if NIFTY doesn't move. Each call loses its time value by expiry: ₹90 × 65 = ₹5,850 a lot on the ITM call, ₹7,800 on the ATM call, ₹80 × 65 = ₹5,200 on the OTM call. The ITM call keeps its ₹100 of intrinsic value; the other two keep nothing.
Size from a stop on the premium
Say the trade is wrong if NIFTY falls 60 points. By each call's delta, that's roughly a ₹36 fall in the ITM premium (0.6 × 60), ₹30 in the ATM (0.5 × 60) and ₹24 in the OTM (0.4 × 60), so the premium stops are ₹154, ₹90 and ₹56. Then size each from the rupees you'll risk, 1% of ₹5,00,000, or ₹5,000:
lots = ₹5,000 ÷ ((entry premium − stop premium) × 65), rounded down
| Call | Premium stop | Risk a lot at the stop | Lots for ₹5,000 | Lost at the stop | Premium paid |
|---|---|---|---|---|---|
| 24,900 CE | ₹190 → ₹154 | ₹2,340 | 2 (2.13) | ₹4,680 | ₹24,700 |
| 25,000 CE | ₹120 → ₹90 | ₹1,950 | 2 (2.56) | ₹3,900 | ₹15,600 |
| 25,100 CE | ₹80 → ₹56 | ₹1,560 | 3 (3.20) | ₹4,680 | ₹15,600 |
What the table shows:
- One chart stop is a different rupee stop on each strike. The OTM call's smaller risk a lot buys 3 lots, and those 3 lose the same ₹4,680 at the stop as the ITM call's 2.
- Round down, never up. 2.56 lots is 2. If one lot already risks more than your budget, the answer is 0 lots.
- The premium stop fires on time as well as price. If NIFTY sits at 25,000, each premium drains toward its intrinsic value: the ATM call from ₹120 toward ₹0, through its ₹90 stop, without NIFTY ever falling 60 points.
- The delta step is approximate. Delta itself moves as NIFTY moves, and a fast market can fill a stop worse than its price. The sizing uses the premium stop you actually set.
The Nifty position size calculator does this division for you and opens on the ATM row: ₹5,00,000 at 1%, a NIFTY option bought at ₹120 with a stop at ₹90, 2 lots, ₹3,900 lost at the stop and ₹15,600 in premium. Pick a strike and move NIFTY's settle:
25,000 CE bought at ₹120 (₹7,800 a lot). NIFTY settles at 25,200: it's worth ₹200, +₹5,200 a lot.
Breakeven 25,120, 120 points above this morning's 25,000. Sized for ₹5,000 at a 60-point index stop (premium stop ₹90): 2 lots, ₹3,900 at the stop, ₹15,600 in premium.
Illustrative: NIFTY at 25,000 with four days to a Tuesday expiry, and premiums, deltas and stops we made up to show the arithmetic. Not quotes, not market data and not advice. Brokerage, taxes and slippage are left out.
Our desk doesn't pick a strike
Signal Desk, our entry checklist indicator in Pine Pro Library, can label its signals for an option buyer, and its page says exactly how far that goes: "On an index/futures chart, Both with mapping on labels longs BUY CE and shorts BUY PE."
Then the limits, in the page's words: "Mapping formats a strike and expiry label. It does not read an option chain, premiums, Greeks or available expiries. Index-derived levels remain index prices. Quantity is an input, not automatic risk sizing." And: "An EXIT message recalculates its strike from the current price rather than preserving the entry strike. Treat it as descriptive data; it cannot by itself identify the original option contract for execution."
The strike on the label is arithmetic, not a choice. The code rounds the candle's close to your strike spacing, 50 by default, and moves it by the offset you set, whose tooltip reads: "0 = at the money. +1 = one strike out of the money, −1 = one strike in the money." Whether to buy ITM, ATM or OTM is your decision, made with the table above. So is the size: type your own quantity, lots × 65.
"Why option selling is better than option buying": what SEBI's study found
That's a popular search, and SEBI's own study is the place to check it. "Trading Behaviour of Individual Traders in the Equity Derivatives Segment" (study period FY25–FY26, dated August 2026; we read the PDF on 29 October 2026) sorts traders by what they did on most of their trading days. From its Section 1: "This section examines trading outcomes based on whether traders predominantly bought options, sold options, or traded futures. The analysis uses a random sample of 5,050 individual traders drawn from the 1.23 crore unique individuals who traded in the EDS during FY25–FY26."
Its two ends are "‘Only Options Buyers’", who bought options first on every trading day, and "‘Majorly Options Sellers’ – means Options Selling (first leg of transaction) on >= 50% of trading days". From its Table 5 (net P&L in ₹ lakh) and Table 8, for FY26:
| SEBI's category, FY26 | Traders in the sample | Loss-makers | Net P&L | Avg. P&L/Person | Median return on peak margin |
|---|---|---|---|---|---|
| Only Options Buyer | 4,634 | 89.9% | −₹5,928 lakh | −₹1,27,934 | -114% |
| Majorly Options Seller | 105 | 43.8% | −₹5,430 lakh | −₹51,70,985 | +1% |
What SEBI wrote about it:
- "‘Majorly Options Sellers’ had a relatively lower incidence of losses, but did not make an aggregate profit."
- "The findings highlight the asymmetric risk profile of options selling: a relatively lower incidence of losses coexists with much higher loss severity among those who do incur losses."
- "‘Majorly Options Sellers’ recorded the relatively better median returns, improving from -0.4% in FY25 to +1% in FY26. They were the only category with a positive median return in FY26."
- And its concluding observation: "Options buying remains the dominant trading strategy among individual investors and continues to be associated with significantly weaker outcomes than option selling."
What the study didn't measure, by its own account:
- Cause. "The study does not seek to establish that a particular trading behaviour caused a particular outcome." Its findings are associations across traders.
- A large group of sellers. 105 Majorly Options Sellers traded in FY26's sample. SEBI: "Results for the smaller categories, particularly Majorly Options Sellers and Majorly Futures Traders, should be interpreted with caution given the low observation counts".
- Strategies. The categories count days spent short, not methods. The study doesn't separate a hedged spread from a naked short, intraday from overnight, or index options from stock options, and it tests no rule.
- Return on money at risk. The median return divides by the year's highest peak margin, and SEBI says to read it "as returns relative to peak margin utilised, rather than as conventional portfolio returns." Our reading of the next section: a buyer's margin is the premium and a seller's is SPAN plus the extreme loss margin, so the two categories are divided by different kinds of number.
One more check. SEBI's text calls the sellers' ₹51.7 lakh their "average loss per loss-making trader", but Table 5's −₹51,70,985 is the category's net P&L divided by all 105 sellers, not by its 46 loss-makers. We print the table's column as the table names it.
So the honest answer: in SEBI's sample, sellers lost money less often and had a better median return on margin, but they lost money as a group, lost far more per person, were few, and the study says it doesn't show why. Selling isn't shown to be better; it's a different risk. The SEBI study's numbers on buyers, and the expiry-day turnover behind them, are also in our Nifty option buying indicator roundup.
Why a seller posts margin and a buyer pays the premium
The margin difference comes from who can lose how much, and NSE's and SEBI's rules say so directly.
The buyer pays the premium, upfront. Since February 01, 2025, SEBI has had brokers collect it before the trade, "In order to avoid any undue intraday leverage to the end-client". The premium is also the buyer's most: ₹7,800 a lot on the ATM call.
The seller posts margin, because the seller's loss has no cap. NSE's margins page redirects to NSE Clearing's, which says it "uses the SPAN ® (Standard Portfolio Analysis of Risk) system for the purpose of margining", and that in SPAN "only sell positions are margined and offsetting benefits for buy positions are given to the extent of long positions in the portfolio by computing the net option value." On top of SPAN comes an extreme loss margin (ELM) of "2% of the notional value" for index derivatives, where the notional of a short option is "the value of underlying index".
Worked on one lot at the illustrative 25,000:
- Notional: 25,000 × 65 = ₹16,25,000.
- ELM alone: 2% × ₹16,25,000 = ₹32,500, before SPAN.
- On expiry day, "an additional extreme loss margin of 2% shall be levied on short index options contracts", another ₹32,500. SEBI's circular gives the reason: "ELM is levied with the view to cover tail risk outside the scanning risk."
- The buyer of the same call: ₹7,800, and nothing more.
Why the gap: the seller of the 25,000 CE takes ₹120 and owes whatever NIFTY settles above 25,000. If it settles at 25,500, the call is worth ₹500 and the seller loses (500 − 120) × 65 = ₹24,700 a lot; the buyer makes the same, before costs. NSE Clearing describes the case its margin is built for: "unusually large underlying price changes may cause these options to move into-the-money, thus creating large losses to the holders of short option positions." Margin sizes the seller's possible loss. It says nothing about which side is the better trade.
Option buying strategies: what a plan has to say
Search for option buying strategies and you'll find setups. A strategy you can actually follow is a plan with five parts, each written down before the open:
- The direction. A rule on the NIFTY chart you can check on a closed candle: a trend and pullback, a breakout, whatever you can state. The rule decides call or put.
- The strike and the expiry. The table above: how much you pay a lot against how far NIFTY must move. Expiry day is its own case. SEBI's 2024 circular: "Expiry day trading in index options, at a time when option premium are low, is largely speculative."
- The size. From the premium stop: lots = your ₹ risk ÷ ((entry − stop) × 65), rounded down.
- The exit. A stop on the premium, a target, and a time: the premium stop fires on decay as well as on price.
- The day's limits. How many entries, and how much loss, before you stop for the day. That's the next section.
None of the five is a promise. Each is a decision you can check at the close.
Nifty option buying strategy: the daily cap and the loss lock
SEBI's same study: "High trading intensity relative to available capital was consistently associated with poorer trading outcomes." That's an association, not a test of a cap, but it's the reason to decide the day's limits before the day decides them:
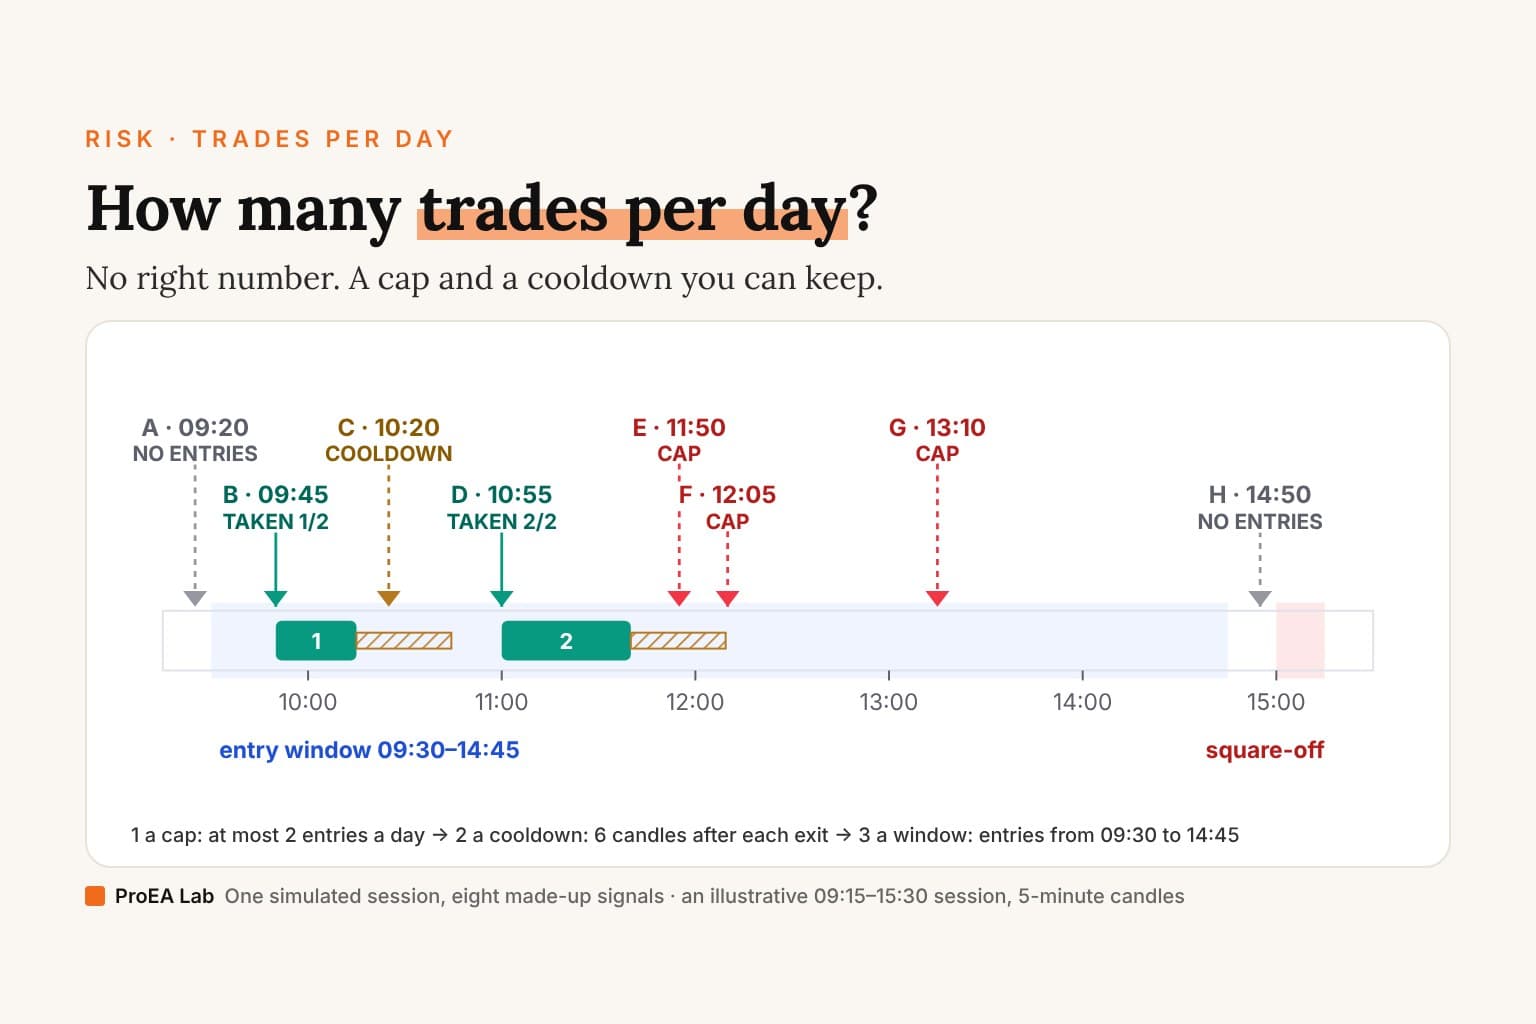
- A cap on entries. Signal Desk was "Built for an options buyer who wanted fewer signals after oversized candles", and its page says: "The default allows at most two entries a day; some days have none." How many trades per day works a cap and a cooldown through one simulated session, with SEBI's figures on days traded.
- A loss lock, in R. With the ATM call sized above, 1R is ₹3,900, the loss at the stop. A −2R lock is ₹7,800 for the day: two full stops, then nothing until tomorrow. Daily loss limit sets one up at Dhan and Zerodha in their own words, and on the chart.
Signal Desk Premium: the day's limits on your chart
Signal Desk Premium, $49 once, is the library desk's entry checklist with a heads-up before the signal, a trade ticket sized from your risk, scale-outs, a daily lock and a 20-market Radar with one alert on a paid TradingView plan, plus a relay to Telegram and Discord. For a Nifty option buyer, the parts that matter are the day's limits:
- "By default the day locks at −2R net. Set a money amount instead, or 0 to switch it off."
- "A second lock trips after 3 losses in a row today, whatever the net."
- Locked means "No entries until the next exchange day. The dashboard reads LOCKED, and Ticket-text and JSON alerts say so."
- The Radar has ready lists, including NSE India: "Ready lists: mixed global, US large caps, index ETFs and futures, FX, crypto, metals, energy and grains, NSE India. Or type your own 19."
What it doesn't do for an option buyer, plainly:
- It picks no strike and reads no option. It uses the library desk's entries, so the CE and PE labels and their limits above are the same.
- Its ticket sizes the chart's own instrument: "Risk ÷ (stop distance × money per point), rounded down." On the NIFTY index chart that sizes the index, not a call's lots. For lots, size from your premium stop with the calculator.
- Option charts are unchecked. Its page: "Not checked by us: a live webhook delivery end to end, and option-premium charts."
- It never places orders. The lock stops the desk's own entries, not your broker account, so pair it with your broker's limit.
- Its alerts need a paid TradingView plan. TradingView's pricing row "Active technical alerts on indicators, strategies, and drawings" reads ✗ on Basic, 20 on Essential, 100 on Plus, 400 on Premium and 1,000 on Ultimate (read 29 October 2026).
Premium uses the same entries as the library desk. It does not promise better results; it makes the same signals easier to prepare for, size, manage, filter and act on.
Sources
- SEBI, "Trading Behaviour of Individual Traders in the Equity Derivatives Segment" (FY25–FY26, August 2026), PDF: Section 1, 4.3, 4.4, 5.1, 5.2, 5.5, Tables 4, 5 and 8 and the concluding observations, read 29 October 2026.
- SEBI circular SEBI/HO/MRD/TPD-1/P/CIR/2024/132, October 01, 2024, PDF: 5.1, 5.5.1 and 5.6.1.
- NSE, Nifty 50 equity derivatives (updated 23/09/2025) and its market lots file; NSE Clearing, Margins (updated 09/03/2026) and NSCCL SPAN, read 29 October 2026.
- TradingView help: Intrinsic and time value of an option, Theta, Delta, Options chain overview and the pricing page's alert rows, read 29 October 2026.
- Signal Desk's library page and its Pine source (the options mapping inputs); Signal Desk Premium's page.
- The worked example:
src/components/blog/nifty-option-buying/strikes.ts, illustrative premiums sized by the Nifty position size calculator's own function.
Disclosure
We, ProEA Lab, build Signal Desk and Signal Desk Premium and sell them. The code is AI-assisted. NIFTY at 25,000 and every premium, delta, theta and stop on this page are illustrative, made up to show the arithmetic; they are not quotes, market data or a result. NSE's, SEBI's and TradingView's pages are quoted as read on 29 October 2026 and can change. Nothing here is advice. Trading involves risk.
Frequently asked questions
What is option buying?
Paying a premium for the right, not the obligation, to buy at the strike (a call, CE) or to sell at it (a put, PE) until expiry. NSE describes the buyer as paying a fee for a privilege and the seller as receiving a fee for an obligation. The most a buyer can lose is the premium: an illustrative ₹120 on a NIFTY lot of 65 is ₹7,800.
How to select strike price for option buying?
Weigh three things: the premium a lot, how far NIFTY must move to break even, and how many lots your stop allows. In our illustrative example, with NIFTY at 25,000, the 24,900 call costs ₹12,350 a lot and breaks even 90 points up, the 25,000 call ₹7,800 and 120 points, the 25,100 call ₹5,200 and 180 points. None of them is better in general.
Is option selling better than option buying?
SEBI's study doesn't show that. In its FY26 sample, 43.8% of the 105 Majorly Options Sellers lost money against 89.9% of Only Options Buyers, but the sellers lost money as a group, their average P&L per person was −₹51,70,985 against −₹1,27,934, and SEBI says the study does not establish cause.
Why do option sellers need more margin than buyers?
A buyer's loss stops at the premium, which SEBI has required brokers to collect upfront since February 2025. A seller's loss has no cap, so NSE Clearing margins short options with SPAN plus an extreme loss margin of 2% of the index's value: ₹32,500 a NIFTY lot at an illustrative 25,000, before SPAN, and 2% more on expiry day.
What is the breakeven of a Nifty call option at expiry?
The strike plus the premium paid. A 25,000 call bought at an illustrative ₹120 breaks even at 25,120 at expiry. If NIFTY settles at or below 25,000, it expires worth nothing and the whole ₹7,800 a lot is gone. A put breaks even at the strike minus the premium.
How much does theta cost an option buyer?
Theta is what one day takes from the premium, other things equal. An illustrative theta of −₹16 on a NIFTY lot of 65 is ₹1,040 a day. If NIFTY sits at the strike until expiry, an at-the-money call loses its whole time value: ₹120 a unit, or ₹7,800 a lot, in our example.
Does Signal Desk pick the strike for me?
No. With options mapping on, its label rounds the index price to your strike spacing, 50 by default, and moves it by the offset you set. It does not read an option chain, premiums, Greeks or available expiries, and its levels stay index prices.