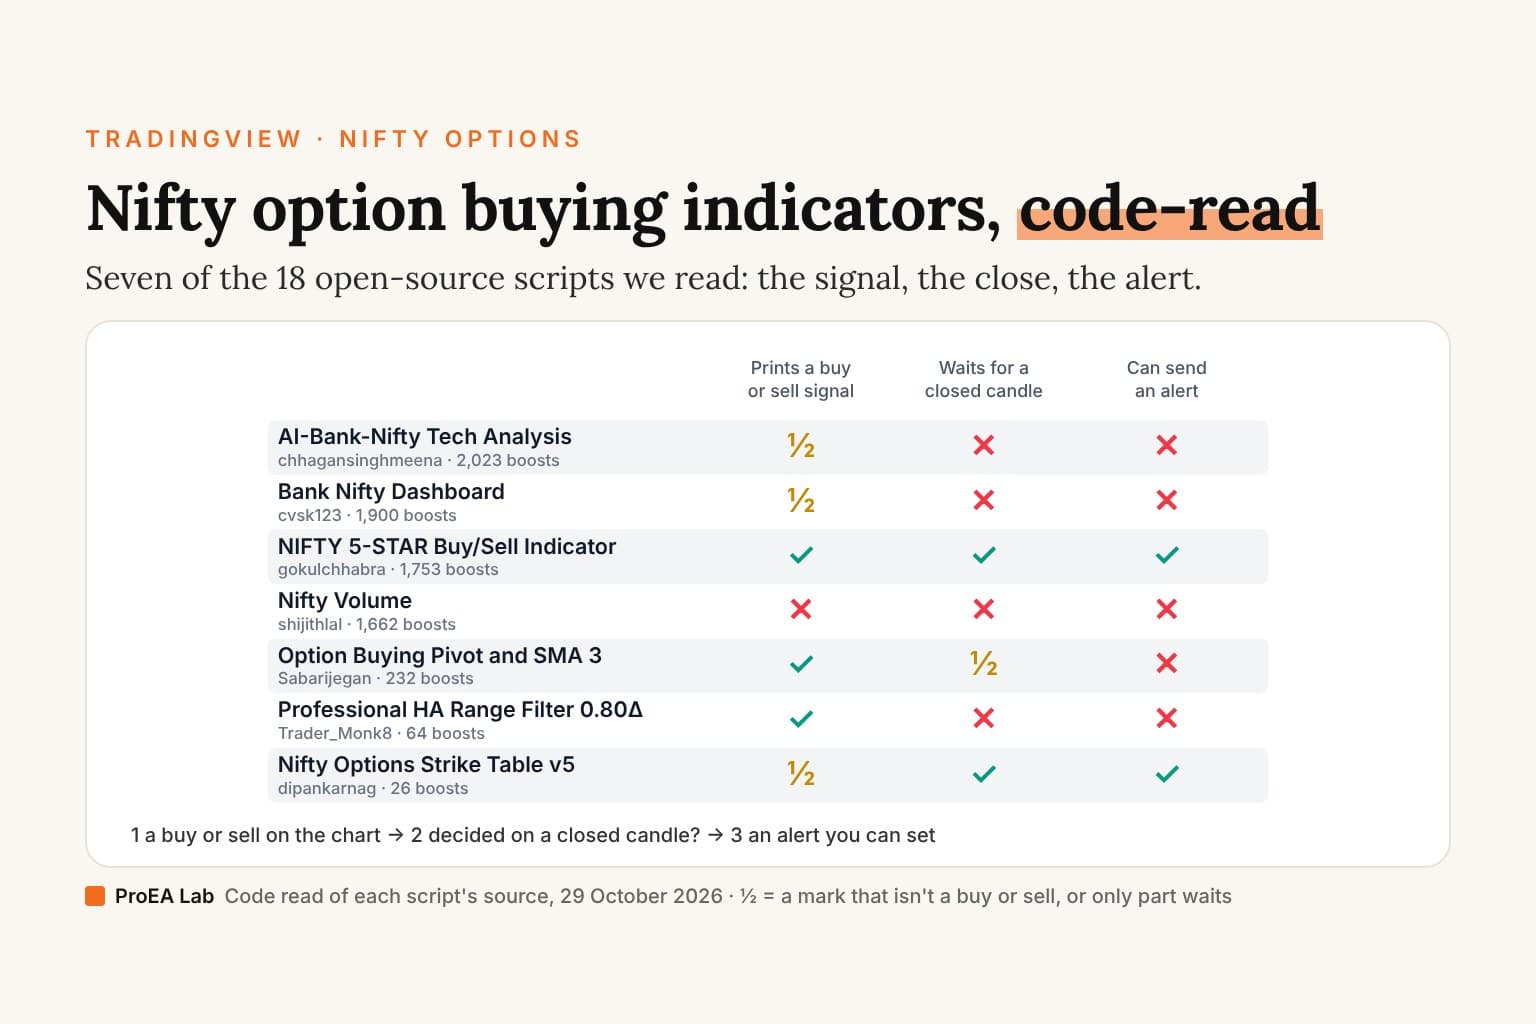
Short answer: no indicator changes the base rate SEBI measured. In its study of FY26, "93% of traders were classified as ‘Only Options Buyers’", and "90% of ‘Only Options Buyers’" incurred losses. Of the 18 open-source Nifty and option scripts in TradingView's search that we read line by line, 10 mark a buy or sell signal of some kind, from labels and dots to coloured cells; the other eight draw dashboards, volume, levels or expiry days without one. The most complete free signal is gokulchhabra's NIFTY 5-STAR Buy/Sell Indicator (1,753 boosts): one signal a day, decided on a closed candle, with a stop, one target and two alerts. Like every script here, it reads the index or futures chart, not an option's premium, and we tested none of them.
Most lists name Nifty indicators.
This one reads them.
What SEBI found about option buyers
SEBI's Department of Economic and Policy Analysis published two studies of individual traders in the equity derivatives segment for FY25 and FY26 (the profitability study is dated August 2026; we read both PDFs on 29 October 2026). From "Trading Behaviour of Individual Traders in the Equity Derivatives Segment":
- "In FY26, 93% of traders were classified as ‘Only Options Buyers’, while a further 4% were ‘Majorly Options Buyers’."
- "Options buying was associated with high loss incidence." In FY26, "90% of ‘Only Options Buyers’" incurred losses.
- "High trading intensity relative to available capital was consistently associated with poorer trading outcomes."
From "Profitability of Individual Traders in the Equity Derivatives Segment (FY25–FY26)":
- "The share of loss-making individuals declined 3.2 percentage points, to 87.7% in FY26 from 90.9% in FY25."
- "Options trading accounted for 92% of aggregate individual losses."
- "In FY25, 70% of turnover occurred on the expiry day itself (‘0DTE’)". SEBI says that share moderated to 59% in FY26, after its measures.
These describe what happened to traders. They aren't a test of any indicator, and nothing below changes them.
Nifty options in 2026: the lot, the expiry and the weekly contract
Three facts the scripts below depend on, from NSE and SEBI:
- The lot is 65. NSE's current lot file (
fo_mktlots.csv, read 29 October 2026) shows NIFTY at 65 for every contract listed, and BANKNIFTY at 30. NSE's circular FAOP70616 (dated October 03, 2025) set the revised lot from the "06-Jan-2026" weekly expiry and the "27-Jan-2026" monthly one. - Expiry is on Tuesday. NSE circular FAOP68589 (June 17, 2025): "To change the expiry day of the derivatives contracts which expire on or after September 01, 2025 to Tuesday. Further, from September 01, 2025, the monthly contracts would expire on the last Tuesday of the month."
- One weekly index. SEBI's circular of October 01, 2024: "Henceforth, each exchange may provide derivatives contracts for only one of its benchmark index with weekly expiry." It took effect from "November 20, 2024"; on NSE that index is NIFTY.
What we checked
We searched TradingView's scripts for 21 terms on 29 October 2026, from "nifty options" and "option buying" to "buy sell signal", which returned 504 scripts. 66 have Nifty in their name, 43 of them open source, and 32 have Option, 10 of them open source. We read the eight most-boosted open-source Nifty scripts, down to 823 boosts, with none skipped, and all 10 open-source Option scripts: 18 in all. For each, every line that draws something or decides a signal, and six questions:
- What it draws: lines, a table, labels?
- The signal: is there a buy or sell, and what triggers it?
- When it decides: on a closed candle, or on the live one?
- Repainting: does it read another timeframe or a future candle, or draw something back in time?
- Alerts: what can it send you?
- Options: does it read an option contract, or only the index?
The most-boosted closed scripts with Nifty or Option in their name are Novice_Hedge's invite-only DD Nifty Zone Marker (1,294 boosts), then TradingFinder's protected "Binary Options 1 Minute Signals" and CrazyKishore74's protected "Vwap Pvwap Intraday Trend - NiftyKishore" (1,001 each). Their code is closed, so we can't read it.
The table
Boosts as TradingView's search showed them on 29 October 2026.
| Script | Boosts | What it draws | A buy or sell signal | Decides on | Alerts |
|---|---|---|---|---|---|
| AI-Bank-Nifty Tech Analysis (chhagansinghmeena) | 2,023 | A table of 13 rows, Buy, Sell or Neutral per indicator, and one average | "AI Bullish" and "AI Bearish" labels, off by default | The live candle | None |
| Bank Nifty Dashboard (cvsk123) | 1,900 | Two tables, a Supertrend, VWAP and volume triangles | Dots where the Supertrend flips | The live candle | None |
| NIFTY 5-STAR Buy/Sell Indicator / Entry, SL & Targets (gokulchhabra) | 1,753 | EMA 21, VWAP, VWMA 20, a trailing line, and a stop and one target per signal | Strong BUY or Strong SELL, one a day | A closed candle, by default | STRONG_BUY, STRONG_SELL |
| Nifty Volume (shijithlal) | 1,662 | 40 Nifty stocks' weighted volume, as columns | None | — | None |
| Nifty Volume profile + VWAP + EMA (Wealth_Guide) | 1,007 | A VWAP on 40 stocks' volume, EMA 8 and EMA 5; no volume profile | LONG and SHORT crosses | A closed candle | None |
| Bank Nifty Volume (shijithlal) | 968 | 12 banks' weighted volume, as columns | None | — | None |
| Bank Nifty Scalping (DanSib) | 877 | EMAs, VWAP, Supertrend, CPR, Camarilla and the previous day's high and low | None | — | Inside Bar, with inside bars on |
| Nifty Participants - Top 10 (QuantCreative) | 823 | A table of Nifty's top stocks and their points in the index's move | None | — | None |
| Options Scalping Nifty (OptionsScalper123) | 628 | A table of indices and five stocks: the change on the day, 15 minutes and 1 hour | None | — | None |
| Option Buying Pivot and SMA 3 Pivot crossover (Sabarijegan) | 232 | The last candle's pivot, its 3-candle average and two levels | "Buy Call" or "Buy Put" on every candle but a tie | The open; Win and Loss on the live candle | None |
| IntraEdgeV2 for Nifty, Sensex, BankNifty, Options Trading (muralikumar) | 136 | A session kit in more than 5,000 lines: opening range, VWAP, volume profile, sweeps, an expiry panel | Many events, no single buy or sell | Mixed | 38 conditions |
| Professional HA Range Filter NIFTY 50 OPTIONS 0.80 DELTA (Trader_Monk8) | 64 | A range filter on Heikin Ashi closes, 30-point target and stop lines | BUY or SELL | The live candle | None |
| Nifty Options Trendy Markets with TSL (carefulSalami20010) | 54 | A strategy: a Bollinger Band breakout with ADX, volume and Supertrend | Long and short entries | A closed candle | Order fills only: its four alertcondition() lines make none |
| NIFTY Options Framework (distinctSeahor20287) | 27 | A pane: a regime, lots from India VIX, a spread to sell | None for a buyer | — | None |
| Nifty Options Strike Table v5 (dipankarnag) | 26 | 22 option contracts around the money, coloured by their own crosses | Coloured cells | A closed candle | Four |
| NIFTY, SENSEX AND BANKNIFTY Options Expiry Marker (shreyasss) | 25 | A shaded background on expiry days | None | — | None |
| Nifty Options Strike Table with MACD/VWAP/MA Alerts (dipankarnag) | 22 | A strike table lit from the futures chart's own MACD and crosses | OPT SIG | A closed candle | Four |
| Nifty Options Strike Table v4 (dipankarnag) | 12 | Like v5, with the expiry typed in by hand | Coloured cells | A closed candle | Four |
Several of the 18 mark entries on the chart, as labels, dots or a strategy's orders, but only NIFTY 5-STAR draws a stop and a target, waits for the close and can alert you. Two of the strike tables, v4 and v5, are the only scripts that read an option contract.
What the code says
chhagansinghmeena's AI-Bank-Nifty Tech Analysis is a dashboard, and its "AI" is out of sight. It draws one average, the "CPMA", and a table of 13 rows: India VIX, the Dow (or SGX Nifty when you switch it to Nifty), ten index stocks and your chart's symbol, each marked Buy, Sell or Neutral for an Alligator, VWAP, the CPMA, ADX, RSI, MFI, MACD, FRAMA and three Supertrends. Those readings, and the "AI Bullish" and "AI Bearish" labels (off by default), come from functions in the author's library, BankNifty_CSM, which the census didn't save, so we can't say how they decide. What the script shows: a label needs the library's candle pattern and the previous close on the right side of the CPMA, and nothing in it waits for the candle to close. No alerts. Pine v5, MPL 2.0.
cvsk123's Bank Nifty Dashboard reads the banks, not the options. Its first table lists the Dow (CAPITALCOM:US30), India VIX and eight Bank Nifty banks with the day's change and the change since the last 15-minute and 60-minute close. The second puts VWAP, a 20 EMA, Supertrend, RSI, ADX and DI on the chart's timeframe, 15 minutes and 60 minutes. On the chart: a Supertrend (factor 2, ATR 10) with a dot where it flips, VWAP, and a triangle at the bottom on any candle whose volume is at least 40,000 on BANKNIFTY1! (100,000 on NIFTY1!, the 20-candle average elsewhere), yellow when the close is on the wrong side of VWAP. The eight index weights it asks for (27.04 for HDFC Bank down to 1.98 for PNB) are never used. The flip dots are decided on the live candle. No alerts. Pine v5, MPL 2.0.
gokulchhabra's NIFTY 5-STAR is the only one with a plan and a closed-candle alert. A Strong BUY needs the close above all four lines it draws (EMA 21, VWAP, VWMA 20 and its own trailing line, ATR 10 × 3) and a 3-minute volume of at least 125,000; Strong SELL mirrors it. Its input "Only alert on bar close", on by default, makes the signal itself wait for the close, not only the alert. Signals start at 9:31 and stop at 15:00 in the exchange's time, and only one comes a day, buy or sell. Each draws a short stop line at the trailing line and one target the same distance away: 1R. A comment calls it 1:2, but the code multiplies the risk by 1.0. Two alerts, STRONG_BUY and STRONG_SELL, send JSON, though its "volume_3m" field sends {{volume}}, the chart candle's volume, not the 3-minute one. On a chart without volume the volume test can't pass. Its levels are index or futures points; it reads no option. Pine v6, no licence line.
shijithlal's Nifty Volume and Bank Nifty Volume rebuild an index's volume. Each multiplies the volume of every stock it names by a weight typed into the code, 40 stocks for Nifty (12.86 for Reliance) and 12 banks for Bank Nifty, and draws the sum as columns coloured by the chart's candle. Nifty Volume's 40 stocks take 40 security() calls, the most TradingView's Pine limits allow outside the Ultimate plan: "A script can use up to 40 unique calls to the functions in the request.*() namespace, or up to 64 unique calls if the user has the Ultimate plan." No signal and no alert. Pine v4, no licence line.
Wealth_Guide's Nifty Volume profile + VWAP + EMA has no volume profile, and its LONG is a turn down. It weights 40 Nifty stocks' volume the same way, builds a 14-candle VWAP from it, and draws a "Fast EMA" of 8 and a "Slow EMA" of 5. LONG prints where the 8 crosses above the 5, which happens when the shorter average drops under the longer one: when price turns down. SHORT is the reverse. It's declared a strategy but places no orders, so the Strategy Tester has nothing to test. No alerts. Pine v4, MPL 2.0, © aashish2137.
DanSib's Bank Nifty Scalping is a toolbox without a signal. EMAs of 20 and 200 (50 and 100 hidden), a 9 EMA from the 5-minute chart, VWAP on hl2, a Supertrend (10, 2), VWMA 20, Camarilla R3, R4, S3 and S4, the day's CPR with S1 and R1, the previous day's high and low, Elder Impulse bar colours and blue squares on strong volume; a second Supertrend, Fibonacci pivots and inside-bar marks are there, switched off. Its daily levels take yesterday's values ([1] with lookahead on), so they hold still all day. The 5-minute EMA reads with lookahead off, so on a faster chart it follows the forming 5-minute candle live. Its one alert, Inside Bar, fires only with inside bars switched on. Pine v5, MPL 2.0.
QuantCreative's Nifty Participants - Top 10 is a table of who moved the index. Ten stocks with weights typed in as inputs (12.78% for HDFC Bank first), five rows shown by default, each with its price, change, change in percent, "Share" (the index level × the weight × the stock's change: its points in the index's move), daily RSI against 60 and 40, VWAP, and a volume spike at twice the 50-day average. No signal, no alert. Pine v6, no licence line.
OptionsScalper123's Options Scalping Nifty has nothing about options in it. It's one table: Bank Nifty, Nifty, FinNifty, the Dow (YM1!), India VIX and five stocks (Reliance, HDFC Bank, Infosys, TCS and ICICI Bank), with the price and the change on the day, over the last 15 minutes and over the last hour, read from 3-minute candles. A row titled "OI Pulse" has no data in it. Its 48 request.security() calls are more than the 40 the limits page allows outside Ultimate. No signal, no alert. Pine v5, no licence line.
Sabarijegan's Option Buying Pivot labels nearly every candle. It takes the last candle's pivot, (high + low + close) ÷ 3, and its 3-candle average. Where the pivot is above the average it prints "Buy Call"; below, "Buy Put". Despite the name, that isn't a crossover: a label lands on every candle but a tie. "Win Call" or "Loss Call" then compares the same candle's close with a level one range below the pivot, so it grades the candle the label sits on, not a trade. Its range also leaves out the absolute value a true range takes. The labels use only the last candle, so they're fixed at the open; the Win and Loss labels follow the live close. No alerts. Pine v5, MPL 2.0.
muralikumar's IntraEdgeV2 is a full session kit, not a buy-sell indicator. Version 28.9, in more than 5,000 lines, picks its mode from the chart (index, futures, options or stock) and draws the opening range, VWAP bands, a session volume profile from an imported library, liquidity sweeps, India VIX move bands, W and M patterns, order-flow divergences and an expiry-day panel you switch on by hand ("Today is Expiry Day ⚡"). Its "Max Pain Est ~" isn't read from option open interest: between 13:00 and 14:30 on the day you mark as expiry, the code takes the session's volume point of control, or the middle of a five-candle squeeze. It has 38 alert conditions; 7 ask for a closed candle in the alert line itself. Its daily, weekly and monthly levels are the previous bar's ([1] with lookahead on). Its 15- and 30-minute reads take live values with lookahead on, which on past candles hands each 5-minute candle the 15-minute candle's final high, low and close; its own comment says it acts on them only once both candles have closed. We didn't trace every line. Pine v6, no licence line.
Trader_Monk8's Professional HA Range Filter fixes the delta at 0.80. A range filter (sampling period 70, multiplier 2.5) runs on Heikin Ashi closes. BUY prints when the Heikin Ashi close crosses above the filter while the filter is rising; SELL mirrors it. Each signal sets a target and a stop 30 points away. Its panel shows the points since the last signal and "Option 0.8Δ PnL", the points × 0.80: a constant, not any option's delta. Nothing checks whether the target or the stop was hit, so the trade on the panel lasts until the opposite signal. Signals are decided on the live candle. No alerts. Pine v6, no licence line.
carefulSalami20010's Nifty Options Trendy Markets with TSL is a strategy whose trailing stop never fires. Long: a close crossing above the upper Bollinger Band (20, 2) with ADX above 25, volume over 1.5 times its 20-candle average and the close above Supertrend (10, 3); short mirrors it. Exits: a MACD cross, ADX under 20, or the "trailing stop", which is the close minus 1.5 ATR, recalculated from each candle's own close, so the close can never be under it. Its strategy( line sets no capital, size, commission or slippage. Its four alert lines ("Buy Call", "Buy Put", "Exit Call", "Exit Put") are alertcondition() calls, and TradingView's Pine documentation says: "While the presence of alertcondition() calls in a strategy script will not cause a compilation error, alerts cannot be created from them." What does alert is the strategy's own orders: "Order fill events require no special code for script users to create alerts on them". Pine v5, no licence line.
distinctSeahor20287's NIFTY Options Framework is for selling, not buying. In its own pane it sorts the market into regimes by the close's distance from EMA 20 in ATRs and by ADX, sizes "lots to trade" from India VIX (full size above 12 up to 20, half above 20 or at 12 and under, a quarter above 25) and halves it again when VIX minus the 20-period realized volatility, averaged over 7, is below zero, then names a structure: Bear Call Spread, Iron Condor or Bull Put Spread, all sold. It shows an expected move of close × VIX ÷ 100 ÷ √52, with strikes rounded to 50. Its "RV Period (days)" counts the chart's candles, so the volatility reads as daily only on a daily chart. No alerts. Pine v5, no licence line.
Two of dipankarnag's three strike tables read the option contracts, and v5 dates them by Thursday. v4 and v5 build the symbols of 11 strikes around the money, calls and puts, 22 contracts, and colour each cell when that contract's own MACD histogram turns positive with a cross above its VWAP or 20 EMA (yellow), both (pink), or one of them plus a pivot break (green), on a closed candle, for that candle and the next two. v4 needs the expiry typed in each week; its default dates from April 2025, by its own comment. v5 works the expiry out: its comment says "NSE Nifty 50 options expire every THURSDAY", and the code counts the days to the next Thursday. NSE moved Nifty expiries to Tuesday from 1 September 2025, and v5's holiday offset shifts the day by one either way, to Wednesday or Friday, so it can't reach Tuesday, and the symbols it builds name a day with no expiry. We didn't run it, so we can't say what the table then shows. The third, "with MACD/VWAP/MA Alerts", doesn't read options at all: it computes MACD and the crosses on the futures chart, and a bullish signal lights the call rows and the put rows together. All three have four alerts on closed candles. Pine v6, no licence line.
shreyasss's Options Expiry Marker shades expiry days. It colours the background on the weekday you pick: Tuesday by default for Nifty, monthly expiries (the last Tuesday of the month) on and weekly ones off. That matches NSE's circular from 1 September 2025. It paints the same weekday on every past date, including those before September 2025, when the expiry day was Thursday, and it knows no holidays. No signal, no alert. Pine v5, no licence line.
Repainting and the live candle
None of the 18 draws a value back in time with a negative offset; IntraEdgeV2 puts its W and M labels one candle back, on the low or high that made them, once the next candle confirms. What can still move:
- The live candle. The Supertrend flip dots, the Heikin Ashi range filter's BUY and SELL, the "AI" labels and the pivot script's Win and Loss labels are decided as the candle forms, so they can print and vanish before the close. NIFTY 5-STAR's signals, the strike tables' cells, carefulSalami20010's entries and Wealth_Guide's crosses wait for the close: both of those are strategies, and neither sets
calc_on_every_tick. - Another timeframe. A script that reads a higher timeframe with lookahead off follows that timeframe's forming candle live: DanSib's 5-minute EMA, cvsk123's 15- and 60-minute columns, and NIFTY 5-STAR's 3-minute volume on a chart faster than 3 minutes. TradingView's alerts page says a condition can change during the live bar with "any request.security() call using a higher timeframe than the chart's, when the higher timeframe's current bar has not closed yet". IntraEdgeV2's 15- and 30-minute reads use lookahead on with live values, which on past candles reads a candle before it closed; its comment says its gates wait for the close.
- Alerts. "Alerts only trigger in the realtime bar." TradingView's advice for the rest: "The simplest way to avoid this type of repainting is to configure the triggering frequency of alerts so they only trigger on the close of the realtime bar." Alerts on an indicator need a paid plan: TradingView's pricing page (read 29 October 2026) shows "Active technical alerts on indicators, strategies, and drawings" at ✗ / 20 / 100 / 400 / 1,000 for Basic, Essential, Plus, Premium and Ultimate, so none on Basic.
More on telling them apart in how to tell if an indicator repaints.
CE PE indicator on TradingView: what the labels know
Call and put buyers search for a "ce pe indicator", and the 18 scripts answer it in four different ways:
- Reading the contracts: dipankarnag's v4 and v5 strike tables request the option symbols themselves, so their signals come from each call's and put's own candles. v5's Thursday arithmetic is the catch.
- Labelling the index: Sabarijegan's "Buy Call" and "Buy Put" are words on the index chart; carefulSalami20010's alert texts say "Buy Call" too.
- Assuming a delta: Trader_Monk8's panel multiplies index points by 0.80.
- Selling: distinctSeahor20287's framework picks spreads to sell.
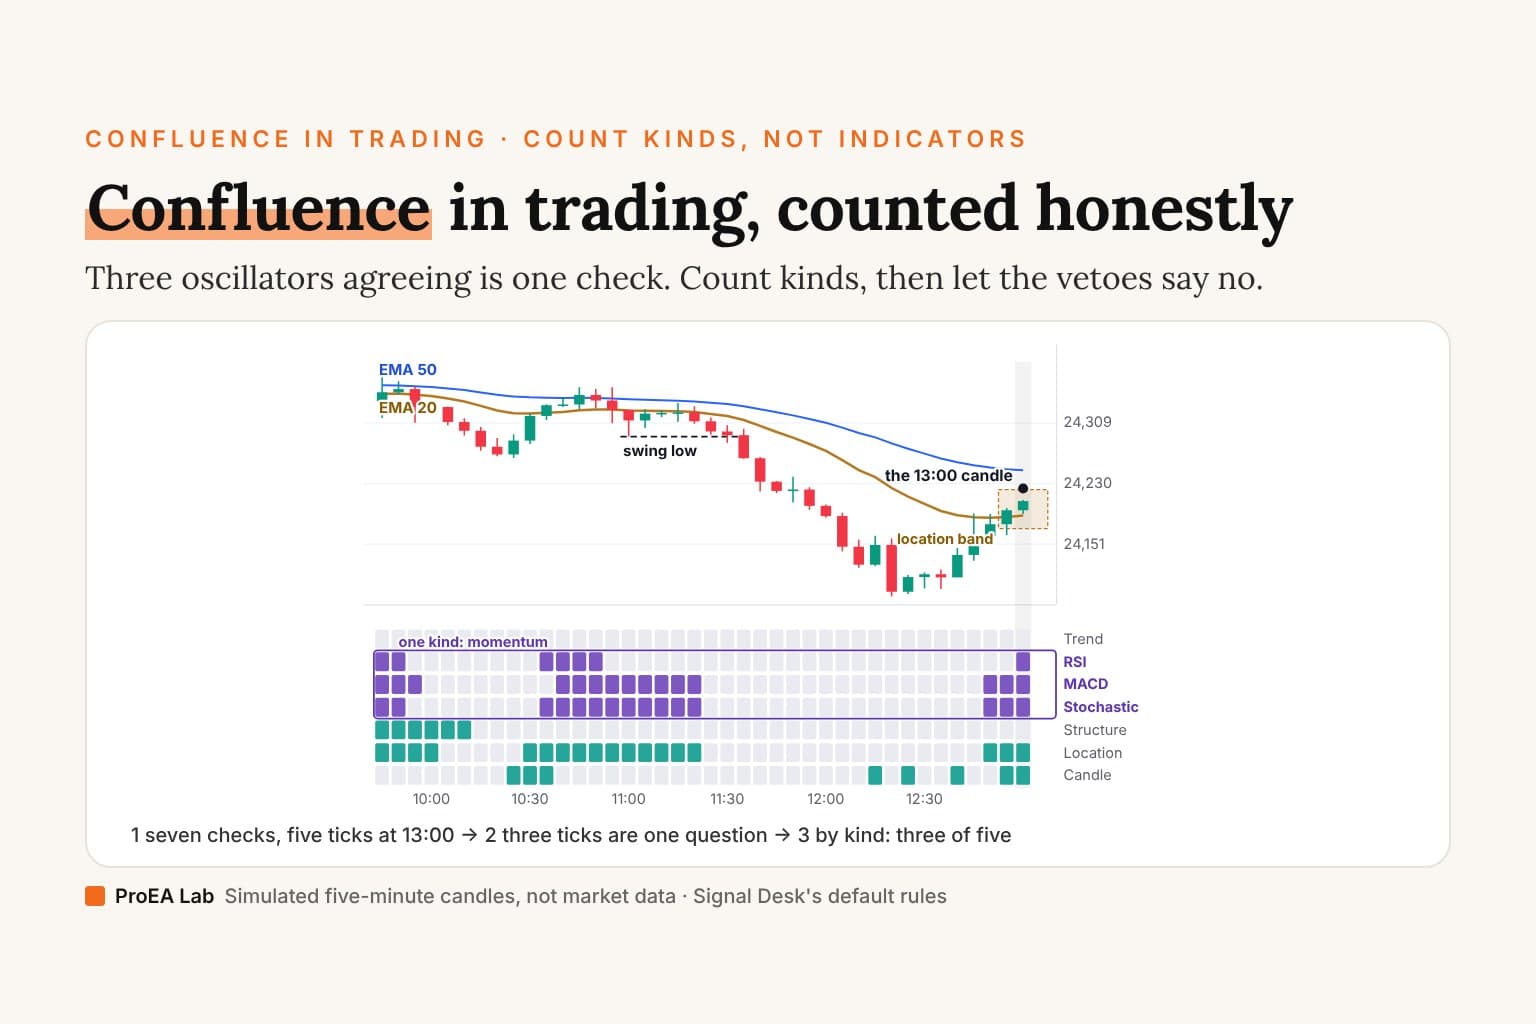
Our Signal Desk, the entry checklist desk in Pine Pro Library, labels the index side, and its page says what that means. "On an index/futures chart, Both with mapping on labels longs BUY CE and shorts BUY PE." Then the limits: "Mapping formats a strike and expiry label. It does not read an option chain, premiums, Greeks or available expiries. Index-derived levels remain index prices. Quantity is an input, not automatic risk sizing." And for the exit: "An EXIT message recalculates its strike from the current price rather than preserving the entry strike. Treat it as descriptive data; it cannot by itself identify the original option contract for execution." For a premium chart itself: "For studying purchases on a call or put premium chart, the tool’s intended configuration is Long only, mapping off." Its strike spacing defaults to 50 and the expiry label is blank until you type it.
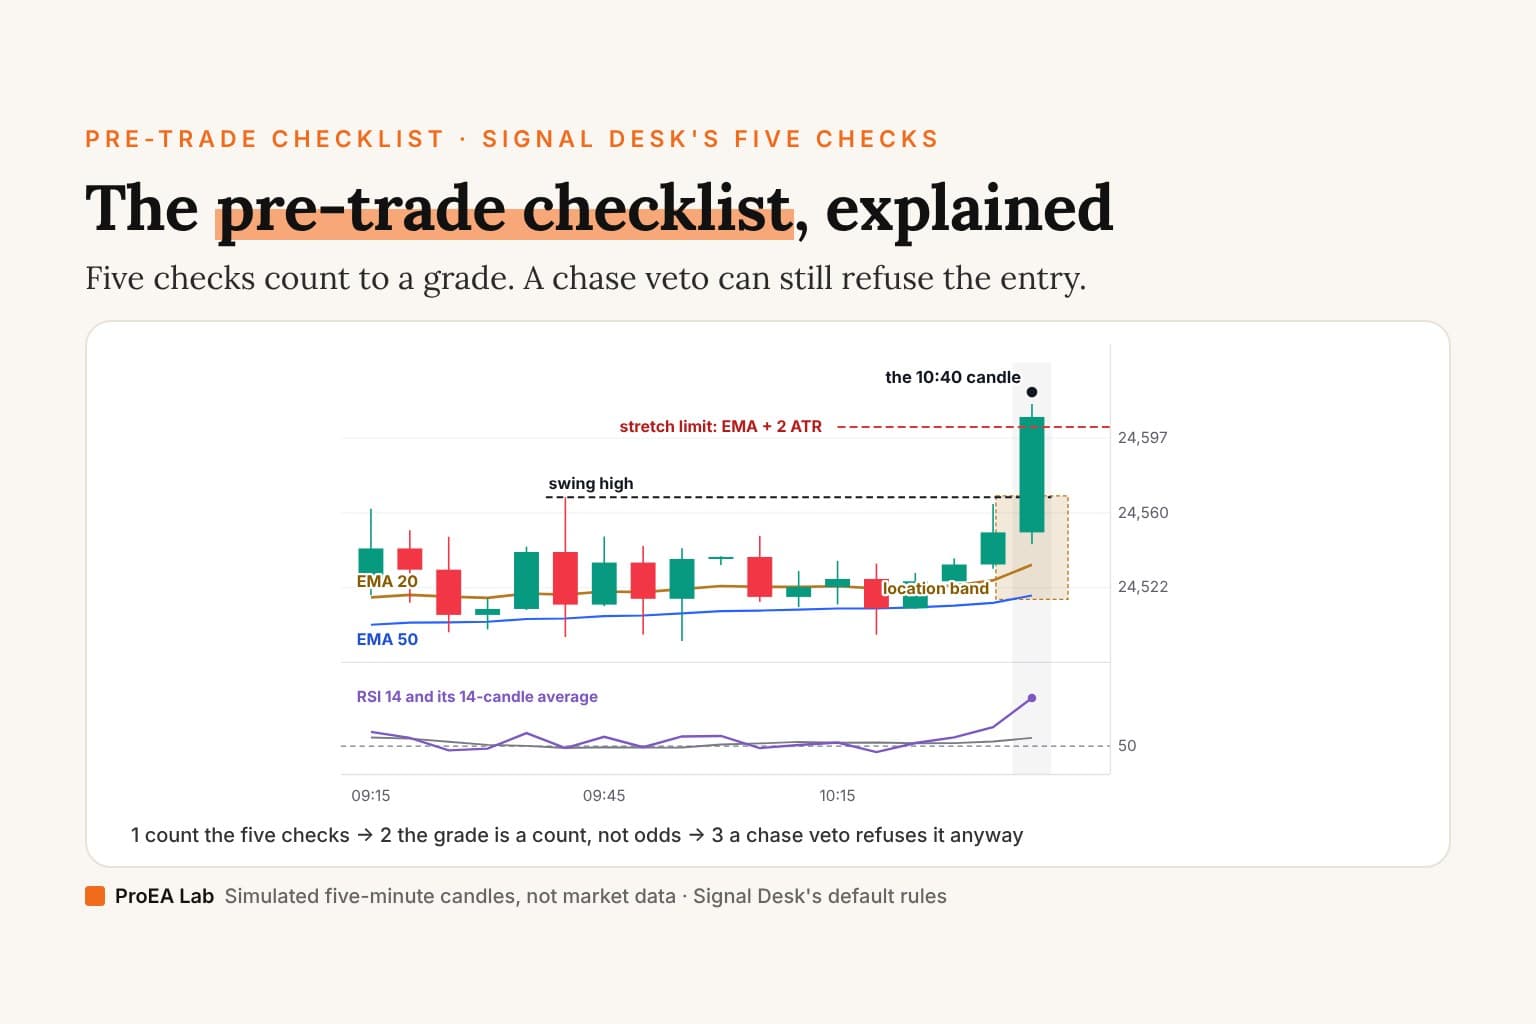
The rest of the desk: five setup checks graded on each pullback or breakout trigger, chase limits, at most two entries a day by default, a stop with 1R, 2R and 3R targets, and "Default entry times are 09:30 inclusive to 14:45 exclusive, Asia/Kolkata, based on candle opening times." "Entries commit on confirmed candles." Its alerts: "Choose Once Per Bar Close." Signal Desk is sold in Pine Pro Library, $49 once for every desk with its Pine source.
Signal Desk Premium, $49 once, uses the same entries and adds a trade ticket sized from your risk, scale-outs, a daily lock and a 20-market Radar with one alert. Its alerts need Essential or above, like any script's. Its page is plain about options too: "Not checked by us: a live webhook delivery end to end, and option-premium charts." And: "Premium uses the same entries as the library desk. It does not promise better results; it makes the same signals easier to prepare for, size, manage, filter and act on." What the desk did on NSE:NIFTY 5-minute candles with costs on is in Signal Desk: what we measured.
Which is the best free Nifty option buying indicator?
For a buy or sell signal you can act on, gokulchhabra's NIFTY 5-STAR Buy/Sell Indicator. Of the 18, it's the only one that waits for the close by default, gives one signal a day inside set hours, draws a stop and a target, and sends an alert. Know its limits before you use it:
- One signal a day, buy or sell, from 9:31 to 15:00. After it, the day is done, whatever happens.
- The target is 1R, the same distance as the stop, whatever its comment says.
- The volume rule needs a chart with volume.
- Its levels are index or futures points. Your option's premium moves by its own delta and decay, which no script here reads.
- Nothing tracks the trade after the signal, and it has no strategy twin to test it with costs.
For the expiry calendar, shreyasss's Options Expiry Marker matches NSE's Tuesday. For the option contracts themselves, only dipankarnag's v4 and v5 tables read them, and v4 is the one whose expiry you can set to a Tuesday, by typing it in each week; we didn't run either. The two most-boosted, AI-Bank-Nifty and Bank Nifty Dashboard, are dashboards: context, not signals.
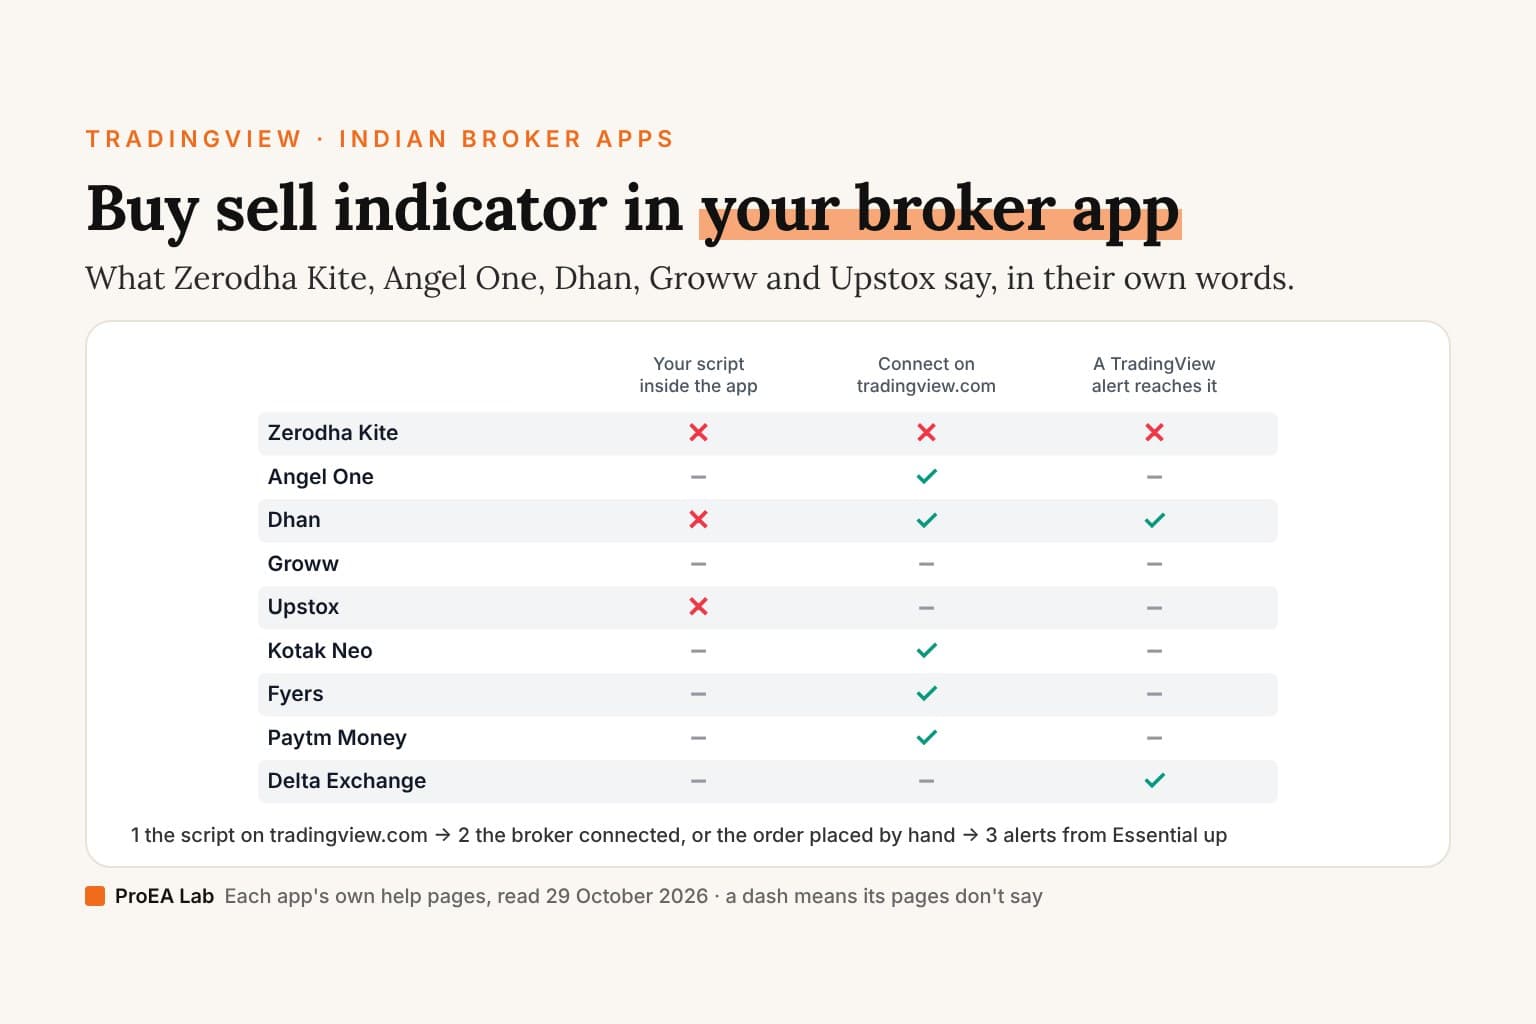
Every script here runs on tradingview.com, not inside a broker's app. Which Indian apps connect to it, in their own words, is in buy sell indicator in Zerodha Kite, Angel One, Dhan, Groww and Upstox.
Nifty options in TradingView: the chart, the data and the trade
Every script above draws on the index or its futures. The options themselves are on TradingView too, and its help pages (read 29 October 2026) say how to open them, what data they come with and who places the trade.
- Opening a contract. "NSE options are available in the symbol search. To access this data, navigate to the symbol search, open the Options tab, and type the exchange prefix, “NSE:”" You can also type a ticker yourself. TradingView's example, "NIFTY240314C22450", is the underlying (NIFTY), the expiry as yymmdd (240314) and "Call or Put option type and Strike Price - C22450". That contract expired on Thursday 14 March 2024, before NSE moved Nifty expiries to Tuesday, so take the date from the Options tab, not from the example.
- The chain. "The options chain is a listing of all available option contracts for a particular underlying asset, such as a stock, index, ETF, or futures contract." For each contract it shows the strike, the expiry, "Premiums (theoretical price, as well as the best market bid and ask quotes)", "Greeks (delta, gamma, vega, theta, and rho — theoretical sensitivity coefficients)" and "Implied volatility", with columns such as "BE: Break-even price (the underlying asset's price at which the options strategy results in zero profit)". To open it: "From any page of TradingView, hover over the "Products" dropdown and choose "Options."" Its strategy builder draws a position's payoff: "The chart can plot a payoff function (risk profiles), P&L profiles, and greeks profiles."
- The data. "Yes, futures and options from both NSE and BSE are available to all users. However, whether the data is real-time or delayed depends on your subscription type and account status." For NSE: "For non-professional users, real-time NSE futures and options data is available by default." Professional users get it delayed until they sign the exchange's agreement. So a non-professional needs no NSE add-on; BSE's options are another matter: "By default, BSE futures and options data is delayed for all users". What a paid plan changes is speed: "Keep in mind that data on free plan updates every few seconds, while any paid plan provides faster updates if trades are happening." The pricing page's "Fastest data flow" row reads ✗ on Basic and ✓ on every paid plan.
Bank Nifty in TradingView
The index is NSE:BANKNIFTY, and its options sit in the same Options tab: TradingView's own chain page for it is titled "BANKNIFTY Options Chain — NSE:BANKNIFTY — TradingView". Four of the 18 scripts above are built for it (AI-Bank-Nifty, Bank Nifty Dashboard, Bank Nifty Volume and Bank Nifty Scalping). What changes from NIFTY is NSE's, not TradingView's: BANKNIFTY's lot is 30 in NSE's file, and with one weekly index allowed per exchange, NSE's weekly is NIFTY, so Bank Nifty options are monthly.
Can you trade options on TradingView?
Through a broker, yes; TradingView itself doesn't execute anything: "TradingView doesn't process your trades and acts as an interface only." Its pricing page shows "Trade through selected brokers" ticked on every plan, Basic included. The steps, in TradingView's words: "While on Supercharts, click the Trade button at the top toolbar. You will see a list of licensed and verified brokers". Once connected, the order ticket lets you "Enter detailed order parameters, side, quantity, stop-loss, and take-profit targets."
Whether options are on the list is the broker's call, so here are the brokers' own pages:
- Angel One: "You can trade in the same exchanges and segments that are enabled on your account with us. Typically this includes:" equity cash, "NSE derivatives (F&O)" and MCX commodities.
- Kotak Neo: "Trading through Kotak Neo on TradingView is available for the following exchanges:" NSE, BSE and MCX. "Availability depends on the segments activated in your Kotak Neo account."
- Dhan: "Our Tradingview broker integration allows you to trade in Stocks, Futures, and Commodities directly from tradingview.com via Dhan." Its page doesn't name options either way.
- Zerodha: "No, Kite does not offer a direct feature to connect with third-party applications like AmiBroker or TradingView."
The indicator reads the index; the order is for a contract with its own premium. Nifty option buying strategy works that premium by hand: what a lot of 65 costs, where it breaks even at expiry and how many lots one stop allows.
Check one yourself
- The close: look for
barstate.isconfirmed, or an input like "Only alert on bar close". A strategy decides at the close unless itsstrategy(line sayscalc_on_every_tick = true. - Other timeframes: search for
security(andlookahead. Alookahead_onwithout[1]on the value reads a candle before it closed. - Alerts:
alertcondition()in an indicator gives you an alert to pick; in a strategy it gives you none, though the strategy's order fills can alert. - Options: search for
CE,PEand the symbol it requests. A script that never requests an option symbol is reading the index. - The expiry: check its weekday against NSE's Tuesday.
Limits
One code read, on 29 October 2026, of the versions the census saved that day. Scripts change, and boosts measure popularity, not quality. We tested none of the 18. We build and sell Signal Desk and Signal Desk Premium, and we have no relationship with any author named here. Nothing here is financial advice. Trading involves risk.
Frequently asked questions
What is the best indicator for option buying?
No indicator changes what SEBI found: in FY26, 90% of individual traders who only bought options lost money. Of the 18 open-source Nifty and option scripts we read, gokulchhabra's NIFTY 5-STAR Buy/Sell Indicator is the most complete free one: one signal a day on a closed candle, a stop, one target and two alerts. It reads no option chain, and we tested none of the 18.
How many option buyers lose money in India?
SEBI's study of FY26 found that 93% of individual equity derivative traders were Only Options Buyers, and 90% of them made a loss. Across all individual traders, 87.7% lost money in FY26, down from 90.9% in FY25. SEBI's profitability study, which covers FY25 and FY26, also says options accounted for 92% of aggregate individual losses, without naming a year.
Is there a CE PE indicator on TradingView?
Several open scripts work with calls and puts. Two of dipankarnag's three strike tables read 22 option contracts around the money, and Sabarijegan's script prints Buy Call or Buy Put on every candle but a tie. Our Signal Desk can label longs BUY CE and shorts BUY PE on an index chart, but it formats a strike and expiry label and does not read an option chain, premiums or Greeks.
Do Nifty option indicators repaint?
Some of their signals change before the candle closes. Of the 18 scripts we read, the Supertrend flip dots, the Heikin Ashi range filter's BUY and SELL and the pivot script's Win and Loss labels are decided on the live candle. NIFTY 5-STAR, the strike tables and the two strategies, carefulSalami20010's and Wealth_Guide's, decide on closed candles.
What is the Nifty lot size in 2026?
65. NSE's lot file, read on 29 October 2026, shows 65 for every NIFTY contract listed, and NSE's circular set it from the 6 January 2026 weekly expiry. BANKNIFTY's is 30.
When do Nifty options expire?
On Tuesday. NSE moved the expiry of contracts expiring on or after 1 September 2025 to Tuesday, with monthly contracts on the last Tuesday of the month. Since 20 November 2024, SEBI allows each exchange one benchmark index with a weekly expiry, and on NSE that is NIFTY.
Can you trade options on TradingView?
Through a connected broker, yes: TradingView says it acts as an interface only. Angel One's page says its connection typically includes NSE derivatives (F&O), Kotak Neo's lists NSE, BSE and MCX, Dhan's names stocks, futures and commodities, and Zerodha's Kite does not connect. For non-professional users, TradingView shows NSE options data in real time by default.
Which ProEA tool labels CE and PE?
Signal Desk, the entry checklist desk in Pine Pro Library. With options mapping on, it labels longs BUY CE and shorts BUY PE on an index or futures chart. It does not read an option chain, premiums or Greeks, its levels stay index prices, and an exit message recalculates its strike from the current price.