Download the prop firm tracker as an Excel workbook (.xlsx), which you can import into Google Sheets, or a CSV of the typed columns. Type one row per account (its rules, fee and status) and one row per trading day (start and close balance, and the day's high and low if you have them). The sheet works out the daily loss floor and the drawdown floor (static, end-of-day trailing or intraday trailing, with an optional lock) and says OK or LIMIT HIT for each day.
The floors follow the rules of our EOD vs intraday drawdown simulator: we rebuilt the workbook from a script, recalculated it in LibreOffice and checked every formula against the simulator's arithmetic. The example rows are invented, with made-up rule sets, not any firm's.
What's in the prop firm tracker
| Sheet | What you type | What it works out |
|---|---|---|
| Accounts | Firm, plan, account size, max drawdown ($), drawdown type, lock level, daily loss limit ($), profit target ($), fee, status, payouts | Net (payouts − fee), the latest close and the progress to the target |
| Daily log | Account ID, date, start balance, close balance, and optionally the day's highest and lowest equity | Day P&L, the daily loss floor and its room, the drawdown floor during the day and after the close, the room to each, and OK or LIMIT HIT |
| Summary | Nothing | Attempts, passes, failures, fees, payouts, net, days logged and days with a LIMIT HIT |
| Max drawdown | Your equity or closes | The running peak, the drawdown from it and the worst one |
Yellow headers are yours to type; grey headers are formulas. The Daily log has 300 rows ready and the Accounts sheet 50.
The three examples, worked
The workbook ships with three invented accounts and nine days, chosen to show each kind of check.
| Account | Rules (made up) | What happens |
|---|---|---|
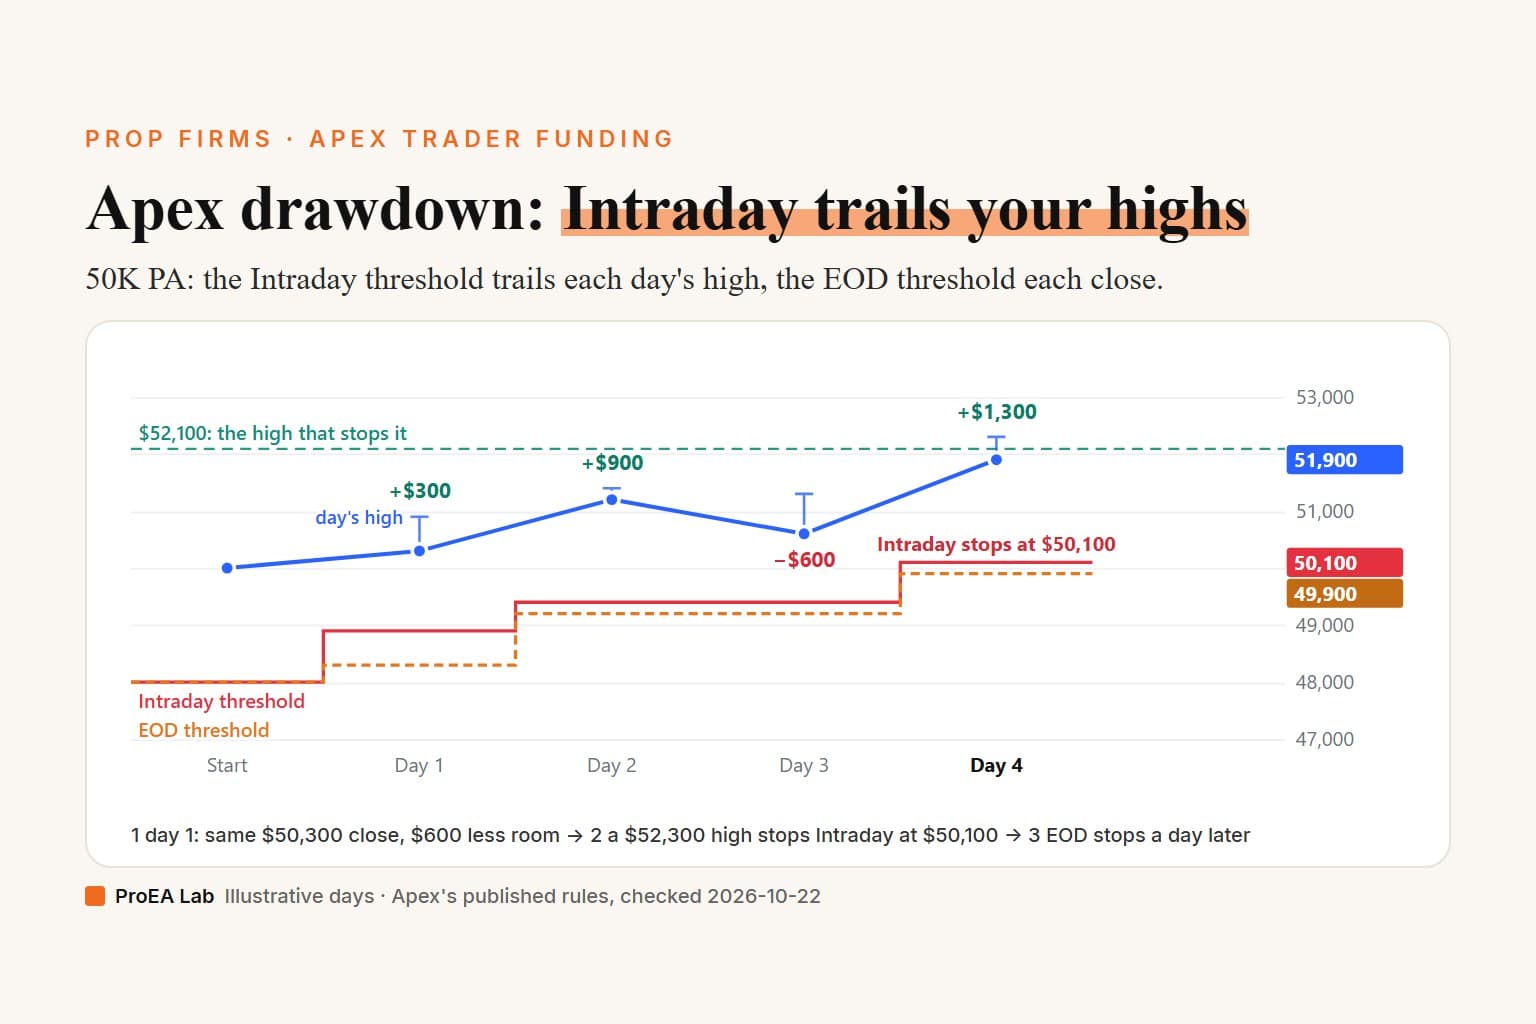
| A1, $50,000 | $2,000 end-of-day trailing, stops at $50,100; $1,000 daily | The floor steps from $48,000 to $48,600, $49,200 and $49,900 as the closes rise to $51,900. OK every day |
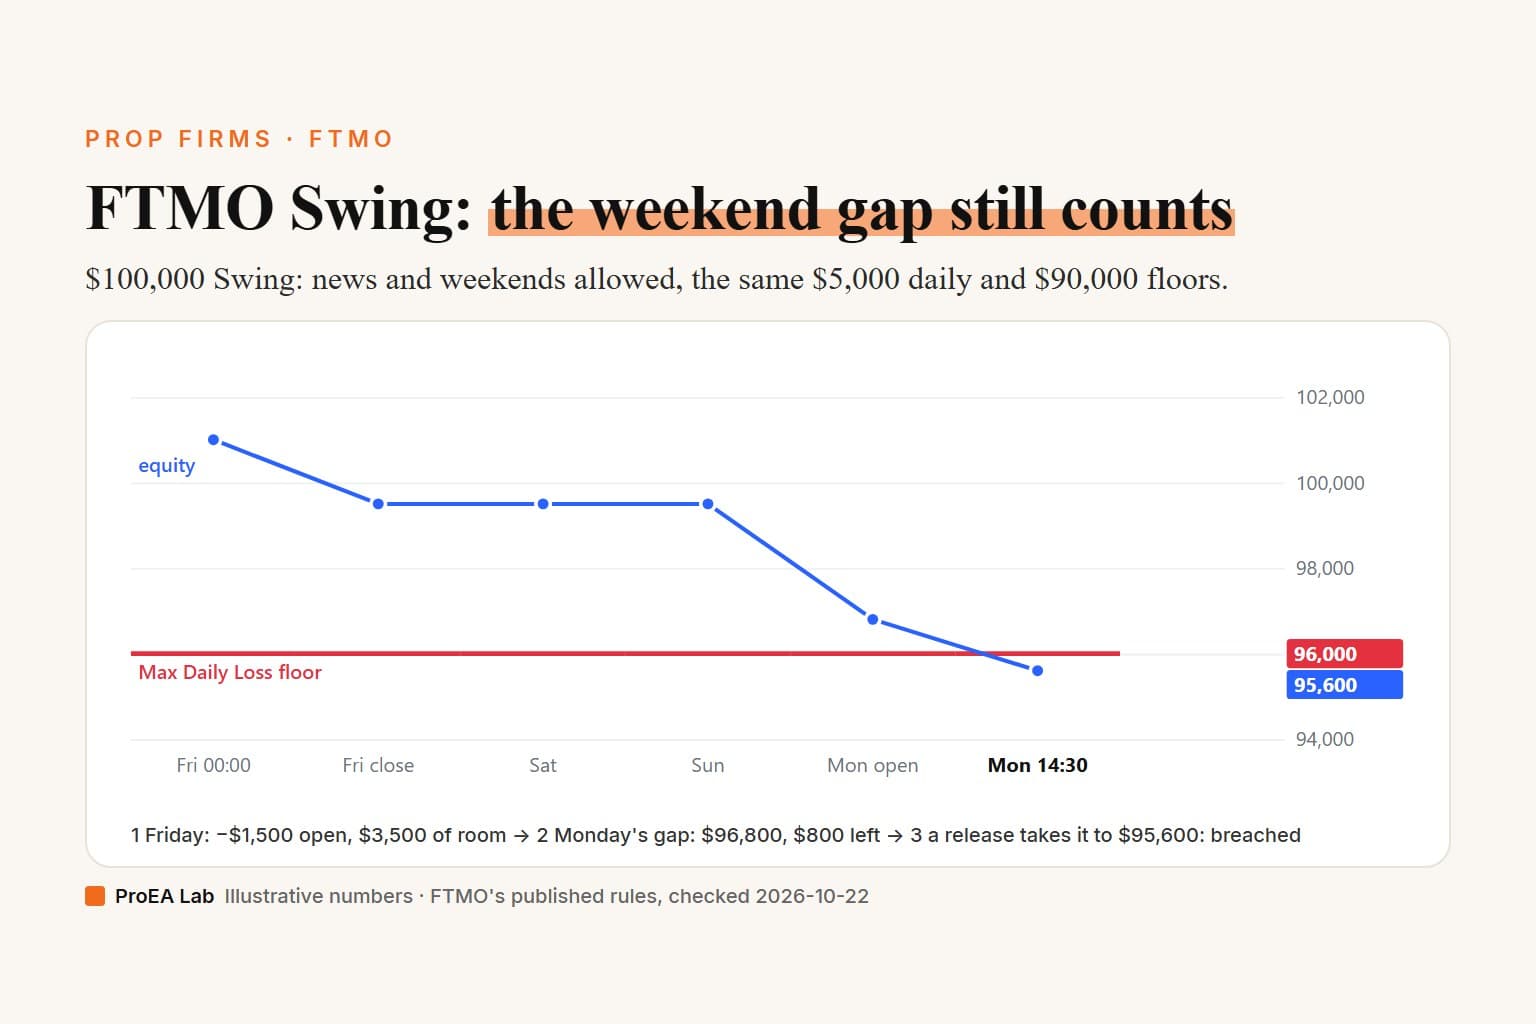
| A2, $100,000 | $10,000 static; $5,000 daily | Day 2 starts at $101,800, so its daily floor is $96,800, and the low of $96,500 is $300 under it: LIMIT HIT, with the $90,000 static floor still $6,500 away |
| A3, $50,000 | $2,000 intraday trailing, stops at $50,100; no daily limit | Day 1's $51,500 high lifts the floor to $49,500, and Day 2's $49,400 low is $100 under it: LIMIT HIT. As an end-of-day account its floor would be $48,200 |
The Summary on the example: 3 attempts, 1 failed, $840 in fees, no payouts, a net of −$840, and 2 days with a LIMIT HIT.
How the floors are worked out
- Daily loss floor: the day's starting balance minus the daily loss limit. The check uses the day's lowest equity (or the start and close, if you leave the low empty).
- Static: account size minus max drawdown. It never moves.
- End-of-day trailing: the highest close so far minus max drawdown. During a day the floor is where yesterday's close left it; after the close it moves up if the close was a new high.
- Intraday trailing: the highest equity so far, from the Highest equity column, minus max drawdown. The sheet assumes the day's high came before its low, the cautious reading when you only know the two numbers.
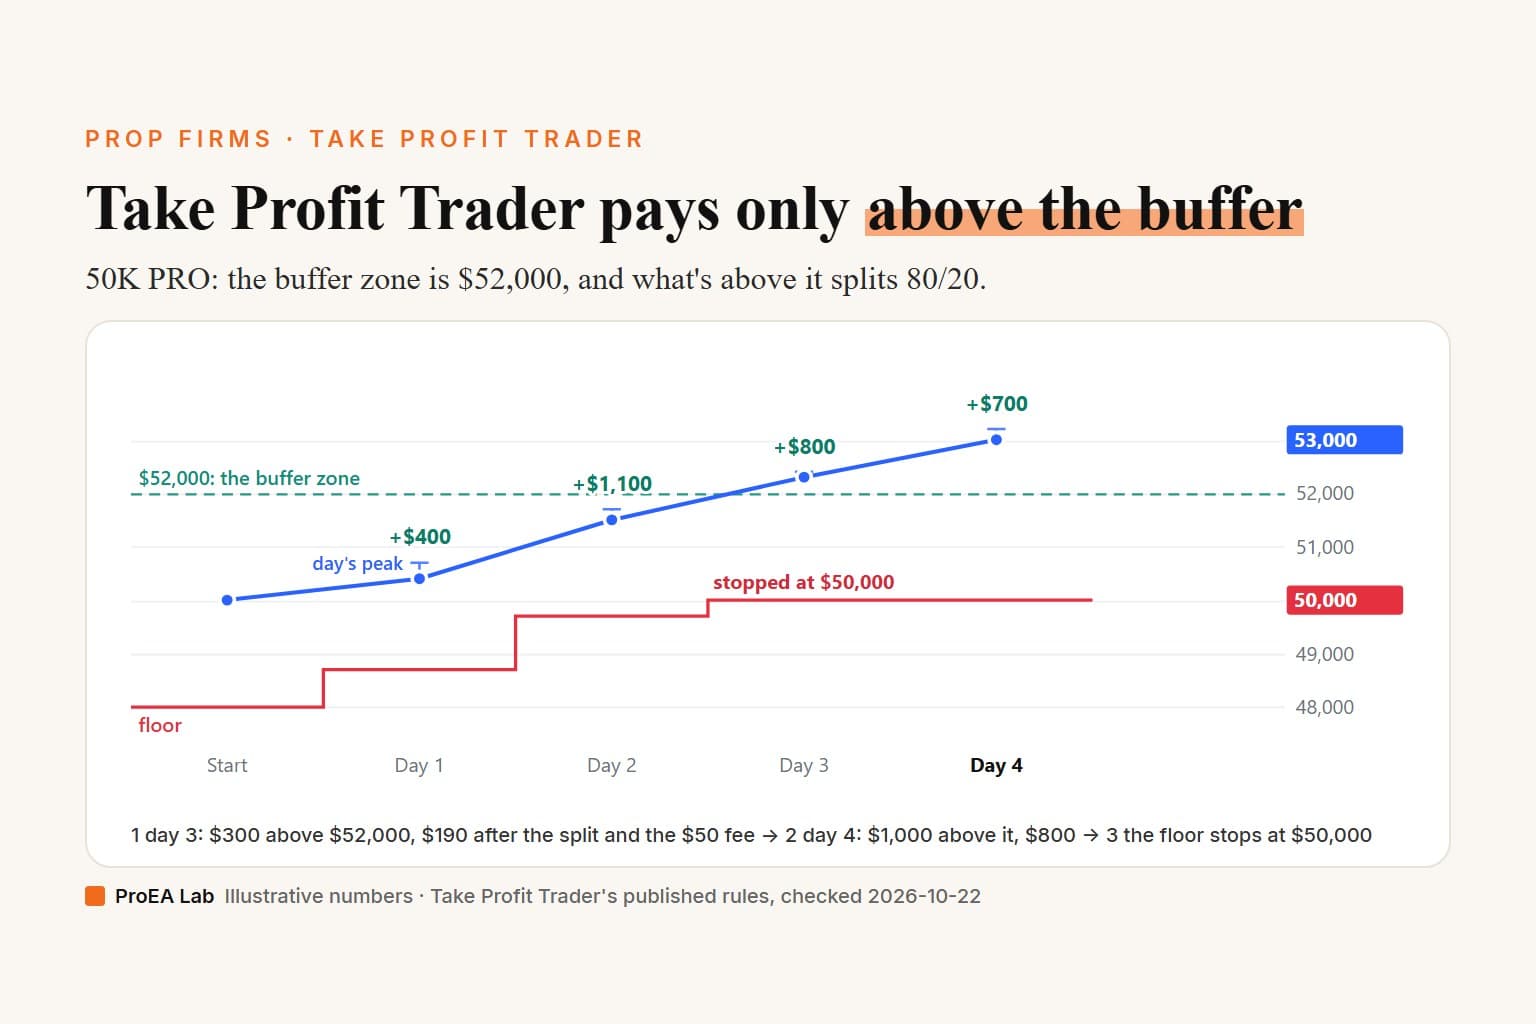
- Lock: a trailing floor never rises above the level you type in "Floor stops at". Leave it empty if your rules have no lock.
A tie counts as a breach here, and each firm defines its own day: check your rulebook, and see EOD vs intraday trailing drawdown for how the two trails differ.
How to calculate max drawdown in Excel
The Max drawdown sheet does it in three columns. Put your closes in column B, then:
- Running peak, column C:
=B2in C2, then=MAX(B3,C2)in C3, filled down. - Drawdown from the peak, column D:
=B2/C2-1, filled down. - Max drawdown:
=MIN(D2:D11).
On the sheet's ten example values the worst fall is from 10,900 to 9,950: −8.72%. Replace column B with your own equity or closes.
Google Sheets and older Excel
In Google Sheets, use File → Import → Upload with the .xlsx, so the formulas, dropdowns and sheets come with it. The CSV holds only the Daily log's six typed columns and the example rows.
The trailing floors and the latest close use MAXIFS, which Google Sheets, Excel 2019, Excel for Microsoft 365 and LibreOffice have; we recalculated the workbook in LibreOffice. Excel 2016 and older don't: those cells show #NAME?, and so does every check that depends on them, so a trailing account's Check column and the Summary's count of LIMIT HIT days are wrong there. Use Google Sheets or a newer Excel.
The deep version, as a PDF
The Prop Firm Payout Playbook
Every rule between a funded account and its first payout, for 16 firms, and a plan for staying inside them.
- 16 firms' drawdown, daily loss, consistency, target and payout rules, each from our dated reading of the firm's own pages, plus the open-loss guards that cut the split and can end funded accounts
- The three drawdown floors and the daily limit, worked to the dollar, so you always know which line ends the account
- The consistency math in one line, and the day cap that, if you finish on target, keeps a big day from delaying your payout
One payment, instant download. Refund within 7 days if you haven't downloaded it.
Or get both: Toolkit + Playbook, $39 (separately $48)
The Prop Firm Challenge Toolkit (Pine indicator) and The Prop Firm Payout Playbook (PDF guide) in one ZIP, one payment. Refund within 7 days if you haven't downloaded it.
What it doesn't do
It doesn't read your account: you type the numbers once a day, and your firm's dashboard has the final word. It doesn't know any firm's rules: you type them from the current rulebook. It doesn't count trading days or check a consistency rule.
If you want daily loss and drawdown buffers on your chart while you trade, the Prop Firm Challenge Toolkit (ours, $29 once) shows them on TradingView, from the balance you type, with presets for FTMO, FundedNext, Topstep and The5ers plans. Its trailing floor follows the balance you type, not your account's history; the workbook keeps that history in its Daily log. To see which free TradingView scripts check these rules, read the best prop firm indicators, code-read.
Frequently asked questions
Is the prop firm tracker free?
Yes. Download it as an Excel workbook (.xlsx) or a CSV of the Daily log's typed columns: no email, no account.
Does the tracker work in Google Sheets and older Excel?
It should in Google Sheets, Excel 2019 and Excel for Microsoft 365: it uses MAXIFS, which all three have, and we recalculated it in LibreOffice. In Sheets, upload the .xlsx with File → Import. Excel 2016 and older lack MAXIFS, so the trailing floors, the checks that depend on them and the Summary's count of LIMIT HIT days go wrong there: use Google Sheets or a newer Excel.
How do I calculate max drawdown in Excel?
Put your closes in column B. In C2, =B2; in C3, =MAX(B3,C2), filled down: the running peak. In D2, =B2/C2-1: the drawdown from that peak. Max drawdown is =MIN(D2:D11). On the sheet's example the worst is a fall from 10,900 to 9,950: −8.72%.
How does the tracker work out the daily loss limit?
The daily loss floor is the day's starting balance minus the daily allowance, and the check compares it with the day's lowest equity. On the example's static $100,000 account, Day 2 starts at $101,800 with a $5,000 allowance, so the floor is $96,800; the day's low, $96,500, is $300 under it. Some firms measure the day from equity, or the higher of the two: adjust the Start balance you type if yours does.
What is the difference between EOD and intraday trailing drawdown in the tracker?
End-of-day: the floor follows your highest close, and during a day it stays where yesterday's close left it. Intraday: it follows the highest equity you type in the Highest equity column. On the example's intraday account, a $51,500 high lifts the floor to $49,500, and the next day's $49,400 low is $100 under it; as an end-of-day account its floor would be $48,200.
Can it track prop firm fees and payouts?
Yes. The Accounts sheet has a Fee paid and a Payouts received column per account, and a Net column; the Summary sheet totals them. The three example accounts paid $840 in fees and received nothing, so the example's net is −$840.
Does the tracker read my prop firm account?
No. It's arithmetic on the numbers you type, once a day. Your firm's dashboard is the source of truth, and the firm's rulebook decides the floor type, the lock and when the day starts.