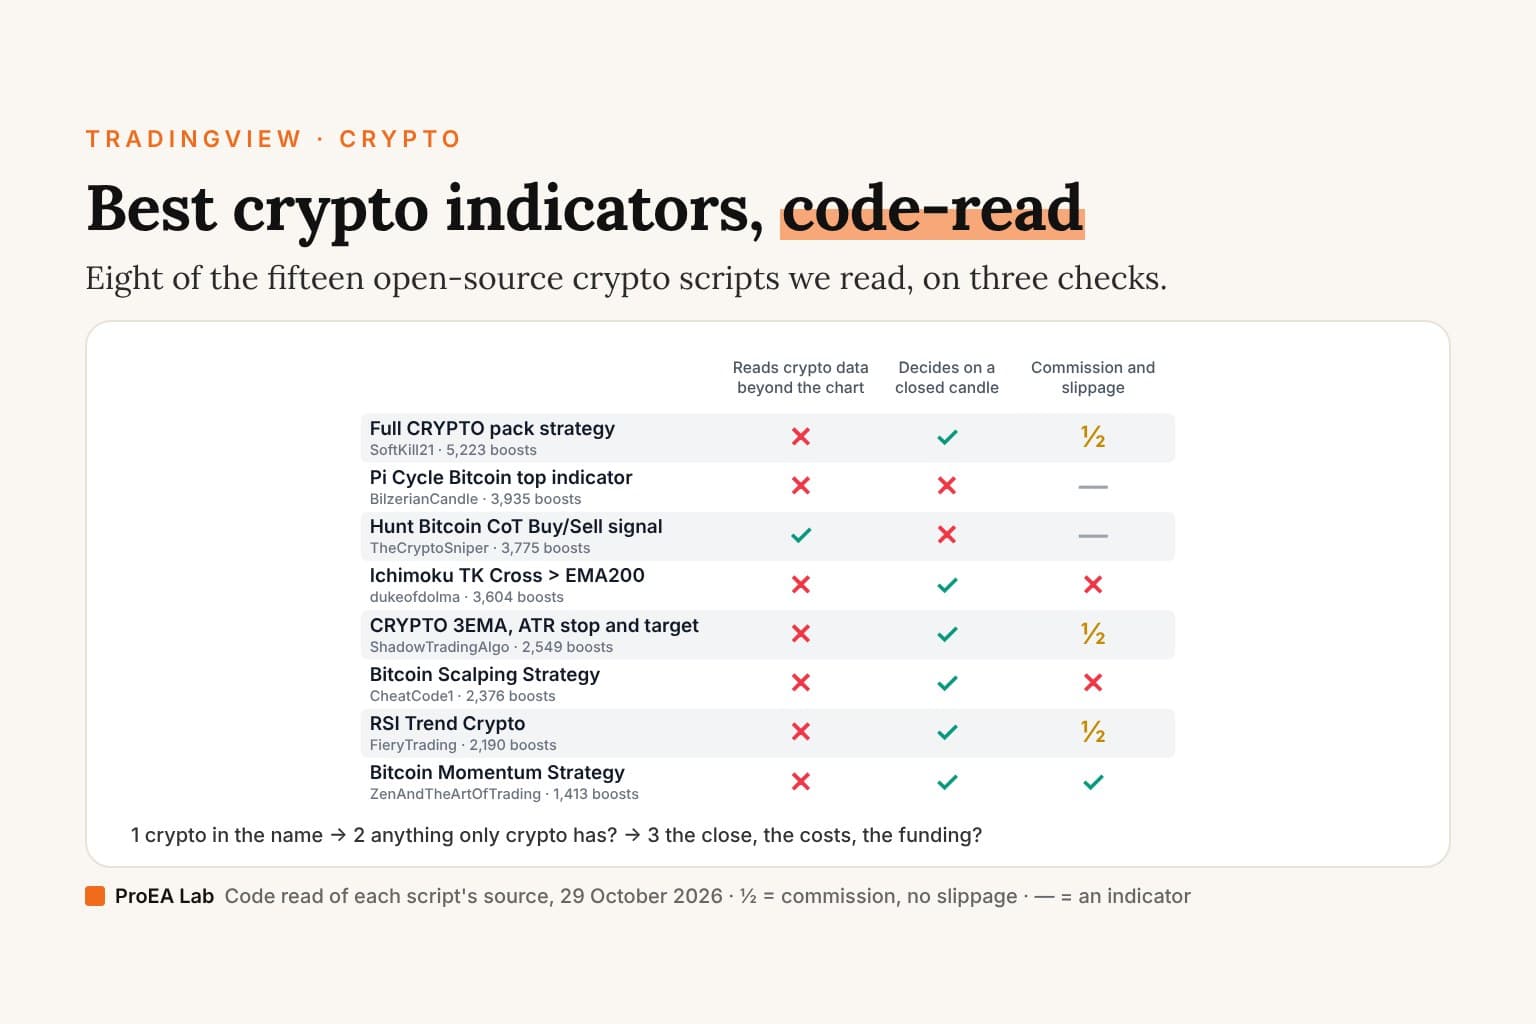
Short answer: most "crypto" indicators on TradingView are ordinary indicators with crypto in the name. Of the 15 open-source scripts we read, only one reads any crypto data beyond the prices of the symbol on the chart: TheCryptoSniper's Hunt Bitcoin CoT, from the positions of the largest traders in CME bitcoin futures. The most-boosted, SoftKill21's Full CRYPTO pack (5,223 boosts), stops trading on 31 December 2021 on its own defaults. For a trend backtest to start from, ZenAndTheArtOfTrading's Bitcoin Momentum Strategy (1,413 boosts) is the only one that charges slippage as well as commission, and it reads its weekly trend without peeking. Like every TradingView strategy, it charges no perpetual funding. None of the 15 reads a future candle.
Most lists name crypto indicators.
This one reads them.
Then it answers a question traders type beside them, the 4-hour crypto strategy: why a rule decided on 4-hour closes suits a market that never closes, worked out by hand.
What we checked
We searched TradingView's scripts for 15 terms on 29 October 2026, taken from what traders type: "crypto indicator", "crypto indicators", "crypto trend", "crypto trend following", "crypto trend indicator", "bitcoin indicator", "btc indicator", "bitcoin trend", "crypto breakout", "crypto buy sell", "crypto strategy", "bitcoin strategy", "4h crypto", "crypto signal" and "crypto alert". We kept the 381 scripts with crypto, bitcoin or BTC in their name, 165 of them open source. We took the 13 most-boosted of the 165, down to 1,413 boosts, with none skipped, and two more whose names are what traders type: QuantitativeAlpha's Crypto Trend Indicator and FittestTrader's Crypto Breakout Indicator. Then we read every line that decides a signal, a stop, a target, a size or an alert. Six questions:
- Crypto data: does it read anything a stock chart doesn't have?
- Volume: does it need it, and whose?
- Repainting: does it read another timeframe or a future candle, or decide on the live candle?
- The plan: a stop and a target?
- Alerts: what can it send you?
- Strategies: what do they charge, and on which dates do they trade?
Six scripts with more boosts than our cutoff are protected or invite-only, so we can't read them; they're at the bottom of the table.
The table
Boosts as TradingView's search showed them on 29 October 2026.
| Script | Boosts | What it computes, by default | Stop and target | Decides on | Alerts |
|---|---|---|---|---|---|
| Full CRYPTO pack macd, rsi, obv, ema strategy (SoftKill21) | 5,223 | A MACD turn above a rising 9-candle EMA, with RSI and on-balance volume; its dates end on 31 December 2021 | None | Each close (a strategy) | None of its own |
| Pi Cycle Bitcoin top indicator (BilzerianCandle) | 3,935 | The 111-day average crossing above twice the 350-day average | None | The live candle; daily values | Pi Cycle |
| Hunt Bitcoin CoT Buy/Sell signal (TheCryptoSniper) | 3,775 | The four largest long and short traders' shares in CME bitcoin futures | None | The live candle | None |
| Ichimoku TK Cross > EMA200 Crypto Strategy (dukeofdolma) | 3,604 | Ichimoku's conversion line above its base line (20 and 60), the close above EMA(200) | None | Each close (a strategy) | None of its own |
| BTC Indicator By Megalodon Trading (MegalodonTrading) | 2,569 | Where the close sits in 359 high-low ranges, averaged | None | The live candle | None |
| CRYPTO 3EMA Strategy with Take Profit & Stop Loss based on ATR (ShadowTradingAlgo) | 2,549 | EMA(21) crossing above EMA(55); its dates end on 1 January 2022 | A stop 2 × ATR(14) below, a target 3 × ATR(14) above | Each close (a strategy) | None of its own |
| Bitcoin Scalping Strategy (Sampled with: PMARP+MADRID MA RIBBON) (CheatCode1) | 2,376 | 18 EMAs above EMA(100), none falling, and RSI(14) over 55 | A 1% target, a 27.75% stop | Each close (a strategy) | None of its own |
| RSI Trend Crypto (FieryTrading) | 2,190 | RSI(14) crossing up through 35; out when it crosses down through 75 | None | Each close (a strategy) | Order-fill messages |
| Full CRYPTO pack macd, rsi, obv, ema alert version (SoftKill21) | 2,101 | The first row's rules as an indicator; its dates end on 31 December 2021 | None | The live candle | Long, EXIT buy |
| CT Reverse Pi Cycle Bitcoin Top Indicator (The_Caretaker) | 1,706 | The Pi Cycle, plus the daily close that would make its averages cross | None | The live candle; daily values | Pi Cycle top, Long MA above short MA |
| TCP / Money Management indicator / Crypto Version (tradecitypro) | 1,703 | A sizing table from prices you type in | You type them | — | A liquidation warning |
| Crypto ZigZag RSI strategy 15min (SoftKill21) | 1,533 | Turns in the closes where RSI(5) crossed 25 and 75 | None | Each close (a strategy) | None of its own |
| Bitcoin Momentum Strategy (ZenAndTheArtOfTrading) | 1,413 | A close above the 20-week EMA, outside its "caution" condition | A trailing stop 1 × ATR(5) under the 7-candle highest low; no target | Each close (a strategy); the weekly EMA of the last closed week | None of its own |
| Crypto Trend Indicator (QuantitativeAlpha) | 583 | EMA(30) against EMA(60) with a 0.3 × ATR(60) margin; the coin against GLD and SPY | None | Colours: the live candle; alerts: the closed candle | Nine, once per bar close |
| Crypto Breakout Indicator (FittestTrader) | 166 | A close 1% to 20% above a tight 6-candle range, on rising volume, above EMA(200) | None | The live candle | Upper Breakout |
| Z+ Trend Finder & Breakout 3in1 for Crypto Stock & Forex Trading (open4profit) | 3,503 | Invite-only: we can't read it | — | — | — |
| Crypto Turtle - Trend Following Strategy (DashTrader) | 3,152 | Protected: we can't read it | — | — | — |
| BTI - Bitcoin (BTC) Top Indicator [Logue] (Da_Prof) | 2,016 | Protected: we can't read it | — | — | — |
| BTB - Bitcoin (BTC) Top and Bottom Indicator [Logue] (Da_Prof) | 1,714 | Protected: we can't read it | — | — | — |
| Moonbot - Cryptocurrency Trading Strategy (DashTrader) | 1,575 | Protected: we can't read it | — | — | — |
| CryptoNite - Machine Learning Strategy (15Min Timeframe) (Trebor_Namor) | 1,497 | Protected: we can't read it | — | — | — |
Seven of the 15 are strategies, and their costs and dates are whatever their strategy( line and inputs set:
| Strategy | Trades | Size, by default | Commission | Slippage | Trades on |
|---|---|---|---|---|---|
| SoftKill21, Full CRYPTO pack | Long only, by default | 100% of equity; 1,000 of capital | 0.1% per order | None | 1 January 2020 to 31 December 2021 |
| dukeofdolma, Ichimoku TK Cross | Long only | The initial capital ÷ the close; capital not set | None | None | The chart's whole history |
| ShadowTradingAlgo, CRYPTO 3EMA | Long only | 10% of equity; 10,000 of capital | 0.01% per order | None | 1 January 2017 to 1 January 2022 |
| CheatCode1, Bitcoin Scalping | Long and short | 1,000 in cash; 1,000 of capital; margin 0 | None | None | The chart's whole history |
| FieryTrading, RSI Trend Crypto | Long only | 100% of equity; capital not set | 0.2, with no commission type set | None | The chart's whole history |
| SoftKill21, Crypto ZigZag RSI | Long only, by default | Not set | None | None | The chart's whole history |
| ZenAndTheArtOfTrading, Bitcoin Momentum | Long only | 100% of equity; 10,000 USDT of capital | 0.15% per order | 150 ticks | 2000 to 2099 |
None of the seven charges funding. Two of them, SoftKill21's Full CRYPTO pack and ShadowTradingAlgo's 3EMA, trade nothing after 2021 unless you change their dates. Two of the 15 give a stop and a target with each trade, and one more trails a stop with no target.
What the code says
SoftKill21's Full CRYPTO pack strategy stopped trading at the end of 2021. Its code calls it "Full strategy". A buy needs five things on one candle: the close above a 9-candle EMA of each candle's midpoint and above the close before it, that EMA rising, the MACD histogram (12, 26 and 9, also on the midpoint) turning positive, RSI(14) under 100, which almost any candle passes, and on-balance volume above its 10-candle average. The mirror image, with RSI over 35, closes the long. It is long only by default ("shortEntry" is off) and puts 100% of equity into every trade, with 0.1% commission per order and no slippage, from 1,000 of capital. The catch is its date filter: "From Year" 2020 and "To Year" 2021, ending on 31 December 2021, and both the buy and the exit need it. On a chart today it opens nothing, and a long still open at the end of 2021 is never closed. No stop and no target. Pine v4, MPL 2.0.
SoftKill21's alert version has the same rules and the same dates. It is the strategy above as an indicator, with two alerts, "Long" and "EXIT buy". Its date filter also ends on 31 December 2021, so on its own defaults neither alert can fire on a chart today: an alert only fires on the live candle. Its marks are decided on the live candle. Pine v4, MPL 2.0.
BilzerianCandle's Pi Cycle marks one kind of top, from daily candles. Whatever chart you're on, it reads the daily one: the 111-day simple average of the close and twice the 350-day average. When the first crosses above the second, it prints "Pi Cycle top" 10% above the daily close. Nothing else: no bottom, no exit, no stop. It needs 350 daily candles of the symbol before it can draw anything. One alert, "Pi Cycle", whose message says "The Pi Cycle Top has been reached, historically Bitcoin tops within 3 days of reaching this ratio": that is the script's claim, and we haven't checked it. Its "Send an alert on Pi Cycle Top?" setting isn't used by the alert. The daily values come through security with no lookahead argument, so lookahead is off. Pine v4, MPL 2.0.
TheCryptoSniper's Hunt Bitcoin CoT reads CME bitcoin futures, not a crypto exchange. It reads two daily series from a symbol named QUANDL:CFTC/133741_F_ALL_CR, which its legend describes as the shares of the four largest long and the four largest short traders. In TradingView's symbol search on 29 October 2026, the code 133741 is listed as "BITCOIN - CME - Futures" series from TradingView's Commitments of Traders source, and the script's QUANDL symbol returned nothing. We didn't load the script on a chart, so we can't say whether it still draws. "LONG" prints when the short traders' share minus the long traders' share is 5 or less, "SHORT" when the four largest shorts hold 70 or more, and either becomes "SUPER" when 10-candle historical volatility is 20 or under. "CAUTION" prints when that gap crosses above 45 with the shorts above 67.5. Its volatility is annualised over 365 days, and on an intraday chart it treats each candle as a day. No stop, no target and no alerts. Labels are decided on the live candle. Pine v4, no licence line (its header: "©Francis Hunt – The Market/Crypto Sniper").
dukeofdolma's Ichimoku TK Cross strategy uses longer Ichimoku lengths and charges nothing. Its conversion, base and second leading span lengths are 20, 60 and 120, displaced 30 candles; TradingView's help for the built-in Ichimoku plots its leading spans "26 periods in the future". It buys whenever the conversion line is above the base line and the close is above the 200-candle EMA, and sells when the conversion line drops below the base line: long only, no stop, no target. Each order buys the strategy's initial capital divided by the close, and its strategy( line sets no capital, no commission and no slippage. The lagging span is the close drawn 30 candles back, as Ichimoku's always is ("plot the closing price 26 periods in the past", in TradingView's words); no signal reads it. No alerts of its own. Pine v3, no licence line.
MegalodonTrading's BTC Indicator is a range oscillator, and nothing in it reads bitcoin. In its own pane, for every lookback from 6 to 364 candles, it scores where the close sits between the highest high and the lowest low, then averages the 359 scores into a line from −100 to 0, shaded green below −61.8 ("Buy Below Initial Trigger") and red above −38.2 ("Sell Above Initial Trigger"). It runs on whatever symbol and timeframe you open, and its lookbacks are candles, not days, whatever its comments say. One line divides 0.618 by 100, so the score jumps at the 61.8% line: scored on one range, a close just under that line counts about 81 out of 100, toward the red end, and a close just over it 50. No stop, no target and no alerts. Decided on the live candle. Pine v4, MPL 2.0.
ShadowTradingAlgo's CRYPTO 3EMA strategy has an ATR stop and target, and stops trading on 1 January 2022. It buys when EMA(21) crosses above EMA(55), sets a stop 2 × ATR(14) below the signal candle's close and a target 3 × ATR(14) above it, and also exits when EMA(9) crosses below EMA(21). The 200-candle SMA it draws as a "Trend indicator" and its RSI overbought and oversold marks feed no rule. Long only. Its strategy( line sets 10,000 of capital, 10% of equity per trade and 0.01% commission, with no slippage. Its date range runs from 1 January 2017 to 1 January 2022, and outside it the strategy closes everything, so on its defaults it trades nothing after 2021. No alerts of its own. Pine v4, no licence line (its header: "©Densz").
CheatCode1's Bitcoin Scalping Strategy risks 27.75% to make 1%. It joins The_Caretaker's PMARP and Madrid's moving average ribbon, both credited in its comments. A long needs all 18 ribbon EMAs, from 5 to 90 candles, above EMA(100) and none of them falling, a previous candle that didn't close up, and RSI(14) above 55; a short needs the ribbon falling and below EMA(100). Every trade's "Take Profit" is 1% from the entry and its "Stop Loss" 27.75%. Its strategy( line sets margin_long=0, margin_short=0, 1,000 of capital and 1,000 in cash per trade, with no commission and no slippage. TradingView's publishing rules say: "A margin of 0 is unrealistic in any circumstance, because it represents infinite leverage." Its PMARP, which feeds one exit, uses a volume-weighted average by default, so that exit needs volume. No alerts of its own. Pine v5, MPL 2.0.
FieryTrading's RSI Trend Crypto buys RSI(14) crossing up through 35. It sells when RSI crosses down through 75; an emergency exit when RSI crosses down through 10 is off by default. No stop, no target, long only, in its own pane. Its orders carry alert messages ("RSI Long Cross: LONG" and "RSI Close Position") for alerts on order fills, which its comments say to send with {{strategy.order.alert_message}}. Its strategy( line sets 100% of equity per trade and commission_value=0.2 with no commission_type, so check the unit in its properties, and no slippage. Pine v4, MPL 2.0.
The_Caretaker's Reverse Pi Cycle adds the price that would make the cross. It uses the same daily averages as the Pi Cycle, 111 days and twice 350, read through request.security with lookahead left off. It adds an "MA Cross" line, the daily close at which the two averages would meet, a label with that price and the close's distance from it, a "Long MA above short MA" mark when the averages cross back, and an "anticipated" cross, off by default. Two alerts: "Pi Cycle top" and "Long MA above short MA". Its comments credit Philip Swift for the idea and Ninorigo's script for the code it built on. Pine v5, no licence line.
tradecitypro's TCP Money Management is a sizing table, not a signal. You type in the capital (1,000), the risk (1%), the leverage (1), the entry (100), the stop (98) and up to five targets. Its "Position Size" is the risk in money divided by the stop's distance as a share of the entry, times the leverage: $10 ÷ (2% × 1) = $500 on its defaults. That is the margin to put up, which at a leverage of 1 is the whole position, not a coin quantity. For each target it works out the share to close so that the target banks its "RR Goal", but it takes each share from the whole position, so on its own defaults the table says to close 80% at Target 1 and then "300% of remaining" at Target 2. One alert, titled in Persian like its comments, fires when the stop is further away than 80% divided by the leverage: a rule of thumb in its code, not your exchange's liquidation price. Pine v5, no licence line.
SoftKill21's Crypto ZigZag RSI strategy follows the turns of RSI(5). It remembers two closes: the last one where RSI(5) crossed up through 25, and the last one where it crossed down through 75. A trend flag turns up when the first is more than 1% above the lowest of the second since the flag turned down, and turns down when the second is more than 1% below the highest of the first. It buys on the turn up and sells on the turn down: long only by default, no stop and no target. Nothing in its code checks the 15 minutes in its name, and its strategy( line sets no capital, size, commission or slippage. No alerts of its own. Pine v4, MPL 2.0.
ZenAndTheArtOfTrading's Bitcoin Momentum Strategy is the only one of the seven that charges slippage. Its comments: "Capture as much Bitcoin upside volatility as possible while side-stepping downside volatility." It buys when the close is above the 20-week EMA and not in "caution", which it defines as the highest high of the last 7 candles more than 1.5 × ATR(5) above the low, or a close under the chart's own 20-candle EMA. Its stop trails 1 × ATR(5) under the highest low of the last 7 candles, 0.2 × ATR(5) after a caution candle, and only rises; it sells on a confirmed close under that stop or under the weekly EMA. Long only, no target. It reads the weekly EMA from the last closed week (request.security(_market, _res, _exp[barstate.isrealtime ? 1 : 0])[barstate.isrealtime ? 0 : 1]), so its history doesn't peek. Its strategy( line sets 10,000 USDT of capital, 100% of equity per trade, 0.15% commission and 150 ticks of slippage. Nothing in it reads bitcoin; it runs on whatever you chart. No alerts of its own. Pine v5, MPL 2.0.
QuantitativeAlpha's Crypto Trend Indicator measures your coin against GLD and SPY. It colours EMA(30) and EMA(60) green when the gap between them is more than 0.3 × ATR(60), red when it is that far the other way, and white in between. A table runs the same test on your coin divided by AMEX:GLD and by AMEX:SPY, by default: two symbols listed on an exchange, with its trading hours. Nine alerts, each set to fire once per bar close: trend bullish, bearish or changed, for the coin and for each ratio. Two catches. The table's words "Bullish" and "Bearish" only ask which average is higher, while its colours use the 0.3 × ATR margin, so a grey cell can say Bullish. And while GLD's and SPY's exchange is closed, request.security hands back their last value, so on those crypto candles the ratios move with the coin alone. Pine v6, no licence line.
FittestTrader's Crypto Breakout Indicator needs volume, and decides on the live candle. A "B" prints when the highest high of the last 6 candles is less than 15% above their lowest low, the close is between 1% and 20% above that high, the volume is at least 10% above the previous candle's, the close is above the 200-candle EMA, and the close is not above the upper Bollinger band (20, 2). Its two RSI inputs, 50 and 75, feed nothing. One alert, "Upper Breakout". It decides on the live candle, and a live candle's volume grows until it closes, so the volume test can fail early in a candle and pass later in the same one. No stop and no target. Pine v5, MPL 2.0.
Crypto indicators on TradingView: what a 24/7 market changes
Sessions that never close
TradingView's help puts it in one line: "Crypto markets trade 24/7, so the last candle always updates." A stock is different: "When the exchange is closed, the last candle shows the final prices of the most recent session and stays the same until the market opens again." Three things follow for the scripts above:
- A script that reads an exchange-listed symbol goes stale while that exchange is closed. QuantitativeAlpha's GLD and SPY ratios are the example here: on those candles, Pine fills the gap "with the last confirmed values on historical bars and the most recent developing values on realtime bars", so the ratio is the coin against a price that isn't moving.
- A day is a calendar day. A crypto chart has a daily candle every day, so the Pi Cycle's 350 daily candles are 350 calendar days. Hunt's volatility is annualised over 365 days, the count for a market with a candle every day.
- A session is whatever the script says it is. None of the 15 boxes a session, but killzone, opening range and session VWAP scripts do, and on crypto there's no exchange open to anchor them. Pine's session strings even have a special format for it: "a 7-day, 24-hour session beginning at midnight: "24x7"". On crypto, a "session" script boxes the hours in its inputs.
Perpetual funding
A perpetual future never expires; it charges funding instead. Bybit's help, as one exchange's example: "Funding fees are exchanged directly between long and short position holders at each funding time. Traders will only pay or receive funding fees if they hold positions at that time." And: "When the funding rate is positive, long position holders pay short position holders. When the funding rate is negative, short position holders pay long position holders." For a contract on an 8-hour interval, funding falls at "12AM UTC", "8AM UTC" and "4PM UTC", and "Each trading pair may have different funding intervals and funding rate limits."
The fee, in Bybit's words: "Funding fee = Position value × Funding rate". By hand, for a 10,000 USDT long at a funding rate of 0.01%:
- Each funding time: 10,000 × 0.0001 = 1 USDT.
- Held three days on an 8-hour interval: 3 × 3 = 9 funding times, so 9 USDT if the rate stayed at 0.01%. It doesn't stay put: Bybit says the rate "is not fixed and is updated every minute", and it can turn negative, when the long is paid instead.
None of the seven strategies charges funding, and a TradingView strategy has no setting for it. The Pine Script manual's section on trading costs covers two, commission and slippage: "If not specified, the strategy applies no commission to filled orders", and for slippage "The default argument is 0." Funding isn't on the page. So a Strategy Tester report on a perpetual leaves funding out, whatever the script. The crypto funding rate calculator works out what it adds over your holding time, and the crypto perp fee calculator adds the maker and taker fees and your break-even.
TradingView's publishing rules ask authors to "Set commission and slippage amounts to align with expected trading costs for the instrument that your strategy analyzes." Of the seven, three set no commission at all.
Volume: which scripts need it, and whose it is
Four of the 15 read volume: SoftKill21's two Full CRYPTO pack scripts (on-balance volume, in the buy and the exit), CheatCode1's strategy (a volume-weighted average in its PMARP, which feeds one exit) and FittestTrader's Crypto Breakout Indicator (this candle's volume against the last one's). Without volume, SoftKill21's buys and FittestTrader's "B" never print, and CheatCode1's PMARP exit never fires.
Whose volume? The one TradingView receives for the symbol on your chart. Its help: "We receive trade volume data for most tickers available on TradingView." But "Some crypto pairs and most indexes also show n/a when the volume indicators are applied", and "In some cases, we don't have the trade volume, but the tick volume is available (it indicates the amount of price updates)". Its volume profile page lists "Base or quote volume for crypto" and "Tick volume for indices, forex, and crypto CFDs". So:
- An exchange's pair carries that pair's volume, in the coin or the quote currency. The same coin on another exchange is another symbol with other volume, so on-balance volume and "volume up 10%" tests change with the exchange you open.
- An index or a crypto CFD may have no volume or only tick volume, and a volume test reads something else, or nothing.
Repainting: request.security and lookahead
None of the 15 uses lookahead_on, and none is Pine v1 or v2, whose security() "behaved the same as those with lookahead = barmerge.lookahead_on". Eight call security or request.security. Since lookahead is off by default ("Its default value is barmerge.lookahead_off"), none of them reads a higher-timeframe value before it was known. What still moves:
- Daily values on an intraday chart. The two Pi Cycles and Hunt's CoT read daily data with lookahead off. On history, a day's value arrives "at the end of each HTF period"; live, it is "the most recent developing values". So on a 4-hour chart a Pi Cycle label can print during the day on a cross the day's close undoes, and be gone the next time the chart loads, and TradingView's alert manual names exactly this case: "any request.security() call using a higher timeframe than the chart's, when the higher timeframe's current bar has not closed yet."
- The weekly EMA, done the safe way. ZenAndTheArtOfTrading's strategy asks for the last closed week's value, live and on history, so its weekly line doesn't move.
- The live candle. Every indicator here that marks a signal decides it on the live candle, except QuantitativeAlpha's alerts, which fire once per bar close; none checks
barstate.isconfirmedbefore marking. Set an alert to "Once Per Bar Close": "The simplest way to avoid this type of repainting is to configure the triggering frequency of alerts so they only trigger on the close of the realtime bar." - Drawn back in time. The Ichimoku strategy's lagging span is the close drawn 30 candles back. It feeds no signal.
- Strategies. All seven decide at each close and fill at the next candle's open (or at their stop and target), so their tests don't depend on the live candle.
More on telling them apart in how to tell if an indicator repaints.
Alerts, wherever they come from, need a paid TradingView plan. TradingView's pricing page, read on 29 October 2026, lists "Active technical alerts on indicators, strategies, and drawings" as ✗ on Basic, 20 on Essential, 100 on Plus, 400 on Premium and 1,000 on Ultimate.
Which indicator is best for crypto trading?
None of the 15 computes anything that only works on crypto. Hunt's CoT reads CME bitcoin futures positioning, and TCP's table takes leverage into account; every other script reads prices, and some volume, that a stock chart has too. The Pi Cycles are about bitcoin's tops, but they draw on any symbol with 350 daily candles. So "best for crypto" comes down to the same checks as anywhere, plus funding and whose volume. By job:
- A trend backtest to start from: ZenAndTheArtOfTrading's Bitcoin Momentum Strategy. It is the only one of the seven strategies that charges slippage as well as commission, it reads its weekly trend from the last closed week, and it trails a stop. Before you trust its Strategy Tester, know that it puts 100% of equity into every trade, is long only, charges no funding (no TradingView strategy can), counts its slippage in ticks, which is a different amount of money on every symbol, and we haven't tested it.
- A trend filter with alerts: QuantitativeAlpha's Crypto Trend Indicator, the only script here whose alerts wait for the candle to close. Its catches: the GLD and SPY rows stand still while their exchange is closed, the words in its table ignore the 0.3 × ATR margin its colours use, and it gives no entry and no stop. It has 583 boosts.
- A breakout: FittestTrader's Crypto Breakout Indicator is the one named for it, and it decides on the live candle with the live candle's volume, with no stop. The Donchian channel scripts in best Donchian channel indicators, code-read are the classic breakout channel, read the same way.
- A trailing stop or a SuperTrend line: nothing in this census does it better than the general scripts in best SuperTrend indicators, code-read and best ATR trailing stop indicators, code-read; they run on a crypto chart the same way.
- Sizing: not TCP's table, whose targets add up to more than the position on its own defaults. The crypto position size calculator works out the coins from your risk and stop, and where liquidation sits.
The most-boosted, SoftKill21's Full CRYPTO pack, and ShadowTradingAlgo's 3EMA, sixth, trade nothing after 2021 on their own defaults. Change the dates before you read their reports, and add the costs they leave out.
What is the best crypto trading strategy?
No code read can name one, and we tested none of these 15. Research on crypto trend has two kinds of source, and they aren't equal:
- Peer-reviewed: Liu and Tsyvinski, "Risks and Returns of Cryptocurrency" (The Review of Financial Studies, 2021). From the abstract: "Specifically, we determine that there is a strong time-series momentum effect and that proxies for investor attention strongly forecast cryptocurrency returns." It covers Bitcoin, Ripple and Ethereum.
- A 2025 working paper, not peer-reviewed: Zarattini, Pagani and Barbon, "Catching Crypto Trends: A Tactical Approach for Bitcoin and Altcoins". From the abstract: "We propose an ensemble approach that aggregates multiple Donchian channel-based trend models, each calibrated with different lookback periods, into a single signal". It runs on the top 20 coins, and its results are a backtest.
We read their abstracts, not the full papers. Neither tested a script here, and research on the past isn't a forecast. What any strategy has to survive before you trust it: its costs (fees on both sides, slippage and funding), a test on candles you didn't choose it on, and enough trades to mean something. TradingView's own publishing rules say "In most cases, the report should show more than 100 trades." How to run that test is in how to backtest on TradingView; one rule we wrote down before testing it once, losing stretch included, is in Does turtle trading still work?.
4h crypto strategy: a 4-hour close for a market that never closes
A 4-hour chart is a choice of clock. On a 24/7 market it is an even one. TradingView's help: "On a 4-hour chart, every candle shows where the price started, how high and how low it went, and where it ended during those four hours." On an exchange with trading hours, a session's last candle can be cut short: "On a 45-minute chart of META, candles start at 9:30, 10:15, 11:00, and so on. The last one starts at 15:30 but the market closes at 16:00, so it holds only 30 minutes of trading." On crypto, no close cuts one short and no weekend leaves a gap. Five reasons that suits a rule decided on the 4-hour close, none of them a claim about returns:
- The count is the clock. Six candles a day, 42 a week, 2,190 a year (6 × 365). A 20-candle high is always the last 80 hours, a little over 3 days, and a 10-candle low the last 40 hours, weekends included. On a session market, 20 candles cover more or less calendar time depending on where the nights and weekends fall.
- A close is a decision you can schedule. A rule that waits for the close decides six times a day, at the same times every day, and nothing inside the candle counts: a wick through the high at night that closes back under it is not a breakout. An alert set to "Once Per Bar Close" fires only then.
- It reads slower than the intraday noise, and faster than the daily. A 20-candle high on 15-minute candles covers 5 hours; on 4-hour candles, 80. The highest high of 5 hours can never be above the highest high of the 80 hours that end at the same candle, so a shorter channel is never wider, and price breaks it at least as often. On daily candles, 20 is 20 days, the Turtles' System 1 length.
- Funding is a cost of holding, and a 4-hour rule holds for days. At an 8-hour interval, a trade open three days crosses 9 funding times; the example above makes that 9 USDT on 10,000 if the rate stays at 0.01%.
- The arithmetic is small enough to do by hand. Size from the stop. Say the entry is 60,000, ATR(20) is 900 and the stop sits 2 × ATR below: 1,800 away. Risking $100: 100 ÷ 1,800 = 0.0556 BTC, about $3,333 of position. Breakaway's study charged a 0.05% fee per side, so $1.67 in and about the same out, and 0.01% funding per started 8 hours. The crypto position size calculator does the size and the liquidation check; the Turtle position size calculator does it the Turtles' way, one Unit from N.
DashTrader's Crypto Turtle (3,152 boosts), sixth in the census, says on its page: "This is meant to be traded on the 4 Hour candlestick." Its code is protected, so we can't say what it does.
Breakaway Desk Premium's Trend Radar
The Trend Radar is our 4-hour rule. It is a 20/10 Donchian breakout, long only, on six crypto perpetuals: BTC, ETH, SOL, XRP, BNB and DOGE. A 4-hour close above the 20-candle high enters; the stop sits 2 × ATR(20) below the entry, set once; there is no target; a close below the 10-candle low exits. It draws the trades on the chart you open and keeps all six markets in its table, in a trade or watching, with one alert for all six as text or JSON. It places no orders.
What its one pre-registered test measured, the losing stretch included, is in Does turtle trading still work?: a hypothetical backtest after estimated costs, not a forecast. The study charged the costs the Strategy Tester leaves out: a 0.05% fee per side, one tick of slippage on stops and 0.01% funding per started 8 hours. How the channel itself works is in the Donchian channel strategy, explained.
Ours
Our free 20/10 breakout script, Donchian Breakout 20/10 in R [ProEA], draws the same rule on one chart: a close above the previous 20 candles' high, a 2 × ATR(20) stop set at the entry, out on a close below the previous 10 candles' low, with each trade counted in R. It decides on closed candles and uses highest(high, 20)[1], so a close can break the band. It has no alerts and takes no costs off. Copy the Pine code from this text file and paste it into TradingView's Pine Editor, on a 4-hour chart if you want the Radar's clock.
Breakaway Desk Premium, $49 once, runs the rule on all six markets in its Trend Radar, with one alert for all six. It also holds the same rules in TradingView's Strategy Tester, a Research Lab that downloads Binance's public data and reruns the study, and an alert relay to Discord or Telegram that never places orders. Hypothetical backtest after estimated costs, not a forecast. Never places orders. Its alert, like every alert above, needs a paid TradingView plan: Essential or above.
Check one yourself
- The dates: search for
timestamp(andinput.time. A date filter that ends in the past trades nothing on today's chart. - The costs: look for
commission_valueandslippageon thestrategy(line. When they're missing, the Strategy Tester charges nothing unless you enter them in its properties, and it never charges funding.margin_long=0is infinite leverage. - Volume: search for
volume,obvandvwma, then check the symbol you trade has volume on TradingView. - Other symbols:
request.security(with a ticker that isn'tsyminfo.tickeridreads another market, with its own trading hours. - The future: a
lookahead_onwithout[1]on the value reads a higher-timeframe candle before it closes; asecurity(in Pine v1 or v2 does the same. - The close: look for
barstate.isconfirmedoralert.freq_once_per_bar_close. Without either, an indicator decides on the live candle.
None of these runs on MT5 or MT4: they are written in Pine Script, TradingView's own language.
Limits
One code read, on 29 October 2026, of the versions TradingView served that day. Scripts change, and boosts measure popularity, not quality. We tested none of the 15, and none of their authors' claims. We build and sell Breakaway Desk Premium, and we have no relationship with any author named here. Nothing here is financial advice.
Frequently asked questions
Which indicator is best for crypto trading?
No indicator is best on every coin, and we tested none of the 15 we read. For a trend backtest to start from, ZenAndTheArtOfTrading's Bitcoin Momentum Strategy (1,413 boosts): a close above the 20-week EMA, a trailing stop, 0.15% commission and 150 ticks of slippage, with the weekly EMA read from the last closed week. Its catches: 100% of equity per trade, long only, and no funding, which no TradingView strategy charges. For a trend filter whose alerts wait for the candle to close, QuantitativeAlpha's Crypto Trend Indicator (583 boosts).
What is the most popular crypto indicator on TradingView?
Of the open-source scripts in TradingView's search with crypto, bitcoin or BTC in the name, SoftKill21's Full CRYPTO pack strategy, with 5,223 boosts on 29 October 2026. It buys a MACD turn above a rising 9-candle EMA, with RSI and on-balance volume, and charges 0.1% commission. On its own defaults its date filter ends on 31 December 2021, so it opens no trade on a chart today. Boosts measure popularity, not results.
What is the best crypto trading strategy?
No code read can name one. A peer-reviewed paper by Liu and Tsyvinski found a strong time-series momentum effect in cryptocurrency returns, and a 2025 working paper by Zarattini, Pagani and Barbon, not peer-reviewed, tested Donchian channel trend models on the top 20 coins. Neither tested a script here, and research on the past is not a forecast. Whatever you pick, test it after fees, slippage and funding, on candles you didn't choose it on.
What is a good 4h crypto strategy?
One whose rules you can check: a decision at each 4-hour close, a stop set at the entry, a size worked out from that stop, and costs that include funding. On a market that trades 24/7, every 4-hour candle holds four hours of trading, six a day, so 20 candles are always 80 hours. Breakaway Desk Premium's Trend Radar is one such rule: a 4-hour close above the 20-candle high, a 2 × ATR(20) stop and an exit on a close below the 10-candle low, long only on six crypto perpetuals. Its test is a hypothetical backtest after estimated costs, not a forecast.
Do crypto indicators on TradingView repaint?
None of the 15 we read uses lookahead_on or reads a future candle. Three things still move: indicators that decide on the live candle, such as the Pi Cycle and the Crypto Breakout Indicator; daily values read on an intraday chart, which follow the forming day until it closes; and the Ichimoku strategy's lagging span, drawn 30 candles back as Ichimoku's always is. Set alerts to fire once per bar close. ZenAndTheArtOfTrading's strategy reads its weekly EMA from the last closed week, so its history doesn't peek.
Do TradingView crypto backtests include funding?
No. TradingView's Pine Script manual gives a strategy two trading costs to simulate, commission and slippage, and none of the seven strategies we read builds funding in. On a perpetual, funding is paid or received at each funding time; Bybit's help gives the fee as position value times funding rate, so a 10,000 USDT position at 0.01% pays 1 USDT each time. Add it yourself, or work it out with a funding rate calculator.
Do crypto indicator alerts work on TradingView's free plan?
No. TradingView's pricing page, read on 29 October 2026, shows no technical alerts on indicators, strategies or drawings on Basic, 20 on Essential, 100 on Plus, 400 on Premium and 1,000 on Ultimate. The scripts themselves run on any plan.
Which crypto tool does ProEA make?
Two. A free TradingView script runs the 20/10 Donchian breakout with a 2 × ATR stop on one chart and counts each trade in R. Breakaway Desk Premium, $49 once, runs the same 20/10 rule in its Trend Radar on BTC, ETH, SOL, XRP, BNB and DOGE perpetuals at 4 hours, long only, with one alert for all six. Its test is a hypothetical backtest after estimated costs, not a forecast, and it never places orders.