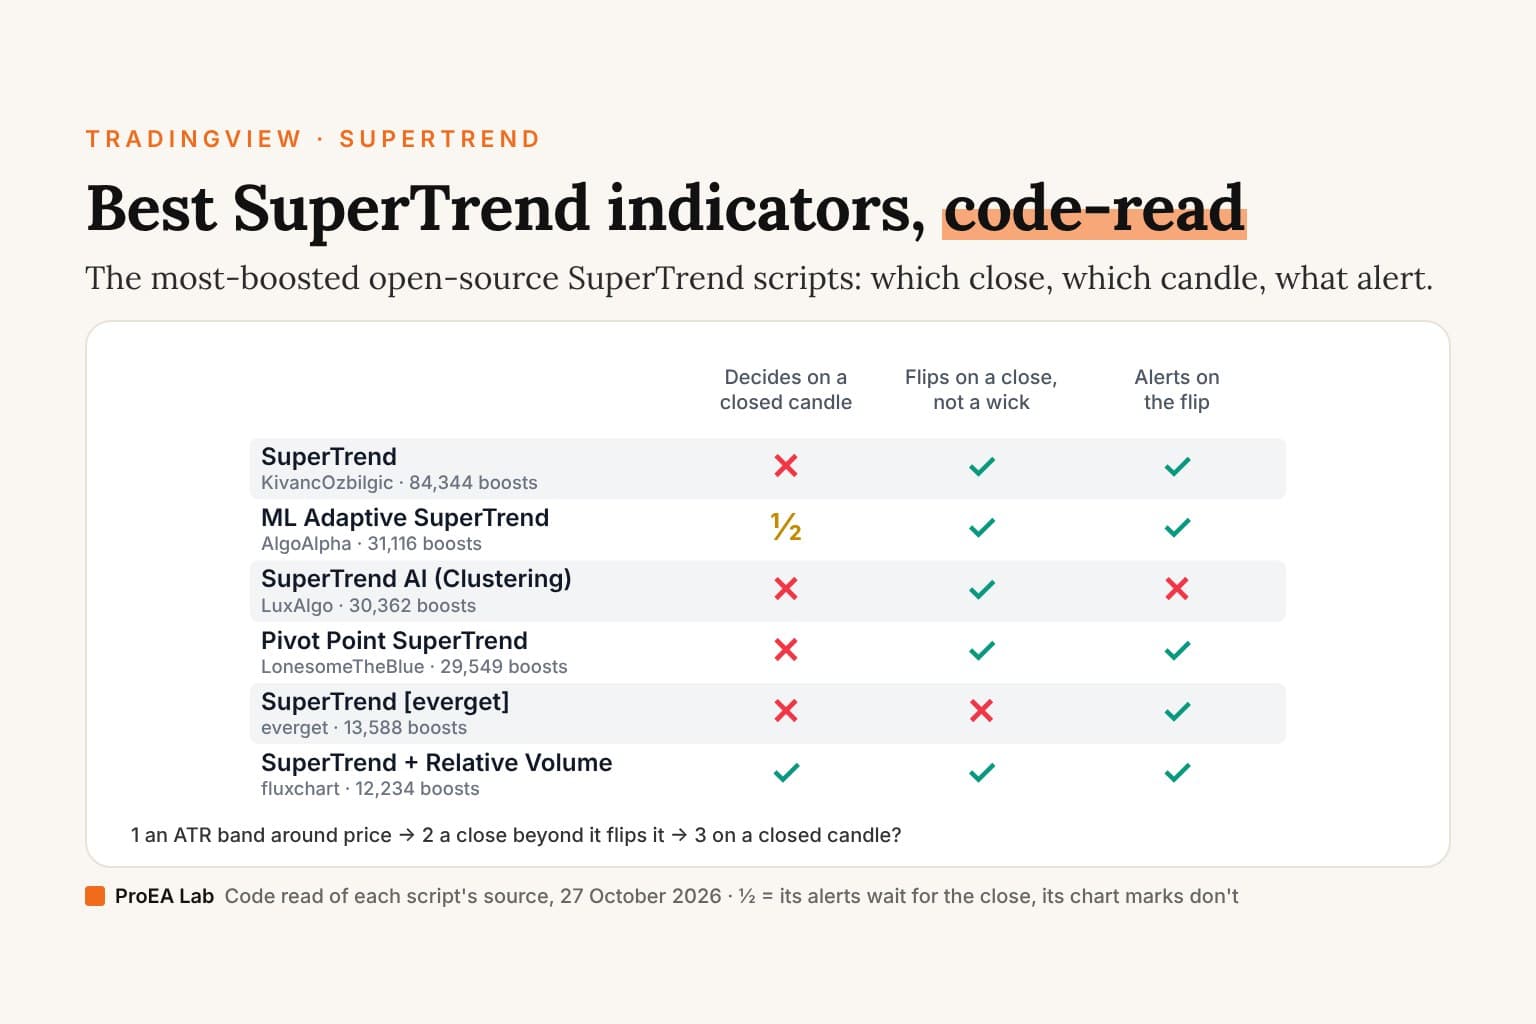
Short answer: the most-boosted SuperTrend on TradingView, KivancOzbilgic's SuperTrend (84,344 boosts), is the classic formula, 3 × ATR(10) around each candle's midpoint, and it decides its Buy and Sell on the live candle. Of the ten most-boosted open-source SuperTrend scripts, start with SuperTrend + Relative Volume by Flux Charts: the same band, built on TradingView's own ta.supertrend, with arrows and alerts that wait for the candle to close. The "AI" in three of the ten is clustering or nearest-neighbour arithmetic on recent candles. None of the ten reads a future candle, and we tested none of their extras.
Most lists name SuperTrend indicators.
This one reads them.
How the indicator itself works, band by band, is in the SuperTrend indicator, explained. This post is about the scripts.
What we checked
We searched TradingView's scripts for six terms on 27 October 2026 ("supertrend", "atr trailing stop", "chandelier exit", "volatility stop", "trend following" and "trend pullback"), which returned 273 scripts. 51 have SuperTrend in their name, and every one of those is open source. We took the ten most-boosted, down to 8,769 boosts, with none skipped, and read every line that draws the band or decides a signal. Six questions:
- The band: which price is the centre, which ATR, and how wide?
- The ratchet and the flip: when may the band move, and what flips it: a close or a wick?
- When it decides: on a closed candle, or on the live one?
- Repainting: does it read another timeframe, a future candle, or a pivot confirmed later?
- The AI: what does the "AI" or "machine learning" part compute?
- Alerts and tests: what can it send you, and if it runs a backtest, with what costs?
One script in that range isn't a SuperTrend: Chandelier Exit [everget] (29,759 boosts) hangs its stop from the highest close and the lowest close of 22 candles by default, not from the candle's midpoint, so it is in the ATR trailing stop roundup instead.
One of the ten is a strategy, KivancOzbilgic's SuperTrend STRATEGY, and it sets no commission, slippage or position size in its code. Two print tables of their clusters on the chart, AlgoAlpha's and LuxAlgo's; neither is a backtest.
The table
Boosts as TradingView's search showed them on 27 October 2026. "Midpoint" is each candle's (high + low) / 2, hl2 in Pine. ATR is Pine's built-in atr, unless the row says otherwise.
| Script | Boosts | The band, by default | What flips it | Decides on | Alerts |
|---|---|---|---|---|---|
| SuperTrend (KivancOzbilgic) | 84,344 | Midpoint ± 3 × ATR(10); a simple average of true range as an option | A close beyond the last candle's band | The live candle | Buy, Sell, direction change |
| Machine Learning Adaptive SuperTrend [AlgoAlpha] | 31,116 | Midpoint ± 3 × one of three cluster averages of ATR(10) | A close beyond the band | Chart marks: the live candle; alerts: closed candles | Trend shifts, volatility changes |
| SuperTrend AI (Clustering) [LuxAlgo] | 30,362 | Midpoint ± ATR(10) × a multiplier between 1 and 5, picked again every candle | A close beyond the band | The live candle | None |
| Pivot Point Supertrend (LonesomeTheBlue) | 29,549 | A running average of pivots ± 3 × ATR(10) | A close beyond the last candle's band | The live candle | Buy, Sell, trend change |
| SuperTrend STRATEGY (KivancOzbilgic) | 25,572 | As SuperTrend | As SuperTrend | The close, as a strategy | None; it trades every flip |
| SuperTrend EXPLORER / SCREENER (KivancOzbilgic) | 16,546 | As SuperTrend, also run on 38 listed symbols | As SuperTrend | The live candle; a "Confirmed" list one candle later | The chart's symbol only |
| SuperTrend [everget] | 13,588 | Midpoint ± 3 × ATR(22) | A wick through the last candle's band (a close, as an option) | The live candle, when a wick crosses | Buy, Sell, direction change |
| SuperTrend + Relative Volume (Kernel Optimized) (fluxchart) | 12,234 | ta.supertrend, 3 × ATR(10) | A close beyond the band | Closed candles | Bullish, Bearish |
| Volume SuperTrend AI (Expo) (Zeiierman) | 9,193 | A volume-weighted average of the close (10) ± 3 × ATR(10) | A close beyond the band | The live candle | Six: trend starts and trend signals |
| BEST Supertrend CCI (Daveatt) | 8,769 | Midpoint ± 3 × ATR(3) | CCI(28) crossing zero, not price | The live candle | None |
| Drift Desk (ours) | — | hlc3 shifted by candle pressure ± 2 × ATR(14) | A close beyond the last candle's band | Closed candles | Paper plan, flip, 1R, resolved; JSON |
Eight of the ten flip on a close. Only Flux Charts' script decides both its signals and its alerts on closed candles; AlgoAlpha's alerts wait for the close, its chart marks don't, and the STRATEGY acts on the close but has no alerts of its own. That, on the classic band, is why Flux Charts' is the free one we'd start with. If you'd rather have the plain classic, KivancOzbilgic's SuperTrend is the same band: set its alerts to fire once per bar close.
What the code says
KivancOzbilgic's SuperTrend is the reference, and it decides on the live candle. In Pine v4, it puts a band 3 × ATR(10) below and above each candle's midpoint (its Source input, hl2 by default). The ATR is Pine's atr(); switch off the input "Change ATR Calculation Method ?" and it becomes a simple average of true range. The lower band may only rise while the previous close stayed above it, the upper band may only fall while the previous close stayed below it, and the trend flips when a close crosses the previous candle's opposite band. Nothing waits for the candle to close, so a Buy or Sell can print mid-candle and be gone if the candle closes back inside. Its study( line carries resolution="", a timeframe setting left on the chart's own, and it reads no future candle, so nothing changes once a candle has closed. It has three alerts (Buy, Sell, direction change), and its code carries no licence line.
AlgoAlpha's Machine Learning Adaptive SuperTrend clusters the ATR, not the price. On every candle it takes the last 100 values of ATR(10), starts three centres at 75%, 50% and 25% of their range, and runs k-means until the centres stop moving. The band is then 3 × the average of whichever cluster the current ATR is nearest, not 3 × the ATR itself, around the midpoint, and it flips on a close beyond the band. That is the "machine learning". It reads no future candle, so history doesn't change, but the band's width steps between three levels whenever the cluster changes. The ▲ and ▼ on the chart are decided on the live candle; its alerts (two trend shifts and three volatility changes, the low one written twice) wait for barstate.isconfirmed. Its table swaps two numbers: the High row shows the low cluster's size, and the Low row the high cluster's. Pine v5, MPL 2.0.
LuxAlgo's SuperTrend AI picks its multiplier from recent results. It runs nine SuperTrends on ATR(10), with multipliers from 1 to 5 in steps of 0.5, and scores each with a 10-candle exponential average of its candle-by-candle gain in price: the move from the last close, counted as a gain when the previous close was above that band and price rose, or below it and price fell. No costs. On every candle, k-means sorts the nine scores into three clusters, and the line you see is a tenth SuperTrend whose multiplier is the average of the "Best" cluster's. So the multiplier changes from candle to candle, following whatever scored best lately. It reads no future candle, and it computes only the chart's last 10,000 candles. The number on each signal label is a 0 to 10 "performance index": the best cluster's average score divided by the average size of a candle's move. Signals are decided on the live candle, and there are no alerts at all. Pine v5, CC BY-NC-SA 4.0.
LonesomeTheBlue's Pivot Point Supertrend centres the band on pivots. It finds pivot highs and lows with 2 candles on each side, so each is confirmed 2 candles after it forms, and moves a centre line a third of the way to each new pivot: (centre × 2 + pivot) / 3. The bands sit 3 × ATR(10) either side of that centre, move only toward price while the previous close holds, and flip when a close crosses the previous candle's band, on the live candle. The band uses each pivot only from the candle that confirms it, so its history doesn't change. The optional pivot labels and support and resistance dots, both off by default, are drawn 2 candles back, on the pivot itself: looking back, they appear 2 candles before they were known. Three alerts. Pine v4, MPL 2.0.
KivancOzbilgic's SuperTrend STRATEGY is the same band, always in a trade. The band and the flip are the indicator's, line for line. Each Buy enters long and each Sell enters short, reversing the position, from 1 September 2018, with no stop, no target and no exit but the next flip. Its strategy( line sets no commission, slippage or position size, so its Strategy Tester results carry no costs unless you enter them in the tester's properties. Its Buy and Sell labels are off by default, its candles are coloured by the previous candle's trend, and it has no alerts. Pine v4, MPL 2.0.
KivancOzbilgic's SuperTrend EXPLORER / SCREENER adds 38 symbols. On the chart it is the same SuperTrend with the same three alerts. It also runs the trend on 38 symbols set in its inputs (by default, among them, crypto pairs, US and Turkish stocks, forex, gold and oil) through security() on the chart's own timeframe, with no lookahead argument, and prints one label: "Potential Reversal" lists the symbols whose trend flipped on the live candle, and "Confirmed Reversal" the ones that flipped on the last closed candle. The 38 have no alerts, and their SuperTrend uses the midpoint whatever the Source input says. Its last lines request the chart's own trend a second way and never use it. Pine v4, MPL 2.0, its screener logic credited to zzzcrypto123.
everget's SuperTrend flips on a wick by default. Its band is 3 × ATR(22) around the midpoint. With "Take Wicks into Account" on, the default, the long stop may only rise while the previous candle's low stayed above it, and the trend flips when a candle's high or low goes beyond the previous candle's opposite band, not on a close. So the flip is decided the moment a wick gets there, mid-candle, and it stays even if the candle closes back inside. Turn the input off and it flips on the close instead. A candle whose open, high, low and close are all equal leaves both stops where they were. Three alerts (direction change, Buy, Sell), with the exchange and ticker in the message. Pine v6, GPL-3.0.
Flux Charts' SuperTrend + Relative Volume waits for the close. The band is TradingView's own ta.supertrend(3, 10), and its arrows and alerts come only from a close crossing the band on a confirmed candle (barstate.isconfirmed). The line itself still switches sides as soon as price crosses it mid-candle, but it stays grey until a closed candle confirms the flip. The "kernel" part: at each flip it stores a relative volume, an estimate of buying (or selling) volume from where each candle closed in its range, averaged over 10 candles and divided by its 25-candle average. It keeps the last 100 per side and fits a Gaussian kernel density to them, then labels each flip with where its volume falls in that spread ("Vol: x%") and shades the band by it. A filter that keeps only flips at or above 70% is there, off by default. The multiplier input takes whole numbers only, so 2.5 isn't possible. Without volume data it shows a warning and draws no band, and until it has stored 100 flips on each side it shows "Not enough data". Its colour inputs are labelled the wrong way round: "Bullish Break" sets the bearish colour. Two alerts, Bullish Trend and Bearish Trend. Pine v6, MPL 2.0.
Zeiierman's Volume SuperTrend AI centres the band on volume. The centre is a volume-weighted average of the close (by default a 10-candle WMA of close × volume, divided by one of volume; four other averages are options), with bands 3 × ATR(10) either side that flip on a close. The "AI" is a weighted nearest-neighbour vote, k = 3 over the last 10 candles. Each candle is labelled up when the 20-candle WMA of the close is above the 100-candle WMA of the SuperTrend line, and the vote compares SuperTrend values. The current candle is always one of its own three neighbours, at distance zero. The line is coloured up only when all three are labelled up, down when all three are down, and blue otherwise. Its triangles need a flip and the matching colour on the same candle; its circles mark a colour change. Everything is decided on the live candle. It has six alerts, and it needs volume. Pine v6, CC BY-NC-SA 4.0.
Daveatt's BEST Supertrend CCI is a CCI switch drawn at a SuperTrend's distance. Its band is 3 × ATR(3) around the midpoint, but price never flips it: the trend is up while CCI(28) of the close is above zero and down while it is below, and the band's ratchet follows the CCI too. The line is coloured by whether the close is above or below it, so in an up trend it turns red whenever the close dips under it, with no change of trend. No signals and no alerts. Pine v4, no licence line.
Repainting, and what the AI is
None of the ten reads a future candle: none uses lookahead, and the screener's security() calls ask for the chart's own timeframe. Once a candle has closed, nothing in its band or its signal changes, with one exception: Pivot Point Supertrend's optional markers, drawn 2 candles before they were known. What still moves is the live candle:
- Signals. All but Flux Charts' chart signals are decided as the candle forms, so a flip can print and vanish before the close; everget's, once a wick goes beyond the band, stays even if the close goes back inside. More in how to tell if an indicator repaints.
- The band's width and colour. The clustering and the neighbours are re-run on every candle, from past candles plus the live one. History stays put, but on the live candle AlgoAlpha's width, LuxAlgo's multiplier and Zeiierman's colour can change as the price moves.
Three names say AI or machine learning; with Flux Charts' kernel, the extras are four calculations, none of which forecasts a price:
- AlgoAlpha: k-means, three clusters, on the last 100 ATR values. It picks a width.
- LuxAlgo: k-means, three clusters, on nine SuperTrends' recent scores before costs. It picks a multiplier.
- Zeiierman: the 3 nearest of the last 10 candles by SuperTrend value. It picks a colour.
- Flux Charts: a kernel density of relative volume at the last 100 flips. It labels each flip, and can filter them.
Settings
Seven of the ten default to ATR(10) and a multiplier of 3: KivancOzbilgic's three scripts, AlgoAlpha's (as the ATR it clusters), Pivot Point Supertrend (around its pivot centre), Flux Charts' and Zeiierman's (around its volume-weighted centre). everget's uses ATR(22) and 3, Daveatt's ATR(3) and 3, and LuxAlgo's picks a multiplier between 1 and 5 every candle. Drift Desk uses ATR(14) and 2, around its own centre.
Nothing in the ten scripts' code tests its defaults, and we tested none of them. Two things follow from the arithmetic alone: a smaller multiplier puts the band nearer price, so closes cross it more often and it flips more; and a longer ATR changes more slowly. Which setting suits your market is a question for a test on that market, after costs, on candles you didn't pick the setting on.
Ours
Drift Desk isn't one of the scripts counted above: its full Pine v6 source comes in Pine Pro Library, $49 once. Its trail is SuperTrend-family. The centre is hlc3, the average of high, low and close, shifted by a candle-pressure read: hlc3 + drift × ATR × 0.5. Pressure scores where each candle closes in its range and how much of it is body, weighted by relative volume (capped at 3 times the average); drift is the gap between an 8- and a 21-candle EMA of that score, divided by its own 50-candle standard deviation and held between −3 and +3. So the centre leans up to 1.5 ATR toward the pressure. The bands sit 2 × ATR(14) either side and may only move toward price while the previous close holds, and a close beyond the previous candle's band flips the trail. All of it is decided on closed candles.
A confirmed flip becomes an entry candidate only when its checks pass: enough history for its averages, 20 candles in a row with volume (or a feed that has carried none, which runs price-only), and a valid plan. The stop sits beyond the lowest low or highest high of the 10 candles before the flip, plus 0.25 ATR; 1R is observed and changes nothing; the target is at 2R; and an open plan closes at the close after 120 candles. One paper plan runs at a time. An EMA, path efficiency, timeframe agreement, a New York session, a higher-timeframe EMA and a long-only switch are optional checks, off by default; higher timeframes are read only as their last completed candle. Five alerts (long paper plan, short paper plan, trail flip, 1R observed, paper resolved), and a JSON alert for each accepted plan, once per bar close. Its paper record is gross, before costs, and hidden by default. An opt-in research lab runs 12 settings (ATR 10, 14 or 21, multipliers 1.5 to 3), picks one on a training window only, then follows it through a later one, charging 0.04% commission and 1 tick per side.
Drift Desk Premium, $49 once, does the work around each flip on the chart: it reads the bigger trend, waits for the pullback, sizes the plan to your lot step with fees in R, manages the stop (half off and the stop to entry at 1R, then the Drift trail) and scans 20 symbols with one alert. You place the orders. Premium is a toolset: its signals are not proven to earn more.
What the desk's default rule, version 1.3.1, did when we ran it is in Drift Desk: what we measured. Premium's extras weren't part of that test.
Check one yourself
- The flip: find the line that sets the trend.
close > dn1orclose > upperBandflips on a close;highPrice > shortStopPrev(with wicks on) flips on a wick; accithere means price doesn't flip it at all. - The close: look for
barstate.isconfirmedon the signal and on the alert, or for astrategy(call, which runs on the close by default. Without either, a flip you see live may not be there when the candle closes; setting the alert to fire once per bar close is the workaround. - The future: search for
lookahead,security(andoffset =. Alookahead_onreading a higher timeframe without[1]on its value sees that candle before it closes, and a negativeoffsetdraws a value on a candle before it was known. - The AI: find the array the clustering or the neighbours read. If its values come from the current and past candles (
[0]and up), it can't see the future; then ask what it picks: a width, a multiplier or a colour. - The costs: in a strategy, look for
commission_valueandslippageon thestrategy(line; in a table, look for a cost being subtracted.
None of the scripts here, ours included, runs on MT5, MT4 or thinkorswim: they are written in Pine Script, TradingView's own language.
Limits
One code read, on 27 October 2026, of the versions TradingView served that day. Scripts change, and boosts measure popularity, not quality. We tested none of the ten. We build and sell Drift Desk and Drift Desk Premium, and we have no relationship with any author named here. Nothing here is financial advice.
Frequently asked questions
Which SuperTrend indicator is best on TradingView?
Of the ten most-boosted open-source SuperTrend scripts, start with SuperTrend + Relative Volume (Kernel Optimized) by Flux Charts (12,234 boosts). Its band is TradingView's own ta.supertrend, 3 × ATR(10) around each candle's midpoint, and it is the only one of the ten whose signals and alerts both wait for the candle to close. Its relative volume reading labels each flip and is off as a filter by default. Two catches: its multiplier takes whole numbers only, and without volume data it draws no band.
What is the most popular SuperTrend indicator on TradingView?
KivancOzbilgic's SuperTrend, with 84,344 boosts on 27 October 2026, more than twice the next. It draws 3 × ATR(10) below and above each candle's midpoint, lets the band move only toward price while price holds, and flips when a close crosses the previous candle's band. It decides on the live candle, so a Buy or Sell can print mid-candle and be gone at the close. It has three alerts: Buy, Sell and direction change.
How does the SuperTrend indicator give buy and sell signals?
In eight of the ten scripts the same way: a band sits a multiple of ATR from price and moves only toward it, and a close beyond the band flips its side and prints Buy or Sell. The exceptions are SuperTrend [everget], which by default flips when a wick goes beyond the band, and BEST Supertrend CCI, which flips when CCI(28) crosses zero and prints no signals. Most decide on the live candle; Flux Charts' version waits for the close before its arrow and its alert.
What are the best SuperTrend settings?
No setting is best on every market, and we tested none of them. Seven of the ten default to an ATR of 10 and a multiplier of 3. SuperTrend [everget] uses 22 and 3, BEST Supertrend CCI uses 3 and 3, and LuxAlgo's SuperTrend AI picks a multiplier between 1 and 5 from recent results; ours uses 14 and 2 around a shifted centre. A smaller multiplier puts the band nearer price, so closes cross it more often and it flips more. Test a setting on your own market, after costs, on candles you didn't choose it on.
Is there an indicator better than SuperTrend?
We didn't test that, so we can't say. The variants here each change one part of it: the centre (pivots, a volume-weighted average, or our candle-pressure shift), the width (a clustered ATR, or a multiplier picked from recent results), the trigger (a wick, or CCI), or they add a filter (relative volume, a nearest-neighbour colour). None of the ten reads future candles. What we measured on our own SuperTrend-family desk is in its study.
Does SuperTrend AI by LuxAlgo repaint?
Not its history: it reads no future candle and no other timeframe. Its AI is k-means clustering of how nine SuperTrends, with multipliers from 1 to 5, scored over a 10-candle exponential average, before costs; the line you see uses the average multiplier of the best cluster, so its multiplier changes from candle to candle. It decides on the live candle, so a signal can print and vanish before the close, and it has no alerts.
Which SuperTrend-style indicator does ProEA make?
Drift Desk, in Pine Pro Library, $49 once with its full Pine v6 source. Its trail sits 2 × ATR(14) either side of a centre shifted by candle pressure, and it flips only on a closed candle; a flip becomes an entry only when its checks pass, with a stop beyond the last 10 candles' low or high and a target at 2R. Drift Desk Premium, $49 once, adds the bigger trend, a wait for the pullback, size and fees before entry, managed stops (half off and the stop to entry at 1R, then the Drift trail) and a 20-symbol scanner. Premium is a toolset: its signals are not proven to earn more.