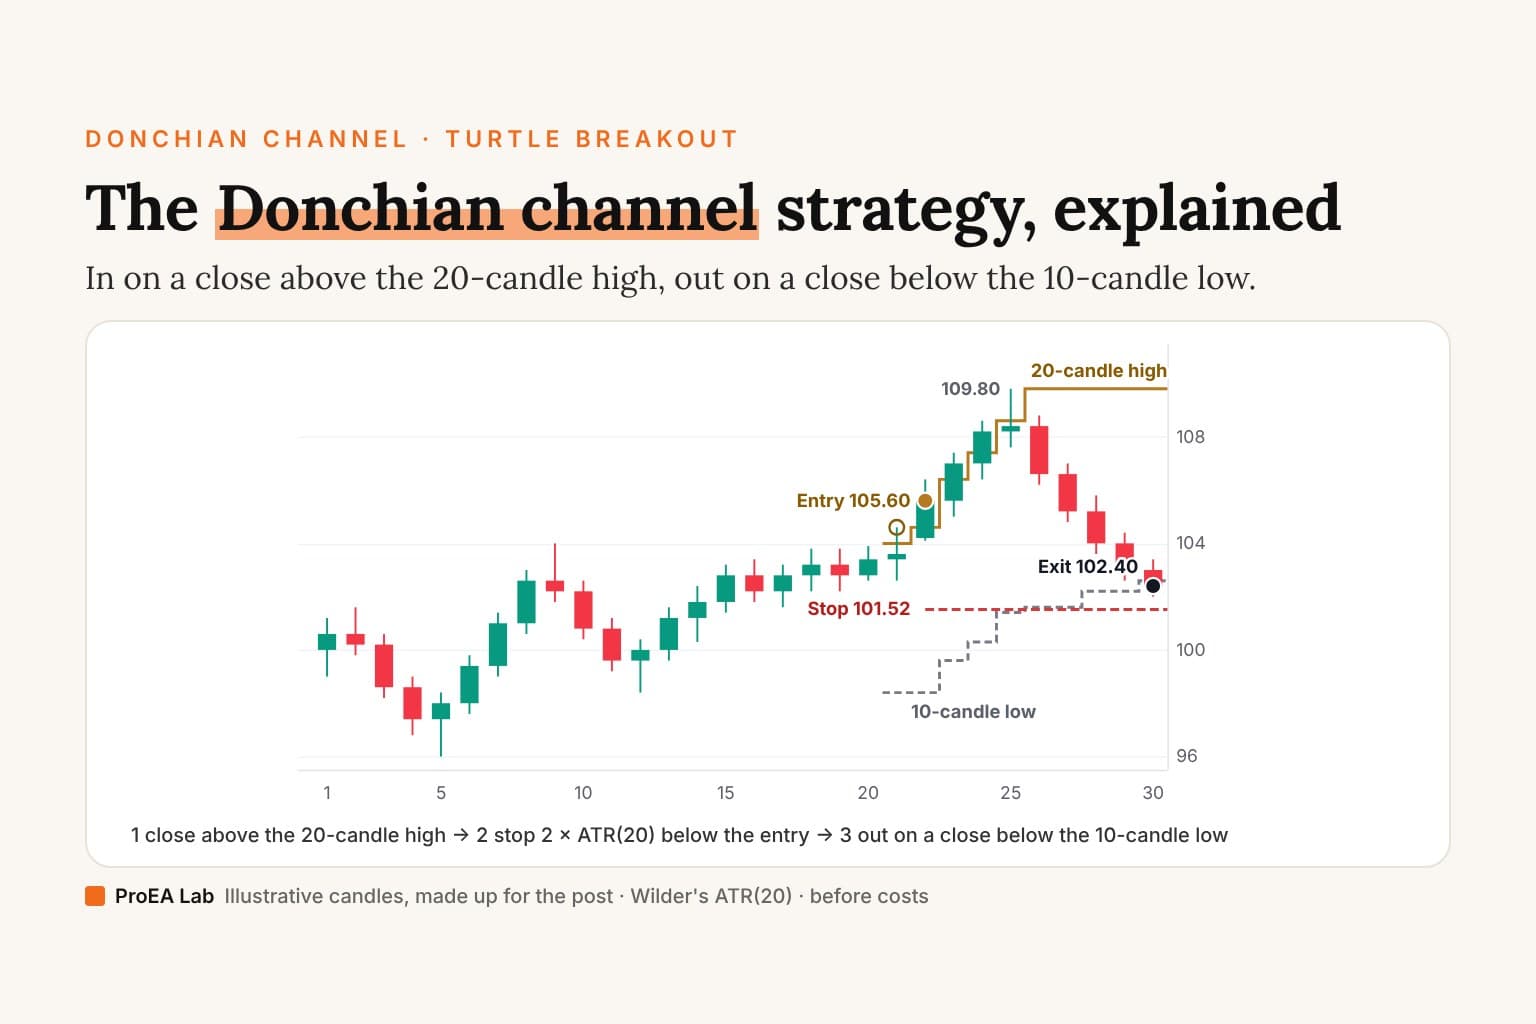
Short answer: a Donchian channel draws the highest high and the lowest low of the last N candles, 20 by default, with a middle line halfway between them. The classic strategy built on it is a breakout. Buy a close above the 20-candle high, put the stop 2 × ATR below the entry, and get out on a close below the 10-candle low. The entry and exit lengths are the Turtle traders' System 1.
This post defines each part exactly, then works one trade out on 30 illustrative candles, with a drill so you can mark the entry, the stop and the exit before reading the answer. After that come the 1983 experiment that produced the Turtle rules and the rules in their own words, Donchian against Bollinger Bands and Keltner Channels, what the settings change, the channel on intraday charts, and the indicator on TradingView and MT5.
What is the Donchian channel?
TradingView's help page for the indicator (read 29 October 2026): "The Donchian Channels (DC) indicator was created by the famous commodities trader Richard Donchian. Donchian would become known as The Father of Trend Following." It calculates the channel with a 20-period example, "a very commonly used timeframe":
- Upper Channel = 20 Day High
- Lower Channel = 20 Day Low
- Middle Channel = (20 Day High + 20 Day Low)/2
In the same page's words: "The Upper Band is the high price for the period. The Lower Band is the low price for the period. The Middle Line is simply the average of the two." The length is the one setting, and on TradingView "20 is the Default".
StockCharts covers the same lines under the name Price Channels: "This indicator, developed by Richard Donchian, is sometimes referred to as Donchian Channels." It adds a detail that decides how a breakout is read: "The Price Channel formula doesn't include the most recent period. Price Channels are based on prices prior to the current period." If the current candle were inside the window, its close could never sit above the upper line, because the line would already include that candle's high. So a breakout means a price above the high of the previous N candles, not counting the one that breaks out.
How does the Donchian channel work?
The channel doesn't trade by itself; it marks the range. A breakout strategy reads it in three parts:
- The entry. A candle closes above the upper line, the highest high of the previous 20 candles. That's a long entry at the close. (The Turtle traders didn't wait for the close; see their rules below.)
- The stop. A fixed distance below the entry, set once at the entry: 2 × ATR, the average true range of 20 candles.
- The exit. No profit target. The trade stays on until a candle closes below the lower line of a shorter channel, the lowest low of the previous 10 candles.
Shorts mirror it: a close below the 20-candle low, a stop 2 × ATR above the entry, out on a close above the 10-candle high.
The ATR is Wilder's. StockCharts' ATR page defines the true range as the greatest of "Current High less the current Low", "Current High less the previous Close (absolute value)" and "Current Low less the previous Close (absolute value)". The first ATR "is the average of the daily TR values for the last 14 days", and after that each one is "Current ATR = [(Prior ATR x 13) + Current TR] / 14". Over 20 candles the same smoothing reads ATR = (prior ATR × 19 + TR) ÷ 20. That is exactly the Turtle rules' N: "N = (19 × PDN + TR) / 20", started with "a 20-day simple average of the True Range".
The four rules (the entry, the stop, no target, the exit), the formula, Wilder's ATR and the sizing line fit on one page: the Turtle and Donchian breakout cheat sheet (PDF).
The Donchian channel breakout strategy on 30 candles
The 30 candles below are made up for this explainer: a range, a coil under its high, a breakout, a run and a fall. They aren't a market and they aren't a result. Mark the entry, the stop and the exit before you step through the answer.
Mark it yourself first.
Where does a close first clear the 20-candle high? Where does a stop 2 × ATR(20) below that close go? Which close falls below the 10-candle low? The candles are in the table under the drill.
Illustrative candles, made up for this explainer: not a market and not a result. The rule: a close above the 20-candle high enters long, the stop sits 2 × ATR(20) below (Wilder's ATR), a close below the 10-candle low exits. No costs.
| Candle | Open | High | Low | Close |
|---|---|---|---|---|
| 1 | 100.00 | 101.20 | 99.00 | 100.60 |
| 2 | 100.60 | 101.60 | 99.80 | 100.20 |
| 3 | 100.20 | 100.60 | 98.20 | 98.60 |
| 4 | 98.60 | 99.00 | 96.80 | 97.40 |
| 5 | 97.40 | 98.40 | 96.00 | 98.00 |
| 6 | 98.00 | 99.80 | 97.60 | 99.40 |
| 7 | 99.40 | 101.40 | 99.00 | 101.00 |
| 8 | 101.00 | 103.00 | 100.60 | 102.60 |
| 9 | 102.60 | 104.00 | 101.80 | 102.20 |
| 10 | 102.20 | 102.60 | 100.40 | 100.80 |
| 11 | 100.80 | 101.20 | 99.20 | 99.60 |
| 12 | 99.60 | 100.40 | 98.40 | 100.00 |
| 13 | 100.00 | 101.60 | 99.60 | 101.20 |
| 14 | 101.20 | 102.40 | 100.30 | 101.80 |
| 15 | 101.80 | 103.20 | 101.40 | 102.80 |
| 16 | 102.80 | 103.40 | 101.80 | 102.20 |
| 17 | 102.20 | 103.20 | 101.60 | 102.80 |
| 18 | 102.80 | 103.80 | 102.20 | 103.20 |
| 19 | 103.20 | 103.80 | 102.20 | 102.80 |
| 20 | 102.80 | 103.90 | 102.60 | 103.40 |
| 21 | 103.40 | 104.60 | 102.60 | 103.60 |
| 22 | 104.20 | 106.40 | 104.10 | 105.60 |
| 23 | 105.60 | 107.40 | 105.00 | 107.00 |
| 24 | 107.00 | 108.60 | 106.40 | 108.20 |
| 25 | 108.20 | 109.80 | 107.60 | 108.40 |
| 26 | 108.40 | 108.80 | 106.20 | 106.60 |
| 27 | 106.60 | 107.00 | 104.80 | 105.20 |
| 28 | 105.20 | 105.80 | 103.60 | 104.00 |
| 29 | 104.00 | 104.40 | 102.60 | 103.00 |
| 30 | 103.00 | 103.40 | 102.00 | 102.40 |
The drill. Using the rule above (a close above the 20-candle high enters, the stop sits 2 × ATR(20) below, a close below the 10-candle low exits):
- Which candle first closes above its 20-candle high, and at what price?
- ATR(20) is 2.00 after candle 20, because the first 20 true ranges add up to 40.0. Where does the stop go?
- Which candle closes below its 10-candle low, and at what price?
- How many R did the trade make or lose, before costs?
The answer, step by step
1. The entry: 105.60 on candle 22. On candle 21 the 20-candle high is the highest high of candles 1 to 20: 104.00, on candle 9. Candle 21 trades up to 104.60 but closes at 103.60, under 104.00, so a close rule doesn't enter. On candle 22 the window is candles 2 to 21, and candle 21's wick has lifted the 20-candle high to 104.60. Candle 22 closes at 105.60, above 104.60.
Candles 23 and 24 also close above their 20-candle highs (106.40 and 107.40). They aren't new entries, because the trade is already on.
2. The ATR: 2.04 at candle 22. Every candle here but one opens at the previous close, so its true range is simply its high minus its low. Candles 1 to 20 have true ranges of 2.2, 1.8, 2.4, 2.2, 2.4, 2.2, 2.4, 2.4, 2.2, 2.2, 2.0, 2.0, 2.0, 2.1, 1.8, 1.6, 1.6, 1.6, 1.6 and 1.3, which add up to 40.0, so the first ATR(20) is 40.0 ÷ 20 = 2.00. Then Wilder's update, one candle at a time:
- Candle 21: true range = 104.60 − 102.60 = 2.00. ATR = (2.00 × 19 + 2.00) ÷ 20 = 2.00.
- Candle 22 opens at 104.20, above candle 21's 103.60 close, and its low of 104.10 never comes back down to that close. So its true range is the high minus the previous close, 106.40 − 103.60 = 2.80, not the high minus the low, 2.30. ATR = (2.00 × 19 + 2.80) ÷ 20 = 40.80 ÷ 20 = 2.04.
3. The stop: 101.52. 2 × 2.04 = 4.08 below the entry: 105.60 − 4.08 = 101.52. That 4.08 is what the trade risks, 1R. Sizing follows from it: with $100 at risk, the size is 100 ÷ 4.08 = 24.5 units, rounded down to your lot step. The Turtle position size calculator does the same sum for your own account and market.
4. The exit: 102.40 on candle 30. The 10-candle low is the lowest low of the 10 candles before each one:
| Candle | 10-candle low | Low | Close | |
|---|---|---|---|---|
| 22 | 98.40 | 104.10 | 105.60 | entry |
| 23 | 99.60 | 105.00 | 107.00 | |
| 24 | 100.30 | 106.40 | 108.20 | |
| 25 | 101.40 | 107.60 | 108.40 | |
| 26 | 101.60 | 106.20 | 106.60 | |
| 27 | 101.60 | 104.80 | 105.20 | |
| 28 | 102.20 | 103.60 | 104.00 | |
| 29 | 102.20 | 102.60 | 103.00 | |
| 30 | 102.60 | 102.00 | 102.40 | exit: close below 102.60 |
No low reached the 101.52 stop (the lowest was candle 30's 102.00), so the 10-candle low ended the trade first.
5. The result: −0.78R before costs. (102.40 − 105.60) ÷ 4.08 = −3.20 ÷ 4.08 = −0.78R. At candle 25's high of 109.80 the trade was 4.20 up, about +1.03R. With no target, it gave that back and more.
That is the ordinary breakout trade. A 10-candle exit can't lock in a gain until the trade is more than 10 candles old: until then its window still holds the entry candle's low and the candles before it, all below the entry. The Turtle rules say it plainly: "Most breakouts do not result in trends. This means that most of the trades that the Turtles made resulted in losses." What makes up for them, when anything does, is the occasional trend that runs long enough for the 10-candle low to climb above the entry.
A Turtle would have traded candle 21 differently. Their rules: "Turtles always traded at the breakout when it was exceeded during the day, and did not wait until the daily close or the open of the following day." On these candles a Turtle would have bought one tick above 104.00 during candle 21. The close rule skipped candle 21, which closed back under the line, and paid more to get in on candle 22.
The turtle trading experiment: Richard Dennis, William Eckhardt and 1983
The rules below are the ones Dennis and Eckhardt taught "to their students in the 1980s", and the Original Turtles site's story page tells how that began (read 29 October 2026): "In mid-1983 famous commodities trader Richard Dennis was having an ongoing dispute with his long-time friend Bill Eckhardt about whether great traders were born or made. Dennis believed that he could teach people to become great traders. Eckhardt thought genetics were the determining factor."
- The ad. "They took out a large ad advertising positions for trading apprentices in Barron's, the Wall Street Journal and the New York Times."
- The training. "This group was invited to Chicago and trained for two weeks at the end of December, 1983. They began trading small accounts at the beginning of January. After they proved themselves, Dennis funded most of the trainees with $1 million in February."
- Two classes. Wikipedia's article on Dennis, a tertiary source, says he "recruited and trained 21 men and two women, in two groups, one from December 1983, and the other from December 1984."
- A line from 1989. The story page quotes a line from Stanley W. Angrist's Wall Street Journal article of 5 September 1989: "We are going to grow traders just like they grow turtles in Singapore."
- The result, in the site's words. "The Turtles became the most famous experiment in trading history because over the next four years, they earned an aggregate sum of over $100 million dollars." That is the site's claim, and the site now sits on tradingblox.com, a backtesting-software vendor's domain; we haven't seen the accounts behind it.
Eckhardt went on to run his own firm. Eckhardt Trading Company's site says it was "Established in 1991 by Bill Eckhardt" and lists him as "William Eckhardt / Founder & Chief Research Scientist".
None of that says what the rules do today. For one modern test of the System 1 lengths, see what we measured, below.
Donchian channel turtle trading: the original rules
The rules come from "The Original Turtle Trading Rules", a PDF on the Original Turtles site, now hosted by Trading Blox at tradingblox.com/originalturtles. The site describes it as "The complete rules of the Turtle Trading System, as taught by Richard Dennis and William Eckhardt to their students in the 1980s — published in full, and free, by one of the original Turtles." The scan we read on 29 October 2026 prints no author's name and no year on its pages, and its first six printed pages are missing.
The PDF's chapter on entries opens: "The Turtles used two related system entries, each based on Donchian's channel breakout system." It defines the term: "A breakout is defined as the price exceeding the high or low of a particular number of days. Thus a 20-day breakout would be defined as exceeding the high or low of the preceding 20 days."
| System 1 | System 2 | |
|---|---|---|
| In the PDF's words | "A shorter-term system based on a 20-day breakout" | "A simpler long-term system based on a 55-day breakout" |
| Entry | "the price exceeded by a single tick the high or low of the preceding 20 days" | "the price exceeded by a single tick the high or low of the preceding 55 days" |
| Exit | "a 10 day low for long positions and a 10 day high for short positions" | "a 20 day low for long positions and a 20 day high for short positions" |
| Filter | Entries "would be ignored if the last breakout would have resulted in a winning trade", with a 55-day "Failsafe Breakout" so a big move isn't missed | "All breakouts for System 2 would be taken whether the previous breakout had been a winner or not" |
The rest of the rules size, stop and add to those entries:
- N, the volatility. "N is simply the 20-day exponential moving average of the True Range, which is now more commonly known as the ATR." The formula is "N = (19 × PDN + TR) / 20", where PDN is the previous day's N and TR the current day's true range: Wilder's smoothing over 20 days.
- Units. "Units were sized so that 1 N represented 1% of the account equity": "Unit = 1% of Account / (N × Dollars per Point)". The PDF's worked example is heating oil, with N = 0.0141, a $1,000,000 account and 42,000 dollars per point. It gives "Unit Size = 16.88", which is "truncated to an even 16 contracts."
- The 2N stop. "No trade could incur more than 2% risk." "Turtle stops were set at 2 N below the entry for long positions, and 2 N above the entry for short positions."
- Pyramiding. "Turtles entered single Unit long positions at the breakouts and added to those positions at ½ N intervals following their initial entry." When a unit was added, "the stops for earlier units were raised by ½ N."
- Limits. 4 units in a single market, 6 in closely correlated markets, 10 in loosely correlated markets and 12 in one direction, long or short.
The drill's rule keeps System 1's lengths and the 2N stop, and simplifies the rest. It waits for the close, takes every breakout (no skip after a winner), holds one position without adding, and sizes so the stop distance is the amount at risk. At 1% risk, that is half a Turtle unit, since a Turtle unit with its 2N stop risked 2%.
Not to be confused with ICT's turtle soup, a different setup that trades against a failed break of an old 20-day extreme.
Donchian channel vs Bollinger Bands vs Keltner Channels
John Bollinger, on his own site, puts the difference in one line: "Donchian bands use recent highs and lows and Keltner bands use Average True Range as adaptive mechanisms. Bollinger Bands use standard deviation to adapt to changing market conditions". Each one's definition and defaults, from its own sources (all read 29 October 2026):
| Donchian channel | Bollinger Bands | Keltner Channels | |
|---|---|---|---|
| Middle line | "(20 Day High + 20 Day Low)/2" (TradingView) | "20 Day Simple Moving Average" (TradingView) | "20-day exponential moving average" (StockCharts) |
| Upper and lower lines | "20 Day High" and "20 Day Low" (TradingView) | the average "+ (Standard Deviation x 2)" and "- (Standard Deviation x 2)" (TradingView) | "20-day EMA + (2 x ATR(10))" and "20-day EMA - (2 x ATR(10))" (StockCharts) |
| What sets the width | The highest high and lowest low of the window | Standard deviation: "We use the population calculation for standard deviation" (Bollinger) | Average true range |
| Defaults | Length: "20 is the Default" (TradingView); "a 20-period Price Channel, which is the default setting in SharpCharts" (StockCharts) | "20 periods for the moving average with the bands set at plus and minus two standard deviations" (Bollinger) | "(20,2.0,10)": the EMA's periods, the ATR multiplier and the ATR's periods (StockCharts). TradingView's help gives only Length, "20 is the default" |
| Created by | Richard Donchian (TradingView, StockCharts) | John Bollinger, "in the early 1980's" (TradingView) | Chester Keltner's "Ten-Day Moving Average Trading Rule" of 1960; Linda Bradford Raschke "introduced the newer version of Keltner Channels in the 1980s" (StockCharts) |
The formulas explain how differently they move. A Donchian line only moves when a new high or low enters the window or an old one drops out, so it runs flat for stretches and then steps. Bollinger and Keltner lines are an average plus a volatility distance, so they shift on every candle. On Keltner against Bollinger, StockCharts says "Keltner Channels are smoother than Bollinger Bands because the width of the Bollinger Bands is based on the standard deviation, which is more volatile than the Average True Range (ATR)." On closes outside his bands, Bollinger's rule 8 says they "are initially continuation signals, not reversal signals".
Which is better? None of these sources ranks one above another, and they measure different things: the range's extremes, the spread of closes around an average, and the average true range.
Donchian channel settings: what the length changes
The entry length. A shorter channel sits closer to the price, so it breaks more often and sooner. Every close above a 55-candle high is also above the 20-candle high, but not the other way round. A longer channel breaks less often and only after a bigger move, so its entries come later.
The exit length. A shorter exit channel sits closer under the price: it gives back less of a run but ends trades in shallower pullbacks. A longer one sits through deeper pullbacks and gives back more when the trend ends. The drill shows the trade-off at its sharpest. For its first 10 candles a 10-candle exit is still anchored below the entry.
The pairs the Turtles used. 20 in and 10 out for System 1, 55 in and 20 out for System 2, each exit shorter than its entry. Why 20 in the first place? The MQL5 Code Base's Donchian page says: "Richard Donchian himself recommended to use period 20 to build the Channel. In those days trading was usually conducted on day charts and 20 is exactly an average number of days in a month."
The time frame. The length counts candles, so 20 candles are 20 days on a daily chart, the Turtles' time frame, and 80 hours on a 4-hour chart.
No source we read names a best length for every market, and this post makes no claim that one length earns more than another. Pick the pair, write it down, and test it on your own market before you trade it.
Donchian channel strategy intraday: the same formula, different costs
The formula doesn't know the time frame. The length counts candles, so on a 5-minute chart the 20-candle high is the high of the last 100 minutes. The close above it, the 2 × ATR stop and the 10-candle exit are worked out exactly as in the drill above. What changes on short candles is what each trade costs and how often the rule trades:
- Costs against a smaller stop. The 2 × ATR stop shrinks with the candles; a spread, a commission or an exchange fee doesn't. So the same cost takes a bigger share of 1R. Our two crypto breakout tests show the size of it. At 4 hours, after a 0.05% fee per side, one tick of stop slippage and funding, "a stop-out averaged −1.05R, not −1R." On 5-minute Bitcoin and Ether candles, in our opening range test, "The fees and the funding took about 0.11R to 0.24R a trade on average (0.19R to 0.24R on Bitcoin), and the rule never made that much before them."
- Noise. A short window is broken more often, so the rule trades more often, and each trade pays the cost again.
Donchian channel settings for scalping. No source we read names a best length for scalping, and we haven't tested one. Before you try one, divide a round trip's cost by the stop's distance: that is the share of 1R every trade gives up before it starts.
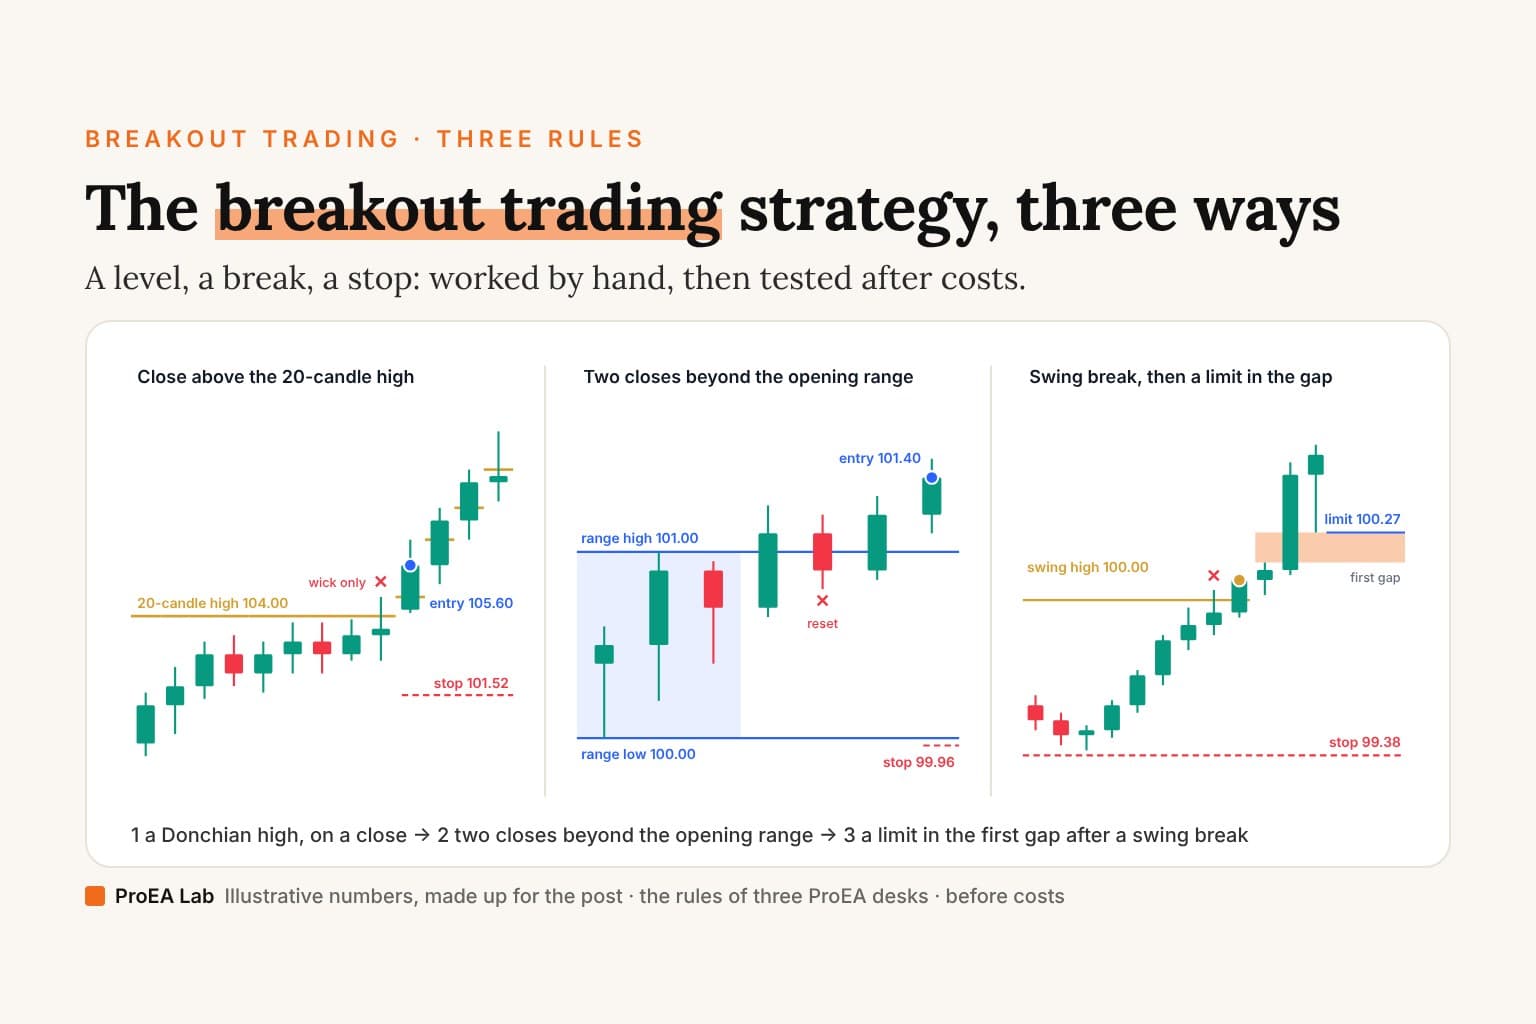
What our intraday test found. We haven't tested a Donchian rule on intraday candles. The intraday breakout rules we did test lost money. Of Breakaway Desk's swing break into the first gap, on 1–5 minute candles, its page says: "The author's registered validation on MGC and MNQ lost money after costs: core validation MGC −USD295 over 8 trades and MNQ −USD144 over 9, on two observed days." Of Opening Range Desk's opening range breakout, our study says: "After costs, nothing we ran passed the plan's rule, and the default lost money on every market."
What the 4-hour Radar is. The rule we tested runs at 4 hours, not intraday. Breakaway Desk Premium's Trend Radar is a 4-hour, long-only 20/10 Donchian rule on six crypto perpetuals. It draws on the chart you open and keeps all six in its table. It places no orders. For three breakout rules side by side, the intraday ones included, see breakout trading strategy.
Donchian channel on TradingView
TradingView has the indicator built in as Donchian Channels (DC). To add a built-in, TradingView's help says: "Click the Indicators button in the top toolbar, start typing the name of the indicator and then click on the indicator on the right hand side of the dialog to enable it" (read 18 October 2026; our walkthrough of TradingView indicators has the steps). Type "Donchian" and click Donchian Channels (DC).
Its inputs, from TradingView's help page for it:
- Length: "The time period to be used in calculating the Donchian Channels (20 is the Default)."
- Offset: "0 is the default."
The built-in draws the three lines. The entry on a close, the 2 × ATR stop and the 10-candle exit are left to you or to a script.
A free script that draws them is ours, Donchian Breakout 20/10 in R [ProEA]: the 20/10 breakout, the 2 × ATR stop and each trade's R on one market, decided on closed candles, with no alerts and no costs taken off. Copy the Pine code from this text file. For the open-source Donchian and Turtle scripts read line by line, which bar each band counts, and which one is the best free choice, see the best Donchian channel indicator for TradingView.
Donchian channel on MT5
MetaTrader 5's help lists its built-in indicators (read 29 October 2026): "38 indicators are available in the platform." Its four groups are trend indicators, oscillators, volume indicators and Bill Williams' indicators, and none of them includes a Donchian channel. The help points to the Code Base for the rest: "You can download source codes of various free applications from the Code Base."
The MQL5 Code Base has a free "Donchian Channels" indicator for MetaTrader 5 by Nikolay Kositsin, code 402, published 5 August 2011. It describes it as "a volatility indicator based on the calculation of the current price range with the help of the recent highest and lowest prices", and notes that "The Channel center line is also added in this version of the indicator". MetaQuotes' own "Price Channel", code 44, draws the same two outer lines: "its upper and lower boundaries are determined by maximal and minimal prices for a certain period." An MQL5 article from October 2024 says MT5 also lists a Donchian under the Navigator's Free Indicators; we haven't checked that in a terminal.
What we measured
We tested this post's rule, long only, on six crypto perpetuals at 4 hours: a close above the 20-candle high, a 2 × ATR(20) stop and a close below the 10-candle low. The test was pre-registered, with the rule, the costs and the pass mark written down before the one final run. It is a hypothetical backtest after estimated costs, not a forecast. The search that picked the rule, the years that tested it and what the final test found are in does Turtle trading still work?, where each figure is printed beside its sample and its deepest fall.
Breakaway Desk Premium is the six-market version of the rule. Its Trend Radar draws the entries, the 2 × ATR stops and the 10-candle exits on the 4-hour chart of whichever of the six markets you open, keeps all six in its table, and sends one alert for all six, and the download includes the lab that reproduces the test. It never places orders. The alert needs a paid TradingView plan: TradingView's pricing page (read 29 October 2026) gives "Active technical alerts on indicators, strategies, and drawings" as ✗ on Basic and 20 on Essential.
Sources
- TradingView Help Center: Donchian Channels (DC), Bollinger Bands (BB) and Keltner Channels (KC), read 29 October 2026; adding an indicator, read 18 October 2026.
- StockCharts ChartSchool: Price Channels, Average True Range, Bollinger Bands and Keltner Channels, read 29 October 2026.
- John Bollinger: Bollinger Bands and Bollinger Band Rules, read 29 October 2026.
- The Original Turtle Trading Rules (PDF), the Original Turtles site's rules page and story page, read 29 October 2026.
- Wikipedia, Richard Dennis, and Eckhardt Trading Company's leadership page, read 29 October 2026.
- The intraday results: Breakaway Desk's page in Pine Pro Library (its validation answer) and Opening Range Desk: what we measured; the 4-hour costs: does Turtle trading still work?.
- MetaTrader 5 help: indicators and its four group pages; MQL5 Code Base: Donchian Channels and Price Channel, read 29 October 2026. The Free Indicators note is from the MQL5 article Building A Candlestick Trend Constraint Model (Part 9).
- The worked example:
src/components/blog/donchian-strategy/donchian-example.ts, checked against the Trend Radar engine's rule on the same candles.
Disclosure
We, ProEA Lab, build Breakaway Desk Premium and sell it in the Premium Vault. The code is AI-assisted. The 30 candles are made up to show the arithmetic; they are not a market and not a result. Nothing here is a forecast. Trading involves risk.
Frequently asked questions
What is the Donchian channel?
Three lines drawn over the last N candles: the highest high on top, the lowest low underneath and the average of the two in the middle. It is Richard Donchian's indicator, and TradingView's built-in version defaults to a length of 20.
How does the Donchian channel breakout strategy work?
A close above the 20-candle high enters long, a stop goes 2 × ATR below the entry, and a close below the 10-candle low exits, with no profit target. Shorts mirror it. Those are the Turtle traders' System 1 lengths, though the Turtles entered during the day instead of waiting for the close.
What are the best Donchian channel settings?
None of the sources we read names a best one. 20 is the default on TradingView and StockCharts. The original Turtle rules used 20 in and 10 out for System 1, and 55 in and 20 out for System 2. A shorter channel signals more often and earlier, a longer one less often and later.
Donchian channel vs Bollinger Bands: what's the difference?
A Donchian channel is the highest high and the lowest low of N candles. Bollinger Bands are a 20-period simple moving average with lines 2 standard deviations above and below it, and Keltner Channels are an exponential moving average with lines a multiple of ATR away. They measure different things, and none of their sources ranks one above the others.
What are the Turtle trading rules?
The rules Richard Dennis and William Eckhardt taught the traders they trained from the end of December 1983: two Donchian breakout systems. System 1 entered on a 20-day breakout and exited on a 10-day breakout the other way; System 2 entered on a 55-day breakout and exited on a 20-day one. Units were sized so that one N, a 20-day average true range, was 1% of the account, stops sat 2 N from the entry, and units were added every half N.
Can you use a Donchian channel strategy intraday or for scalping?
The formula works on any chart, because its length counts candles: on a 5-minute chart the 20-candle high covers 100 minutes. What changes is the cost: the 2 × ATR stop shrinks with the candles while spreads and fees don't, so each trade's cost is a bigger share of 1R. We haven't tested a Donchian rule intraday, and the intraday breakout rules we did test lost money after costs.
Is there a Donchian channel indicator on MT5?
Not among MetaTrader 5's 38 built-in indicators, according to its help. The MQL5 Code Base has a free Donchian Channels indicator for MT5 (code 402, published in 2011), and MetaQuotes' own Price Channel (code 44) draws the same high and low lines.
How do I add the Donchian channel on TradingView?
Click Indicators on the chart's top toolbar, type Donchian and click Donchian Channels (DC) in the results. Its inputs are Length, 20 by default, and Offset, 0 by default.