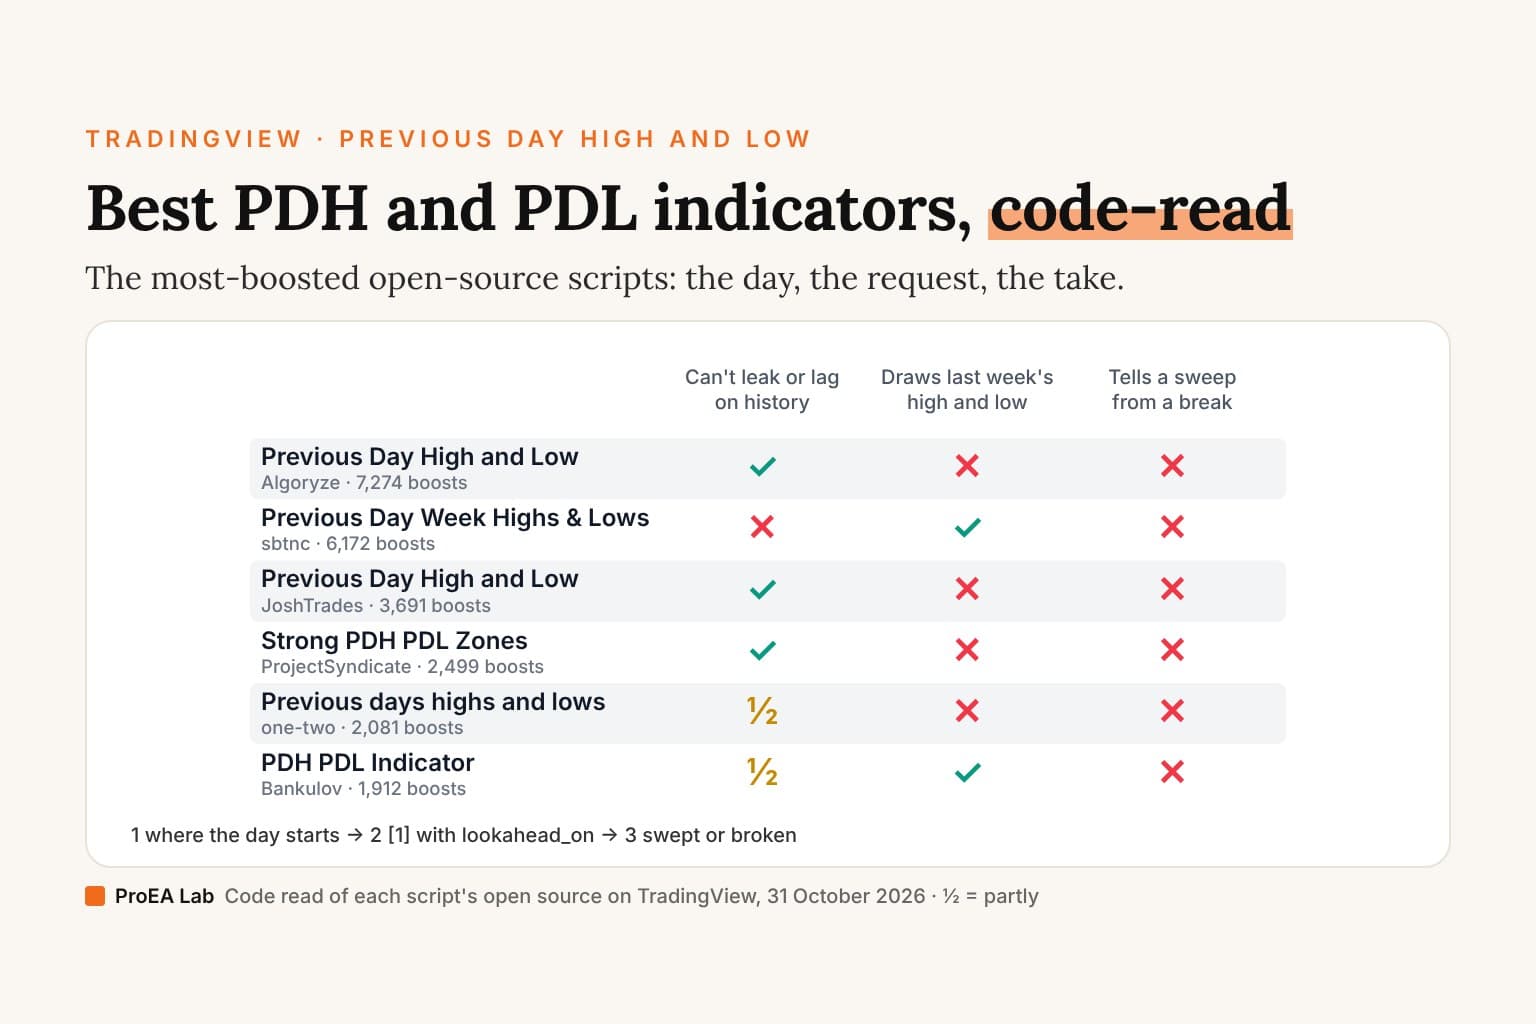
Short answer: the most-boosted previous day high low script on TradingView, Previous Day High and Low + Separators Daily/Weekly by Algoryze (7,274 boosts), builds the previous day from your chart's own candles, so its lines don't move on a reload; its day turns at midnight on the exchange's clock, which on CME futures is Chicago's, and it has no alerts. For the previous day and week in one, labelled, PDH/PDL + PWH/PWL + ICT Bias Filter by Aurelius1027 (672 boosts) builds both the same safe way, on TradingView's daily and weekly candles. Before you trust any of them, check where its day starts and how it asks for it: the second most boosted, sbtnc's (6,172), asks with lookahead and no [1]. None of the 15 tells a sweep of the level from a break.
Most lists name previous day high low indicators.
This one reads them.
What we checked
The previous day's high and low (PDH and PDL) are the highest and lowest prices of the last completed day. Simple, until you ask which day. A script can take TradingView's daily candle, midnight on some clock, or a session it's told, and on a market that trades through the night those are different days with different highs.
We searched TradingView's scripts for five terms on 31 October 2026 ("previous day high low", "previous day high", "pdh pdl", "daily high low" and "prev day high low") and kept the titles with "previous day", "PDH", "daily high" or "prev day" in them. That returned 98 scripts: 77 open source, 20 protected (free to add, with the code hidden) and 1 invite-only. We read the 15 most-boosted open-source scripts that draw the previous day's high and low: every line that decides the level, draws it, or signals on it. Two more boosted ones draw the current day instead, Daily High/Low/Mid/Open/Close by LARIANE (1,346 boosts) and Dynamic Customizable 50% Line & Daily High/Low + True Day Open by VentureTrading_ (1,017), so they aren't in the table.
The questions:
- The day: TradingView's daily candle, midnight on a clock, or a session?
- The request: if it asks for the daily candle with
request.security(), does it use[1]withlookahead_on, the form TradingView's Pine manual gives, or does it leak or lag? - The week and month: does it also draw last week's (PWH, PWL) and last month's (PMH, PML) high and low?
- Taken: does it mark the level when price takes it, and does it tell a sweep (a wick through and a close back) from a break (a close beyond)?
- Lines, labels and alerts, and the licence line.
Boosts as TradingView's search showed them on 31 October 2026. "The manual's form" in the table means request.security(syminfo.tickerid, "D", high[1], lookahead = barmerge.lookahead_on); "chart candles" means the script tracks the day's high and low itself and keeps them when the day ends.
The table
| Script | Boosts | The day | The request | Week, month | Taken? | Lines and labels | Alerts | Licence |
|---|---|---|---|---|---|---|---|---|
| Previous Day High and Low + Separators Daily/Weekly (Algoryze) | 7,274 | Midnight on the exchange's clock, moved by an hours setting (0) | Chart candles | Week separators only | No | One pair, from the candle that made each level to the last candle; "HOD" and "LOD" | None | MPL 2.0 |
| Previous Day Week Highs & Lows (sbtnc) | 6,172 | TradingView's daily candle | Lookahead on, no [1]: a day that begins on a live chart keeps its first candle's high and low until a reload | Week and month | No | Each day's line across its own day; 20 candles past the last with Show Projections (off) | None of its own | MPL 2.0 |
| Previous Day High and Low (JoshTrades) | 3,691 | TradingView's daily candle | Pine version 1 with [1]: the manual's form in effect | No | No | Two plotted lines | None | None |
| Strong PDH PDL Zones (ProjectSyndicate) | 2,499 | TradingView's daily candle | Chart candles | No | No: fixed "SWEEP TRAP" and "PRICE BREAKOUT" lines beyond each level | Zones across each day, 10 days kept; "PREVIOUS DAY HIGH" with a 0–10 score | 5, on a touch | None |
| Previous days highs and lows (one-two) | 2,081 | TradingView's daily candle | Lookahead on, no [1], but its lines take the value one candle back as the day starts: right. Its dots (off) look ahead | No | No | One pair, to a day past the last candle | None | None |
| PDH PDL Indicator (Bankulov) | 1,912 | TradingView's daily candle | [1] with lookahead off: right live, a day late on history, where it doesn't draw | Week | No | On the last candle only, 2 candles long; "PDH", "PDL", "PWH", "PWL" | None | None |
| CPR by Anand with PDL/PDH & Breakouts 15/30 mins (AnandVel) | 1,907 | TradingView's daily candle | The manual's form | Last week's, across last week | No | Plotted lines for the last 7 days, with the CPR | None | None |
| Daily Bias Engine (marketxmacre) | 1,641 | Levels: TradingView's daily candle. Lines: redrawn at midnight on the exchange's clock | The manual's form | No | "BUY" or "SELL" in a corner, on the live candle's price | 500 candles right, with the midpoint | None | None |
| Previous Day and Current Day High/Low (avithekkc) | 1,425 | The regular session | Chart candles | No | No | From the previous day's first candle to 5 candles past the last; "PDH", "PDL", "PDC" | None | None |
| Previous Day, Week, Month High/Low Line Indicator (The-Hunter) | 1,028 | TradingView's daily candle | The manual's form, on the symbol without its exchange. Its current day, week and month lines (on) look ahead | Week and month | No | Plotted lines, unlabelled | None | None |
| Previous Day High and Low Breakout Strategy (ceyhun) | 965 | TradingView's daily candle | [1] with lookahead off: a day late on history, so its backtest trades the high from two days back | No | Enters on any trade through (a wick counts), decided at the candle's close as a strategy runs by default, filled at the next open | Two plotted lines | None; its Bar Color twin has 2 | MPL 2.0 |
| Previous Days High & Low (Electrified) | 811 | TradingView's daily candle | Chart candles | No | Alerts only, on a trade through | Dots across each day; dotted lines at today's high and low so far | 4 | MPL 2.0 |
| PDH/PDL Liquidity Reversal - 15M Confirmed Close (BoomerNuc7987) | 750 | A session you set: 09:30 to 16:00 New York | Chart candles | No | A close back inside after a close beyond, on a closed candle, 09:30 to 12:00 New York | Three plotted lines | 2, for its A+ signals | MPL 2.0 |
| PDH/PDL + PWH/PWL + ICT Bias Filter (Aurelius1027) | 672 | TradingView's daily candle | Chart candles | Week | No; its bias panel reads yesterday's sweep of the day before | From the candle that made each level, extended right; "PDH", "PDL", "PWH", "PWL" | None | None |
| Daily High/Low probability zones (lucymatos) | 635 | TradingView's daily candle | Daily candles read on the last candle only | No | No | Today only; labels to two decimals | None | MPL 2.0 |
| ICT Levels Desk (ours) | — | TradingView's daily candle | The manual's form | Week (on), month (off) | Yes: swept on a wick through and a close back, broken on a close beyond, on closed candles | From the day's first candle, extended right; a broken line ends at the break; "PDH · swept" | PDH, PDL, PWH and PWL sweeps; near a level | Sold, with its source; the file keeps its first-release MIT line |
The other 20 with closed code are protected: free to add, with the code hidden. The most boosted is Previous Day/Week High & Low + 50% w/ Alerts by IamtheOctopuS (506 boosts), and a PDH/PDL Screener by Gmail_nitin (390) is among them; we can't say what their code does. One, Previous Day High Low [NLB] (153), is invite-only.
What the code says
Most of them take TradingView's daily candle, and that isn't a calendar day. Twelve of the 15 take it as their day, through request.security() on "D" or time("D"), and that candle follows the symbol's session. TradingView's symbol data, read on 31 October 2026, gives FX:EURUSD a 17:00 to 17:00 New York session, CME_MINI:ES1! 17:00 to 16:00 Chicago time (18:00 to 17:00 in New York) and BINANCE:BTCUSDT a round-the-clock session on UTC. So on ES, these scripts' previous day high includes the evening that opened at 18:00 New York the day before. avithekkc's reads the regular session, BoomerNuc7987's a session you set (09:30 to 16:00 New York by default), and Algoryze's a midnight.
Algoryze's midnight is the exchange's. It finds a new day with dayofweek(time + utcOffsetInMs), and the Pine manual says calendar values are "expressed in the exchange time zone" and "all time function overloads that have a timezone parameter use this time zone by default". TradingView lists FX:EURUSD and OANDA:XAUUSD in New York's time zone, so there its day turns at midnight New York; it lists CME_MINI:ES1! in Chicago's, so on ES its day turns at 01:00 New York. Its "UTC Offset" setting moves that by whole hours from the exchange's clock, not from UTC. Its lines are labelled "HOD" and "LOD", though they're the previous day's.
marketxmacre's lines and levels can be different days. Its levels come from the daily candle in the manual's form, but it redraws its lines when dayofweek(time) changes, at midnight on the exchange's clock. On FX, between 17:00 and midnight New York, the line on your chart is a day older than the level its "BUY" and "SELL" read, and those read the live candle's price, not a closed candle.
Two safe ways to get the day, and two that aren't. Six build the day from chart candles, which can't look ahead: Algoryze's, ProjectSyndicate's, avithekkc's, Electrified's, BoomerNuc7987's and Aurelius1027's. Four ask in the manual's form: AnandVel's, marketxmacre's, The-Hunter's and, in effect, JoshTrades'. lucymatos' reads the daily candles once, on the last candle, and takes the one before today's, which has closed. JoshTrades' has no //@version line, so it's Pine version 1, whose security() the manual says "behaved the same as those with lookahead = barmerge.lookahead_on"; it adds the [1], and the manual's warning on version 1 and 2 scripts exempts exactly that: "unless those calls offset the requested series with the [] operator." The rest:
- Lookahead on without
[1]. sbtnc's asks for the day that way. The manual: "When request.security() is used with lookahead = barmerge.lookahead_on to fetch prices without offsetting the series by [1], it will return data from the future on historical bars, which is dangerously misleading." Its lines sit across their own day, so on history yesterday's line is yesterday's real high, but a day that begins on a live chart keeps its first candle's high and low until you reload. The-Hunter's current day, week and month lines, on by default, are asked for the same way. one-two's asks that way too, but its lines take the value one candle back as each day starts, which is yesterday's final high; only its optional dots, off by default, show the day's final high from its second candle. [1]with lookahead off. The manual: "The series requested using barmerge.lookahead_off has a new historical value at the end of each HTF period". With[1], history gets yesterday's high only on the day's last candle; through the rest of each day it shows the high from two days back. Live, it's right. Bankulov's draws on the last candle only, so you never see the lag. ceyhun's strategy plots it and trades it, so its Strategy Tester results come from a different level from the one it trades live.
None of the 15 tells a sweep from a break on the level. ProjectSyndicate's draws "SWEEP TRAP LEVEL" lines 0.10 times its average daily range beyond each level and "PRICE BREAKOUT LEVEL" lines 0.35 times beyond: fixed in advance, with nothing to say what price did there. ceyhun's strategy enters on any trade through, Electrified's alerts fire on one, and ProjectSyndicate's on a touch of its zones. BoomerNuc7987's is the only one with a close back: a closed candle that closes back above PDL (below PDH) after one that closed at or beyond it, between 09:30 and 12:00 New York. A wick through that closes back on the same candle doesn't count there. Aurelius1027's bias panel reads a sweep a day late: yesterday's high above the day before's with a close back inside. Below the 15, Liquidity Sweep Detector - PDH/PDL Levels by backtestbay (514 boosts) calls any trade above PDH a sweep and dashes the line.
Small things worth knowing. Of the 15, only avithekkc's draws the previous day's close (PDC); just below them, Initial Balance (IB) and Previous Day / Week High, Low & Close by Bartjs (552 boosts) plots the previous day's high, low and close from the regular session in the manual's form, with last week's high and low. lucymatos' labels print two decimals, so on EURUSD a level of 1.08734 reads 1.09. The-Hunter's asks for syminfo.ticker, the symbol without its exchange, and the manual says that without an exchange prefix "the function selects the exchange automatically", so its levels may come from another feed than your chart's. avithekkc's PMH and PML are the premarket high and low, not last month's. ProjectSyndicate's scores each level 0 to 10 from the previous day's volume, range, close and distance from a round number and from recent days' levels; we didn't test the scores. AnandVel's draws the levels with a central pivot range (CPR); on NSE:NIFTY its day is TradingView's regular session from 09:15, India time (09:15 to 15:15 since 3 August 2026, 15:30 before). BoomerNuc7987's title says 15M, but it reads your chart's candles, whatever their timeframe. Daily High/Low by aVAvzFR (535 boosts) names its plots "Previous Daily High" and "Previous Daily Low", but they're the current day's.
Where does the day start?
On a chart of a US stock's regular hours, midnight, the exchange's midnight and TradingView's daily candle all give the same day: the session. On a market that trades through the night they don't. Pick a start below: the made-up candles stay put; the previous day's high and low move, and so does what the morning did to them.
18:00 New York: PDH 101.20, swept at 10:00; PDL 100.20, swept at 00:00.
The previous day runs Mon 18:00 to Tue 17:00, so Monday evening's 101.20 is its high. This is the day the scripts that ask TradingView for its daily candle draw on these markets, and ICT Levels Desk with them. PDH 101.20 (Mon 20:00): the Wed 10:00 candle wicked to 101.26 and closed back at 101.14: swept. PDL 100.20 (Tue 03:00): the Wed 00:00 candle wicked to 100.10 and closed back at 100.30: swept.
Illustrative candles, made up for this explainer (simulated): not a market and not a result. The made-up market pauses from 17:00 to 18:00 New York, as CME index futures do. Swept and broken follow ICT Levels Desk's rule, applied to each window: the first candle whose wick goes through a level sweeps it if it closes back and breaks it if it closes beyond, and a later close beyond breaks a swept level. TradingView's symbol data, read on 31 October 2026, gives CME_MINI:ES1! a 17:00 to 16:00 Chicago session (18:00 to 17:00 New York) and FX:EURUSD 17:00 to 17:00 New York; on this chart a 17:00 start draws the same lines as 18:00, since nothing trades in between.
Read as text: the 40 candles, with the day starting at 18:00 New York
| New York | Day | Open | High | Low | Close | Marks |
|---|---|---|---|---|---|---|
| Mon 18:00 | previous | 100.55 | 100.70 | 100.50 | 100.66 | |
| Mon 19:00 | previous | 100.66 | 100.98 | 100.62 | 100.94 | |
| Mon 20:00 | previous | 100.94 | 101.20 | 100.88 | 101.02 | previous day's high |
| Mon 21:00 | previous | 101.02 | 101.06 | 100.84 | 100.88 | |
| Mon 22:00 | previous | 100.88 | 100.92 | 100.74 | 100.78 | |
| Mon 23:00 | previous | 100.78 | 100.84 | 100.70 | 100.76 | |
| Tue 00:00 | previous | 100.76 | 100.82 | 100.62 | 100.66 | |
| Tue 01:00 | previous | 100.66 | 100.70 | 100.48 | 100.52 | |
| Tue 02:00 | previous | 100.52 | 100.58 | 100.30 | 100.36 | |
| Tue 03:00 | previous | 100.36 | 100.44 | 100.20 | 100.40 | previous day's low |
| Tue 04:00 | previous | 100.40 | 100.56 | 100.36 | 100.52 | |
| Tue 05:00 | previous | 100.52 | 100.60 | 100.44 | 100.48 | |
| Tue 06:00 | previous | 100.48 | 100.62 | 100.46 | 100.58 | |
| Tue 07:00 | previous | 100.58 | 100.70 | 100.54 | 100.66 | |
| Tue 08:00 | previous | 100.66 | 100.84 | 100.62 | 100.80 | |
| Tue 09:00 | previous | 100.80 | 100.92 | 100.72 | 100.88 | |
| Tue 10:00 | previous | 100.88 | 100.98 | 100.80 | 100.84 | |
| Tue 11:00 | previous | 100.84 | 100.88 | 100.68 | 100.72 | |
| Tue 12:00 | previous | 100.72 | 100.78 | 100.62 | 100.66 | |
| Tue 13:00 | previous | 100.66 | 100.74 | 100.58 | 100.70 | |
| Tue 14:00 | previous | 100.70 | 100.80 | 100.64 | 100.76 | |
| Tue 15:00 | previous | 100.76 | 100.82 | 100.66 | 100.70 | |
| Tue 16:00 | previous | 100.70 | 100.74 | 100.60 | 100.64 | |
| Tue 18:00 | today | 100.62 | 100.70 | 100.52 | 100.56 | |
| Tue 19:00 | today | 100.56 | 100.64 | 100.44 | 100.48 | |
| Tue 20:00 | today | 100.48 | 100.56 | 100.38 | 100.42 | |
| Tue 21:00 | today | 100.42 | 100.50 | 100.32 | 100.46 | |
| Tue 22:00 | today | 100.46 | 100.52 | 100.36 | 100.40 | |
| Tue 23:00 | today | 100.40 | 100.46 | 100.28 | 100.32 | |
| Wed 00:00 | today | 100.32 | 100.38 | 100.10 | 100.30 | PDL swept |
| Wed 01:00 | today | 100.30 | 100.44 | 100.24 | 100.40 | |
| Wed 02:00 | today | 100.40 | 100.58 | 100.36 | 100.54 | |
| Wed 03:00 | today | 100.54 | 100.66 | 100.48 | 100.62 | |
| Wed 04:00 | today | 100.62 | 100.70 | 100.56 | 100.66 | |
| Wed 05:00 | today | 100.66 | 100.76 | 100.60 | 100.72 | |
| Wed 06:00 | today | 100.72 | 100.82 | 100.68 | 100.78 | |
| Wed 07:00 | today | 100.78 | 100.90 | 100.74 | 100.86 | |
| Wed 08:00 | today | 100.86 | 101.03 | 100.82 | 100.94 | |
| Wed 09:00 | today | 100.94 | 101.16 | 100.90 | 101.12 | |
| Wed 10:00 | today | 101.12 | 101.26 | 101.04 | 101.14 | PDH swept |
Under 18:00 New York, the day most of these scripts and our desk draw on ES, the 10:00 candle swept the previous day's high. Under midnight New York, that same morning broke a lower high an hour earlier, after sweeping it at 08:00. Neither is wrong: they're different days. Pick the one your trading means, then check that the script you add uses it.
Ours
ICT Levels Desk isn't on TradingView's search: its full Pine v6 source comes in Pine Pro Library, $49 once for every desk and every update. It draws more than the previous day: opening gaps, the midnight, 08:30 and 09:30 opens, the first fair value gap after the open, session boxes and macro windows. For the previous day, its source says:
- The day:
request.security(syminfo.tickerid, "D", [high[1], low[1]], lookahead = barmerge.lookahead_on), the manual's form, so its PDH and PDL are TradingView's daily candle: the 18:00 New York day on ES in the drill, not midnight. Its midnight open, at 00:00 on its Timezone setting (New York by default), is a separate line. If you want a previous day that starts at midnight, it doesn't draw one. - The week and month: PWH and PWL from the weekly candle, on by default; PMH and PML from the monthly, off by default; and the previous 4-hour high and low, off by default.
- Taken: a level rests until a candle's wick goes through it. If that candle closes back, the level is swept and stays, marked ⚡; if it closes beyond, the level is broken, and its line ends at that candle, faded. A swept level that later gets a close beyond is broken. Each level is born when the day's first candle closes, and every state is decided on a closed candle.
- Lines and labels: from the day's first candle, extended right, labelled "PDH", "PDL", "PWH" and "PWL", with "· swept" or "· broken" once taken. The last 3 days' PDH and PDL stay on the chart, the older ones tagged "−1d" and "−2d". By default it draws only the levels within 2 times the daily ATR of price, and its panel lists the nearest above and below and how many are hidden.
- Alerts: "PDH swept", "PDL swept", "PWH swept" and "PWL swept", the same sweeps as one alert() message once per bar close (JSON by default), and "Price near a level" within 0.15 times the daily ATR. There's no alert for a break, and none for PMH or PML.
- A count: its panel shows how often PDH and PDL were taken, swept or broken, on the loaded chart, under the heading "BASE RATES ON THIS CHART · DESCRIPTIVE, NOT PREDICTIVE". It counts days at midnight on its Timezone setting while the levels roll with the daily candle, so on futures and FX the two don't line up exactly: read it as a rough count of that chart's past.
It draws no previous day's close. We haven't tested it, or any script here, for results.
Previous candle or previous day?
If you want the last hour's or the last candle's high and low, our best previous candle high low indicators, code-read reads 24 scripts for those, gives the Pine Script for any timeframe (set it to D for the previous day, in the same safe form) and plays the lookahead mistakes on a film. Its desk is Range Verdict Desk, which reads every 15-minute close against the last UTC hour's range; the 1 hour candle strategy works its rule through. This page is the day: where it starts, the week and month around it, and swept or broken.
Check one yourself
- Find the day.
request.security(…, "D", …)ortime("D")is TradingView's daily candle.dayofweek(time),dayofmonth(time)orhour(time)with no time zone is the exchange's clock, Chicago's on CME futures. A time zone string, like ICT Levels Desk's "America/New_York", is that clock. - Find the request.
[1]andlookahead_ontogether read the last closed day; one without the other leaks or lags. No//@versionline at the top means Pine version 1, wheresecurity()looked ahead on its own. - Find the take. A sweep test reads like
high > level and close < levelon a closed candle.high > levelalone is a touch;close > levelis a break. - Watch a day roll. Leave a chart open across the daily candle's open, note the lines, then reload. If they moved, the script repaints. How to tell if an indicator repaints has the full check.
Alerts need a paid plan. TradingView's pricing page, read on 29 October 2026, shows no technical alerts on indicators on Basic, 20 on Essential, 100 on Plus, 400 on Premium and 1,000 on Ultimate. The same page ticks the Pine Screener, which runs an indicator over a watchlist or an index, for Premium and Ultimate only (our Pine Screener check). We haven't run these scripts in it, and we haven't checked Chartink.
Every script here, ours included, is Pine Script and runs only on TradingView: none runs on MT4, MT5, NinjaTrader 8 or thinkorswim. We haven't checked what those platforms, or Zerodha's and Groww's charts, offer on their own.
Sources
- Each script's Pine source, as TradingView served it on 31 October 2026, at its link in the table.
- TradingView's Pine manual, read on 31 October 2026: Other timeframes and data (lookahead, and Pine versions 1 and 2), Repainting and Time.
- TradingView's symbol data, read on 31 October 2026 from its scanner: CME_MINI:ES1!, FX:EURUSD, OANDA:XAUUSD, BINANCE:BTCUSDT and NSE:NIFTY.
- TradingView's pricing page, read on 29 October 2026.
- ICT Levels Desk: its Pine source,
ict-levels-desk.pine(v1.2.0), in Pine Pro Library.
Limits
One code read, on 31 October 2026, of the versions TradingView served that day. Scripts change, and boosts measure popularity, not quality. The drill runs made-up candles, not market data. We build and sell ICT Levels Desk, and we have no relationship with any author named here. Nothing here is financial advice.
Frequently asked questions
What is the best previous day high low indicator for TradingView?
Start with one that builds the day from your chart's own candles or asks for it in the safe form. The most boosted, Previous Day High and Low + Separators Daily/Weekly by Algoryze (7,274 boosts), builds it from chart candles, so its lines don't move on a reload, but its day turns at midnight on the exchange's clock, which on CME futures is Chicago's, and it has no alerts. For the previous day and week in one, labelled, PDH/PDL + PWH/PWL + ICT Bias Filter by Aurelius1027 (672 boosts) builds both the same way on TradingView's daily and weekly candles. None of the 15 tells a sweep of the level from a break.
Is there a free previous day high low indicator for TradingView?
Yes. All 15 TradingView scripts in our table (ours is the 16th row, sold) are open source and free to add: six are shared under the Mozilla Public License 2.0 and nine carry no licence line. Another 20 in TradingView's search are protected, free to add with the code hidden, so we couldn't read them.
Does a previous day high and low indicator repaint?
It depends on how it gets the day. Built from the chart's own candles, or asked for with request.security(), high[1] and lookahead on, the level is yesterday's high on every candle, live and after a reload. Lookahead on without [1], as in sbtnc's Previous Day Week Highs & Lows (6,172 boosts), lets a day that begins on a live chart keep its first candle's high and low until a reload. [1] with lookahead off, as in ceyhun's Previous Day High and Low Breakout Strategy (965 boosts), is right live but a day late on history.
Is there a previous day high, low and close indicator for TradingView?
Of the 15 we read, Previous Day and Current Day High/Low by avithekkc (1,425 boosts) draws the previous day's close (PDC) with its high and low, from the regular session. Just below them, Initial Balance (IB) and Previous Day / Week High, Low & Close by Bartjs (552 boosts) plots all three in the safe form, with last week's high and low. Our ICT Levels Desk draws no previous close line.
Is there a previous day high low indicator for MT4, MT5, NinjaTrader 8 or thinkorswim?
None of the scripts here: every one, ours included, is Pine Script, which runs only on TradingView. We haven't checked what MT4, MT5, NinjaTrader 8, thinkorswim, Zerodha or Groww offer on their own charts.
Can I scan for previous day high low breakouts?
On TradingView, the Pine Screener runs a Pine indicator over a watchlist or an index, and TradingView's pricing page, read on 29 October 2026, ticks it for Premium and Ultimate only. We haven't run these scripts in it, and we haven't checked Chartink.
Which previous day high low indicator does ProEA make?
ICT Levels Desk, in Pine Pro Library, $49 once with the full Pine v6 source of every desk. It asks TradingView for the last closed daily, weekly and monthly candles in the safe form, draws PDH, PDL, PWH and PWL (PMH and PML when switched on), and marks each level swept when the first candle through it closes back, or broken on a close beyond, decided on closed candles. It alerts on PDH, PDL, PWH and PWL sweeps. Its day is TradingView's daily candle, not midnight.