Short answer: a breakout trading strategy trades price as it moves beyond a level that held it, long above a high and short below a low, with a stop where the break would have failed. As a rule you can test, it names five things: the level, what counts as a break, the entry, the stop and the exit. Below are three common shapes, each worked by hand on illustrative numbers: a close above a Donchian channel, an opening range, and a swing break followed by a limit in the first fair value gap. Then what our tests of all three found after costs: one passed once, two lost money.
Each of the three is a rule one of our TradingView desks runs, so every number in its defaults is written down. Each section gives the rule, one example worked by hand, where its false breaks come from and how its stop is set.
What is a breakout trading strategy?
The original Turtle rules define the word in one line: "A breakout is defined as the price exceeding the high or low of a particular number of days. Thus a 20-day breakout would be defined as exceeding the high or low of the preceding 20 days."
A strategy turns that into five decisions:
- The level. Which high or low: the highest high of the last 20 candles, the first 15 minutes of the session, a swing on a higher time frame.
- The break. What counts: any trade beyond the level, a close beyond it, or two closes in a row.
- The entry. At the break, at the close that confirms it, or on a limit that waits for price to come back.
- The stop. Where the break has failed: a multiple of ATR, the other side of a range, the last swing the other way.
- The exit. A target in R, a trailing channel, or the end of the day.
A sixth thing decides the result without being part of the rule: what each trade costs, counted against the stop. A downside break, a breakdown, mirrors every rule here with highs and lows swapped.
Breakout rules: three shapes side by side
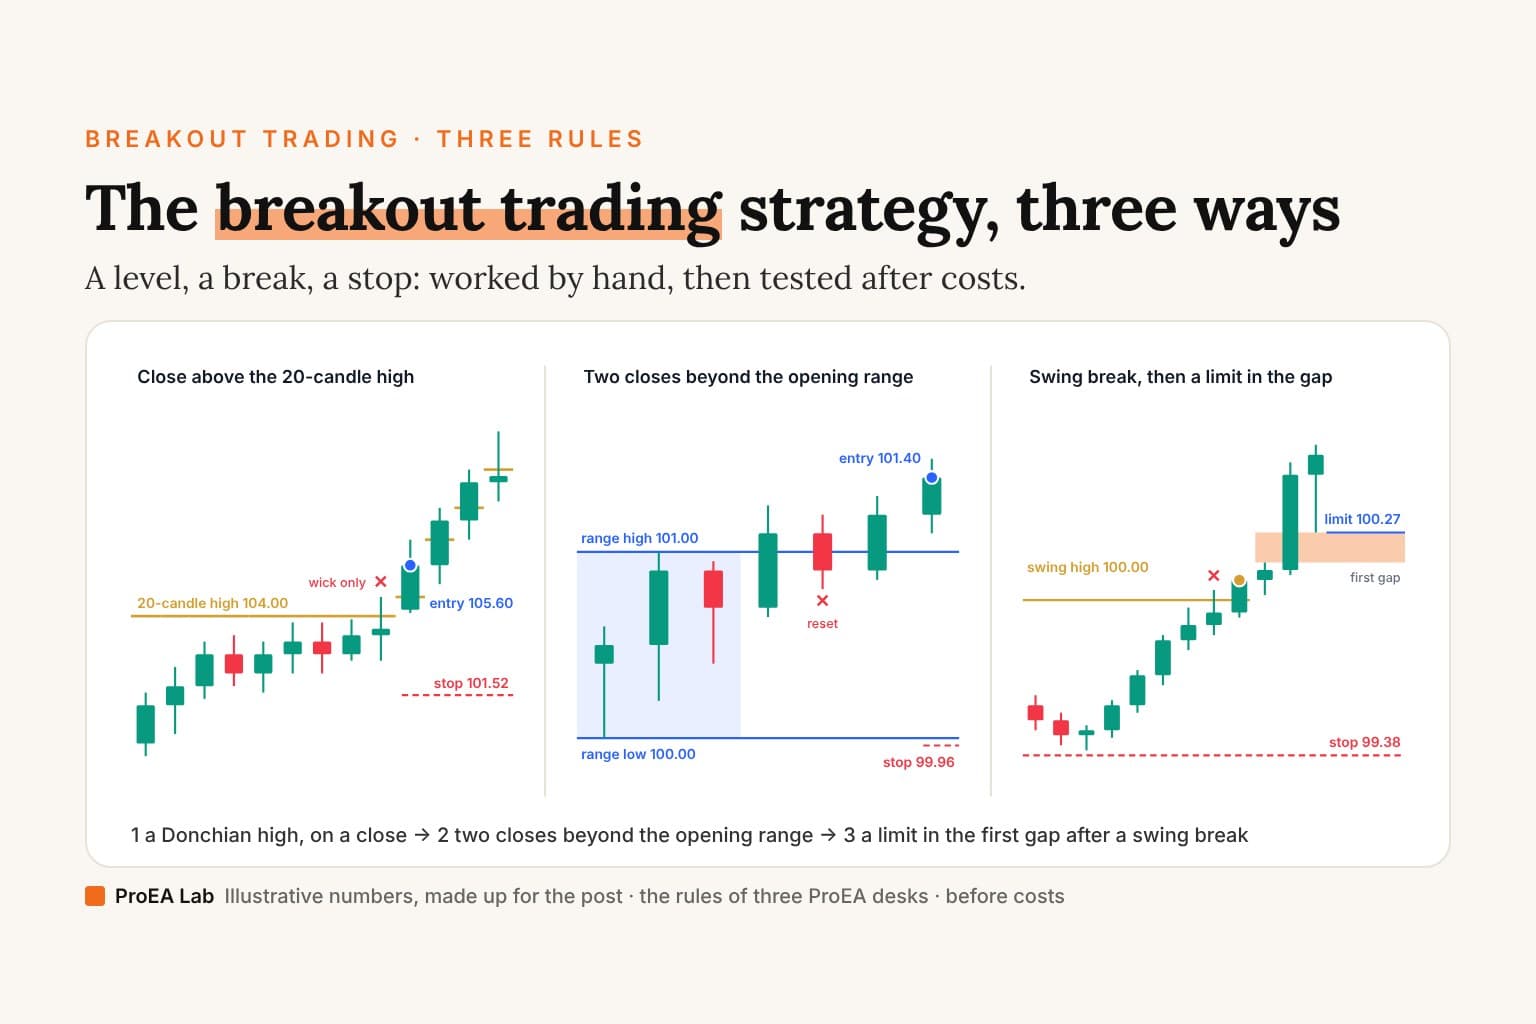
Each shape below is the default of one of our desks, as its own source or contract writes it:
| The Donchian close | The opening range | The swing break into the first gap | |
|---|---|---|---|
| The level | The highest high of the previous 20 candles | The high and low of 09:30–09:45 New York | The latest confirmed 15-minute swing high or low |
| The break | A close above it | Two closes in a row beyond it | A 1–5 minute candle's close beyond it |
| The entry | At that close | At the second close | A limit at the first gap's near edge, for 10 minutes |
| The stop | 2 × ATR(20) below the entry, set once | The other side of the range, plus 0.1 × ATR(14) | Beyond the latest opposite swing, plus 0.1 × ATR(14) |
| The exit | A close below the 10-candle low; no target | TP1 at 1R moves the stop to the entry; TP2 at 2R; the end of the window | A target at 1R |
| Our desk | Breakaway Desk Premium's Trend Radar | Opening Range Desk | Breakaway Desk |
| What our test found | Passed one pre-registered test | Lost money after costs | Lost money in validation |
A break that fails and closes back inside is a false breakout: the false breakout explainer works both readings of one, two closes beyond or a wick back inside, on 15-minute candles.
The 20-day breakout: a close above the Donchian channel
The rule
- The level. The upper line of a Donchian channel: the highest high of the previous 20 candles. StockCharts says of the same line: "The Price Channel formula doesn't include the most recent period." So the candle that breaks out isn't part of its own level.
- The break and the entry. A candle closes above that line: long at the close.
- The stop. 2 × ATR(20) below the entry, set once. The ATR is Wilder's average true range over 20 candles.
- The exit. No target. Out on a close below the lowest low of the previous 10 candles.
Shorts mirror it. The 20 and the 10 are the Turtle traders' System 1 lengths, and the 2 × ATR stop is their 2N stop; the Turtles bought during the day, the moment the high was exceeded, instead of waiting for the close. Our Donchian channel strategy explainer has the formula, the Turtle rules in their own words and a drill.
Worked by hand
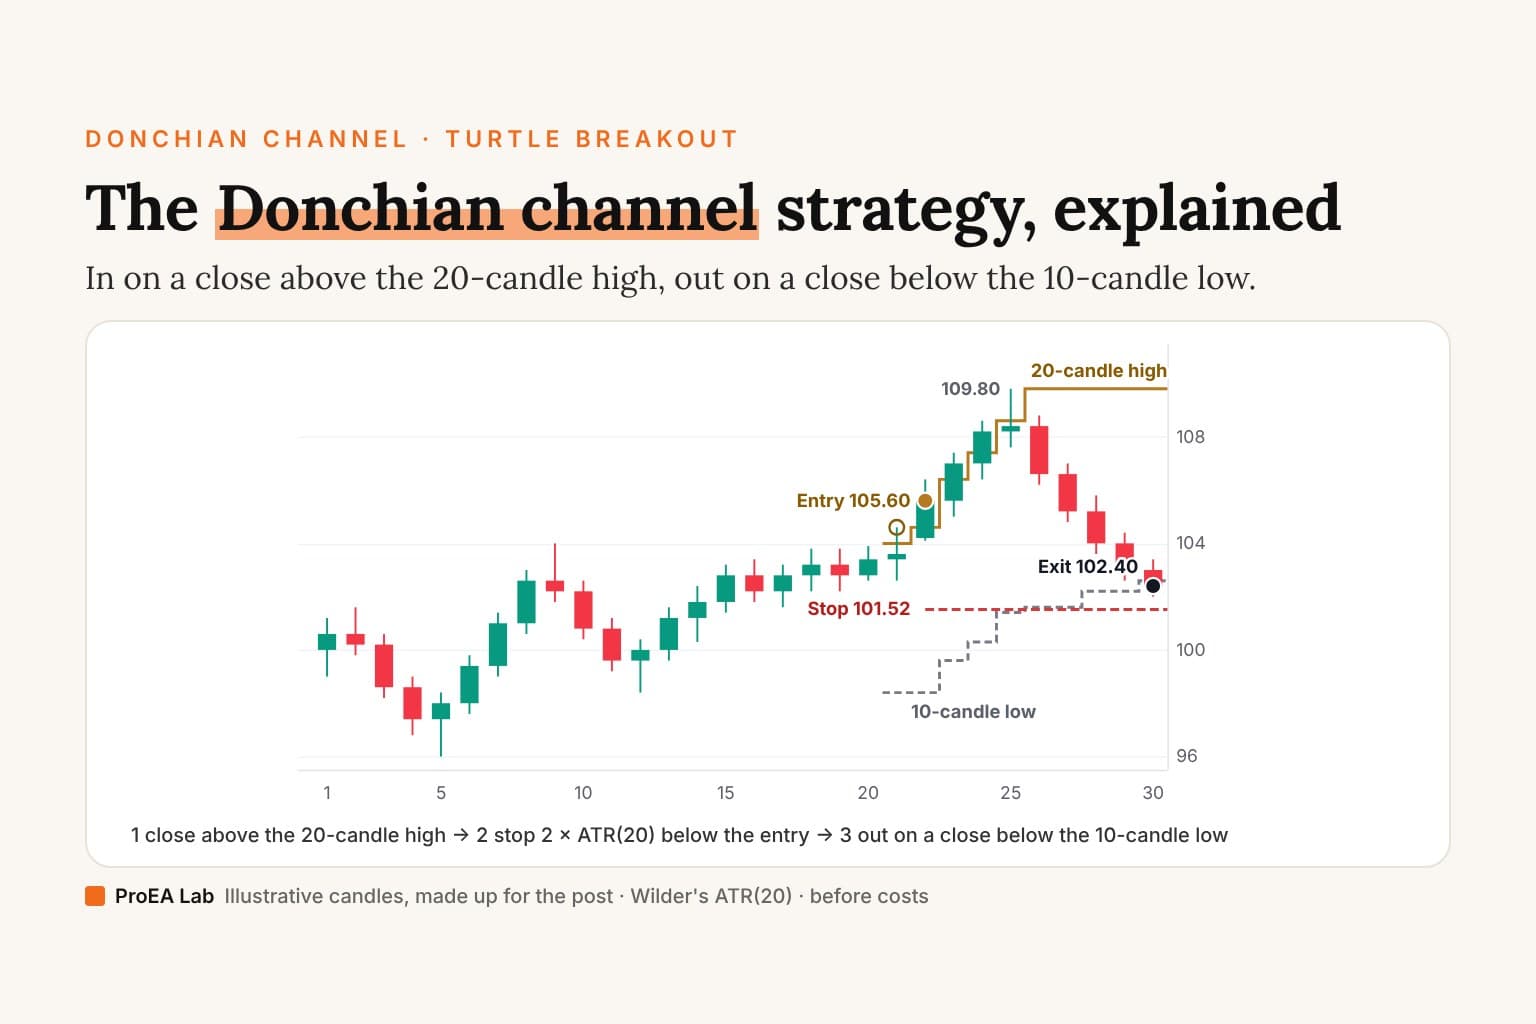
The numbers are illustrative: the 30 made-up candles of the Donchian explainer, where the whole table is. They aren't a market and they aren't a result.
- The level. Before candle 21, the highest high of candles 1 to 20 is 104.00, on candle 9.
- A wick, not a break. Candle 21 trades up to 104.60 but closes at 103.60, under 104.00. No entry.
- The break. For candle 22 the window is candles 2 to 21, so candle 21's wick has lifted the level to 104.60. Candle 22 closes at 105.60, above it: long at 105.60.
- The stop. ATR(20) is 2.00 after candle 21. Candle 22 opened above candle 21's close of 103.60, so its true range is 106.40 − 103.60 = 2.80, and the ATR becomes (2.00 × 19 + 2.80) ÷ 20 = 2.04. The stop goes 2 × 2.04 = 4.08 below the entry: 105.60 − 4.08 = 101.52. That 4.08 is 1R.
- The run. Candle 25's high of 109.80 puts the trade about +1.03R up. There is no target, so the trade stays on.
- The exit. Candle 30 closes at 102.40, below its 10-candle low of 102.60: out at 102.40.
- The result. (102.40 − 105.60) ÷ 4.08 = −3.20 ÷ 4.08 = −0.78R, before costs.
Where its false breaks come from
- Wicks. Candle 21 traded through the line and closed back under it. A close rule ignores that; the Turtle rules didn't wait: "Turtles always traded at the breakout when it was exceeded during the day, and did not wait until the daily close or the open of the following day." The close rule skips some wicks and pays more to get in when the break is real, as candle 22 did.
- Breaks that don't become trends. Candle 22's break was a real close above the line, and it still lost. The Turtle rules say this is the normal case: "Most breakouts do not result in trends. This means that most of the trades that the Turtles made resulted in losses."
- The exit's lag. For the first 10 candles of a trade, the 10-candle low still includes the entry candle's low, which is at or below the entry. So a channel exit in that time is always a loss; only a trend that lasts longer lets the exit climb above the entry.
The stop
The stop is 2 × ATR(20) from the entry, set once and never moved: wider when candles are wide, tighter when they are quiet. The Turtle rules put it the same distance away: "Turtle stops were set at 2 N below the entry for long positions, and 2 N above the entry for short positions." Size from it: with $100 at risk and a 4.08 stop, the size is 100 ÷ 4.08 = 24.5 units, rounded down to what your market trades. The Turtle position size calculator does the sum for your account, with the Turtles' own units.
The opening range breakout: two closes beyond the first 15 minutes
The rule
As Opening Range Desk 2.0 writes it, at its defaults:
- The level. The high and low of the 09:30–09:45 New York candles. The range is final on the first candle after 09:45.
- The break. A close beyond the range. A wick through it that closes back inside doesn't count.
- The entry. The second close in a row beyond the range. A close back inside resets the count.
- The stop. The other side of the range, plus 0.1 × ATR(14).
- The exit. TP1 at 1R moves the stop to the entry; TP2 at 2R ends the trade. One trade a day, and anything still open is closed at the end of the window, 15:55 on 5-minute candles.
The full rules, with a drill on two real gold days and the 5, 15 and 30-minute ranges compared, are in the opening range breakout strategy.
Worked by hand
Illustrative 5-minute candles, made up for this post:
| New York | Open | High | Low | Close | |
|---|---|---|---|---|---|
| 09:30 | 100.40 | 100.60 | 100.00 | 100.50 | range |
| 09:35 | 100.50 | 101.00 | 100.20 | 100.90 | range |
| 09:40 | 100.90 | 100.95 | 100.40 | 100.70 | range |
| 09:45 | 100.70 | 101.25 | 100.65 | 101.10 | first close above |
| 09:50 | 101.10 | 101.20 | 100.80 | 100.90 | back inside: the count resets |
| 09:55 | 100.90 | 101.30 | 100.85 | 101.20 | first close above, again |
| 10:00 | 101.20 | 101.50 | 101.10 | 101.40 | second close in a row: entry |
- The range. Its high is 101.00 (09:35) and its low is 100.00 (09:30).
- The count. 09:45 closes at 101.10, above 101.00: one. 09:50 closes at 100.90, back inside: the count goes back to zero. 09:55 closes at 101.20: one. 10:00 closes at 101.40: two, so the entry is 101.40.
- The stop. Say ATR(14) is 0.40 at that close. 0.1 × 0.40 = 0.04, so the stop is 100.00 − 0.04 = 99.96, and 1R = 101.40 − 99.96 = 1.44.
- The targets. TP1 = 101.40 + 1.44 = 102.84. TP2 = 101.40 + 2 × 1.44 = 104.28.
- The end. Say price gets as far as 102.50, short of TP1, and is at 101.80 when the window ends at 15:55. The trade closes there: (101.80 − 101.40) ÷ 1.44 = 0.40 ÷ 1.44 = +0.28R, before costs.
That last step is the usual ending, not a special case. In our backtest on gold, 97 of the default's 167 trades were closed at the end of the window, neither stopped nor at TP2.
Where its false breaks come from
- The open itself. The first minutes after 09:30 are when the range is still forming, and a first close beyond it can be followed by a close back inside, as at 09:50. That is why the desk waits for two closes in a row. In our backtest, waiting for the second close lost less than taking the first in all seven cells we ran, on gold −0.24R against −6.14R, and the study is plain about it: "Losing less is not making money. Neither version ended above zero anywhere."
- Fake-outs the chart marks. Opening Range Desk marks candles that poked through the range and closed inside with ✕. It can also exit when a candle closes back inside, or trade the failure the other way, the opening range reversal. Neither switch was part of our backtest.
- A wide range. The stop sits on the far side, so a wide range makes a wide stop, TP1 and TP2 sit far away, and the day can end before price reaches either.
The stop
The default is the other side of the range plus 0.1 × ATR(14); the desk also offers the range's midpoint, or a stop 1.5 × ATR(14) from the entry. The padding is there "so a trade isn't stopped by the exact tick of the range's edge." On gold the default's median stop was 30.21 an ounce from the entry, which is why costs took only 0.015R of a gold trade.
The FVG breakout strategy: a swing break, then a limit in the first gap
The rule
As Breakaway Desk 2.0.0 writes it, on standard 1–5 minute candles:
- The level. Confirmed 15-minute swing highs and lows: pivots with 2 candles on each side.
- The break. A chart candle closes beyond a confirmed swing that is still unbroken.
- The gap. The first same-direction fair value gap within the next ten chart candles. For a long, a third candle's low at least one tick above the first candle's high.
- The entry. A resting limit at the gap's near edge (its midpoint, as an option), which waits 10 minutes for price to come back.
- The stop. Beyond the latest opposite swing on the chart, padded by 0.1 × ATR(14), at least one tick.
- The exit. A target at 1R. Entry, stop, target and size are frozen when the plan is made, sized to a $100 risk budget by default.
Three endings follow: the target, the stop, or no return, when the limit expires and there is no trade. Before a fill, the limit is also cancelled if a candle closes at or beyond the stop or price breaks the other way.
Worked by hand
Illustrative 1-minute candles, made up for this post. The givens: the latest confirmed 15-minute swing high is 100.00; the latest confirmed swing low on the 1-minute chart is 99.40, the low of the 09:55 candle; ATR(14) is 0.20; the tick is 0.01.
| Time | Open | High | Low | Close | |
|---|---|---|---|---|---|
| 10:00 | 99.90 | 100.04 | 99.86 | 99.95 | a wick above 100.00, a close below: no break |
| 10:01 | 99.95 | 100.10 | 99.93 | 100.08 | a close above 100.00: the break |
| 10:02 | 100.08 | 100.15 | 100.02 | 100.12 | the gap's first candle |
| 10:03 | 100.12 | 100.55 | 100.10 | 100.50 | the gap's middle candle |
| 10:04 | 100.50 | 100.62 | 100.27 | 100.58 | the gap's third candle |
- The break. 10:01 closes at 100.08, above 100.00. The 10:00 candle's wick to 100.04 didn't count: it closed at 99.95.
- The first gap. 10:04's low, 100.27, is above 10:02's high, 100.15, by 0.12: a bullish fair value gap from 100.15 to 100.27. No earlier three candles leave one: 10:03's low, 100.10, doesn't clear 10:01's high, 100.10, by a tick.
- The limit. At the gap's near edge, its top: 100.27. With the midpoint option it would be 100.21.
- The stop. 0.1 × 0.20 = 0.02, more than one tick, so the stop is 99.40 − 0.02 = 99.38, and 1R = 100.27 − 99.38 = 0.89.
- The target. 100.27 + 0.89 = 101.16.
- The size. $100 ÷ 0.89 = 112.4 units, rounded down to what the market trades.
- The clock. The plan is made when the 10:04 candle closes, at 10:05, and the limit waits until 10:15. Then one of three things: price comes back to 100.27 and reaches 101.16 first (+1R before costs); it comes back to 100.27 and falls to 99.38 first (−1R before costs, more with slippage and fees); or it doesn't come back by 10:15, and there is no trade.
The 0.12-wide gap and the 0.89 stop show this shape's trade-off: the entry is precise, but the stop is set by the swing, not by the gap. For the classic, LuxAlgo and Arjo definitions of a breakaway gap, each worked on three candles of its own, see breakaway gap vs fair value gap.
Where its false breaks come from
- A small close beyond a swing. The break is one 1–5 minute close beyond a 15-minute level, which can be a few ticks, and a wick like 10:00's doesn't count at all.
- Which breaks fill. A limit fills only when price comes back. A break that is failing has to come back through the gap on its way to the stop, so it fills if it comes back within the 10 minutes; a break that runs on never comes back, and ends with no trade. The false breaks are the ones that reach the order.
- Old levels. A 15-minute pivot with 2 candles on each side is only confirmed when the second 15-minute candle after it has closed, so a swing is at least half an hour old by the time it can be broken.
The stop
The default stop is beyond the latest opposite swing on the chart, padded by 0.1 × ATR(14); the desk also offers the gap's far edge or an ATR distance instead. A swing far from the gap means a wide stop and a far target, as in the example; a swing close to it means a tight stop, and costs then take a bigger share of 1R.
Is breakout trading profitable?
Some breakout rules, on some markets, in some periods, after costs. There is no answer for breakout trading as a whole: the question only has one for a written rule, on a market, over a period, after its costs. Here is what ours did, each in the words and figures of its own study.
| Rule | Market and candles | Result after costs |
|---|---|---|
| The Donchian close | Six crypto perpetuals, 4-hour, long only | Passed its pre-registered final test, January–August 2026 |
| The opening range | Gold 15-minute; Bitcoin and Ether perpetuals 5-minute | Lost money on every market; rejected under the plan's rule |
| The swing break into the first gap | MGC and MNQ, intraday | Lost money in validation |
The Donchian close on crypto: passed one pre-registered test
Breakaway Desk Premium's Trend Radar runs the first rule on six crypto perpetuals at 4 hours, long only. It was picked on 2021–23, confirmed on 2025, then run once on January–August 2026 under a protocol fingerprinted on 24 Sep 2026, 14:30:23 UTC. The study, does Turtle trading still work?, reports it this way:
"It passed. In the final test, Jan–Aug 2026, the rule made +36.1R over 137 trades with a profit factor of 1.41, and 5 of 6 markets ended up. Only 27% of trades won, and the result fell 60.7R before August recovered it."
It is a hypothetical backtest after estimated costs, not a forecast, and not a live record. The costs were "a 0.05% fee per side, one tick of stop slippage, and 0.01% funding per started 8 hours." In the study's own words, "That answers the question for one rule, one market type and one window, nothing more." Its caveats, from the same page:
- A few trades carried it. The best 14 trades made +110.1R; the other 123 lost 74.0R.
- One August. January to July was −43.8R; August's 15 trades made +79.9R.
- A thin confirmation. The year that confirmed the rule, 2025, made +21.6R on 203 trades, with a profit factor of 1.18.
- Not other markets, not shorts, not other settings. "Other markets were not tested." The rule is long only, and only 20, 10 and 2 × ATR on 4-hour candles were tested.
- No holding benchmark. "The study doesn't report what holding the six coins long made over the same months, so it can't say the rule beat holding."
The opening range: lost money after costs
Opening Range Desk's default, run with its own engine under a plan committed before the first result. The study, Opening Range Desk: what we measured, opens with its verdict: "After costs, nothing we ran passed the plan's rule, and the default lost money on every market."
- Gold, 15-minute candles, 1 October 2025 to 29 May 2026: 167 trades, 40.1% won, +2.22R before costs and −0.24R after them. Rejected.
- Bitcoin and Ether perpetuals, 5-minute candles, with the 09:30 New York range as the anchor: below zero after costs in every period from 2021 to August 2026. On the 2026 holdout, the period the plan judges, Bitcoin ended at −47.82R over 240 trades and Ether at −17.71R over 241. Rejected.
- Before costs, on Bitcoin and Ether, it was close to zero: "under a tenth of an R a trade either way."
Its caveats, from the same page:
- Not every market yet. "The Nasdaq 100 and the S&P 500 are not in this article yet": that run is still to come.
- A forward test. "The owner's plan A runs the default forward on SPY, QQQ and gold on TradingView until 60 trades per market or 31 March 2027."
- One range length judged. The 30-minute range ended at +1.61R on gold, which the study reports as a description, not a test: "With one market and eight months, that says which way to look next, not what works."
- Your costs. "A different spread or commission changes every row above."
- What it doesn't mean. "That doesn't mean no opening range trade works." The desk "ships with these defaults as a starting point you can read and change, not as a tested strategy."
The swing break into the first gap: lost money in validation
Breakaway Desk's own page answers "Do these rules make money?" with: "Not in our test. The author's registered validation on MGC and MNQ lost money after costs: core validation MGC −USD295 over 8 trades and MNQ −USD144 over 9, on two observed days. The on-chart record is this chart's history, not a forecast."
Breakaway Desk Premium's page says the same of these rules on six intraday markets: "A monitor: these intraday rules lost money in our validation." So Breakaway Desk is a plan-drawing and monitoring tool, sold in Pine Pro Library with its full Pine v6 source: it draws the plan and says what is happening on your chart, and in its page's words it "never places an order".
So, is breakout trading profitable?
One of our three rules passed one test, on one kind of market, in one eight-month window, with the caveats above. Two lost money. That is the honest size of the answer: some rules, on some markets, in some periods, after costs. A breakout strategy is something to write down and test on your own market, with your own costs, before you trade it, and none of these results is a forecast.
Crypto breakout strategy: what a 24-hour market changes
A breakout in crypto trading is what it is anywhere: price moving beyond a level that held it. Three things change:
- There is no open. Crypto never closes, so an opening range needs an anchor you choose. Our opening range test used 09:30 New York on Bitcoin and Ether: a time, not an exchange open.
- Perpetuals charge funding. Funding is paid or received while a trade is open. The Trend Radar's test charged "0.01% funding per started 8 hours", so a breakout held for days pays it many times.
- Costs are a share of the stop. A fee is a percentage of the price; the stop is a distance. The closer the stop, the more of 1R the same fee takes.
Our two crypto breakout tests show the size of that last point. The 4-hour Donchian close, with stops 2 × ATR(20) on 4-hour candles: "a stop-out averaged −1.05R, not −1R." The opening range on 5-minute Bitcoin candles: "The fees and the funding took about 0.11R to 0.24R a trade on average (0.19R to 0.24R on Bitcoin), and the rule never made that much before them." The one crypto rule of ours that passed its test was the slow one.
What research says about crypto trend following, with each paper's status, is in the Turtle study; check your own exchange's costs with the crypto perp fee calculator before you test anything.
Day trading breakout strategies: costs against a small stop
The formula of a breakout doesn't know the time frame: a 20-candle high on a 5-minute chart is computed exactly like one on a daily chart. What changes on short candles is the arithmetic of the trade:
- The stop shrinks, the cost doesn't. A spread or a commission is about the same amount per trade on any chart, while a stop set from the candles shrinks with them. On gold, the opening range's 5-minute range made smaller stops than the 15-minute default, so "the same 0.40 cost took more of each trade: 0.024R on average, against 0.015R for the default and 0.0125R for the 30-minute range."
- More breaks, more costs. A short window is broken more often, so the rule trades more often, and each trade pays the cost again.
- More than a touch. Both of our intraday rules ask for more than a touch of the level: two closes in a row, or a close and then a return to a gap.
Both of our day-trading breakout rules lost money after costs, as the tables above show. For the Donchian channel on intraday charts, see Donchian channel strategy intraday.
Try the three rules on TradingView
- The Donchian close. TradingView has the channel built in as Donchian Channels (DC). Our free script Donchian Breakout 20/10 in R [ProEA] draws the entry, the 2 × ATR stop and each trade's R on one market: copy the Pine code from this text file. The open-source Donchian and Turtle scripts are read line by line in the best Donchian channel indicator for TradingView, and the four rules fit on one page (PDF).
- The opening range. Opening Range Desk draws the range, the closes and the plan, and its Strategy Lab runs the rule in TradingView's Strategy Tester with your costs; both are in Pine Pro Library with their full source. The ten most-boosted open-source ORB scripts are code-read in the best ORB indicator for TradingView, and the rules fit on one printable page (PDF).
- The swing break into the first gap. Breakaway Desk draws the break, the resting limit and its three endings on 1–5 minute candles, with its full Pine v6 source in Pine Pro Library. Its rules lost money in validation; it is a monitor, not a strategy that has passed a test.
- The size. Every rule here sets its stop first. The Turtle position size calculator sizes a 2N stop from your account, and the risk reward calculator checks a plan's 1R and 2R targets.
Breakaway Desk Premium: the Donchian close, on six markets
Breakaway Desk Premium is the first rule on this page, the one that passed its test, built for TradingView. Its Trend Radar is a 4-hour, long-only 20/10 Donchian rule on six crypto perpetuals: BTC, ETH, SOL, XRP, BNB and DOGE. It draws on the chart you open and keeps all six in its table. It places no orders.
What the download holds, in the product's own words:
- Trend Radar. "Six crypto perpetuals on 4-hour candles with the rule set the pre-registered test picked; entries, stops and exits drawn; one alert for all six, as text or JSON."
- Strategy twin. "The same rules in TradingView's Strategy Tester, with an R table and a trade log."
- Research Lab. "Download Binance's public data, reproduce every published figure, backtest your own rules, check TradingView's trade log against the engine."
- AI Builder Kit. "AGENTS.md, a loadable skill, architecture and invariants, recipes, a testing workflow and prompts for Claude Code, Codex, Cursor and Windsurf."
- Alert relay. "Forwards the alerts to Discord or Telegram. Never places orders."
- Breakaway Desk Premium. "Everything the library desk does, plus a six-market intraday Radar strip and one alert. A monitoring tool: its intraday rules lost money in validation."
The alerts need a paid TradingView plan. TradingView's pricing page (read 29 October 2026) gives the row "Active technical alerts on indicators, strategies, and drawings" as ✗ on Basic, 20 on Essential, 100 on Plus, 400 on Premium and 1,000 on Ultimate, so the alert needs Essential or above.
It is $49 once, not a subscription, and included for Academy Premium members and Complete Suite buyers. Hypothetical backtest after estimated costs, not a forecast. Never places orders.
Sources
- The Original Turtle Trading Rules (PDF), on the Original Turtles site, read 29 October 2026.
- StockCharts ChartSchool, Price Channels, read 29 October 2026.
- TradingView's pricing page, the alert rows, read 29 October 2026.
- Our studies: does Turtle trading still work? (the Trend Radar's pre-registered test,
src/data/breakaway-trend-study.ts), Opening Range Desk: what we measured (data/research/orb-study/results.json), and Breakaway Desk's page in Pine Pro Library (its validation answer). - The rules: Breakaway Desk 2.0.0's Pine source, Opening Range Desk 2.0's engine contract, and the Trend Radar's rule as Breakaway Desk Premium's page states it. The Donchian example is
src/components/blog/donchian-strategy/donchian-example.ts; the other two examples' candles are in this post's cover script.
Disclosure
We, ProEA Lab, build Breakaway Desk, Breakaway Desk Premium and Opening Range Desk, and sell them in Pine Pro Library and the Premium Vault. The code is AI-assisted. The worked examples' numbers are made up to show the arithmetic; they are not a market and not a result. Every test result here is a hypothetical backtest or a validation on historical data, after estimated costs, not a live record and not a forecast. Trading involves risk.
Frequently asked questions
What is breakout trading strategy?
A written rule for trading price as it moves beyond a level that held it. It names five things: the level (a 20-candle high, an opening range, a swing), what counts as a break (a wick, a close, two closes), where you get in, where the stop goes and how you get out. Without all five it is an idea, not a strategy you can test.
Is breakout trading profitable?
Some breakout rules, on some markets, in some periods, after costs; there is no general yes. Of our three tests, a 20/10 Donchian close rule, long only on six crypto perpetuals at 4 hours, passed its pre-registered final test: +36.1R over 137 trades in January–August 2026, a profit factor of 1.41 and 5 of 6 markets up, with 27% of trades winning and a 60.7R fall on the way. That is a hypothetical backtest after estimated costs, not a forecast. The opening range breakout's default lost money after costs on gold, Bitcoin and Ether, and Breakaway Desk's intraday rules lost money in validation.
What is a false breakout?
A break that doesn't carry on. The mild kind is a wick through the level that closes back inside, which a close rule ignores. The costly kind closes beyond the level and then turns back, and that is a loss. The original Turtle rules say most breakouts do not result in trends, so most of their trades lost; a breakout rule pays for those with small, fixed stops and waits for the few that run.
Where do you put the stop on a breakout trade?
Where the rule says the break has failed. Our three rules put it 2 × ATR(20) below the entry for the Donchian close, on the other side of the opening range plus 0.1 × ATR(14), and beyond the latest opposite swing plus 0.1 × ATR(14) for the swing break. Size the trade from that distance, so a stop costs what you chose to risk.
What is an FVG breakout strategy?
A break of a swing high or low, then an entry in the first fair value gap the move leaves, on the bet that price comes back to it. Breakaway Desk does it on 1–5 minute candles: a close beyond a confirmed 15-minute swing, a resting limit at the first same-direction gap's near edge for 10 minutes, a stop beyond the latest opposite swing and a 1R target. Its rules lost money in the author's validation after costs.
What is breakout in crypto trading?
The same as on any chart: price moving beyond a level that held it. Crypto trades around the clock, so an opening range needs an anchor you choose, and perpetual futures charge funding while a trade is open. In our test the opening range at 09:30 New York lost after costs on Bitcoin and Ether in every period, with fees and funding taking about 0.19R to 0.24R of a Bitcoin trade on average.
What is the best breakout strategy for day trading?
We can't name one. The two day-trading breakout rules we tested both lost money after costs: the opening range breakout's default on gold, Bitcoin and Ether, and Breakaway Desk's swing break into the first gap on MGC and MNQ. On short candles the stop is small, so the same fee or spread takes a bigger share of every trade.
What is the 20 day breakout strategy?
The Turtle traders' System 1 entry: buy when price exceeds the high of the preceding 20 days, sell short below the 20-day low, and exit on a 10-day breakout the other way, with a stop 2 N from the entry. A close-based version enters on a close above the 20-candle high, puts the stop 2 × ATR(20) below and exits on a close below the 10-candle low.