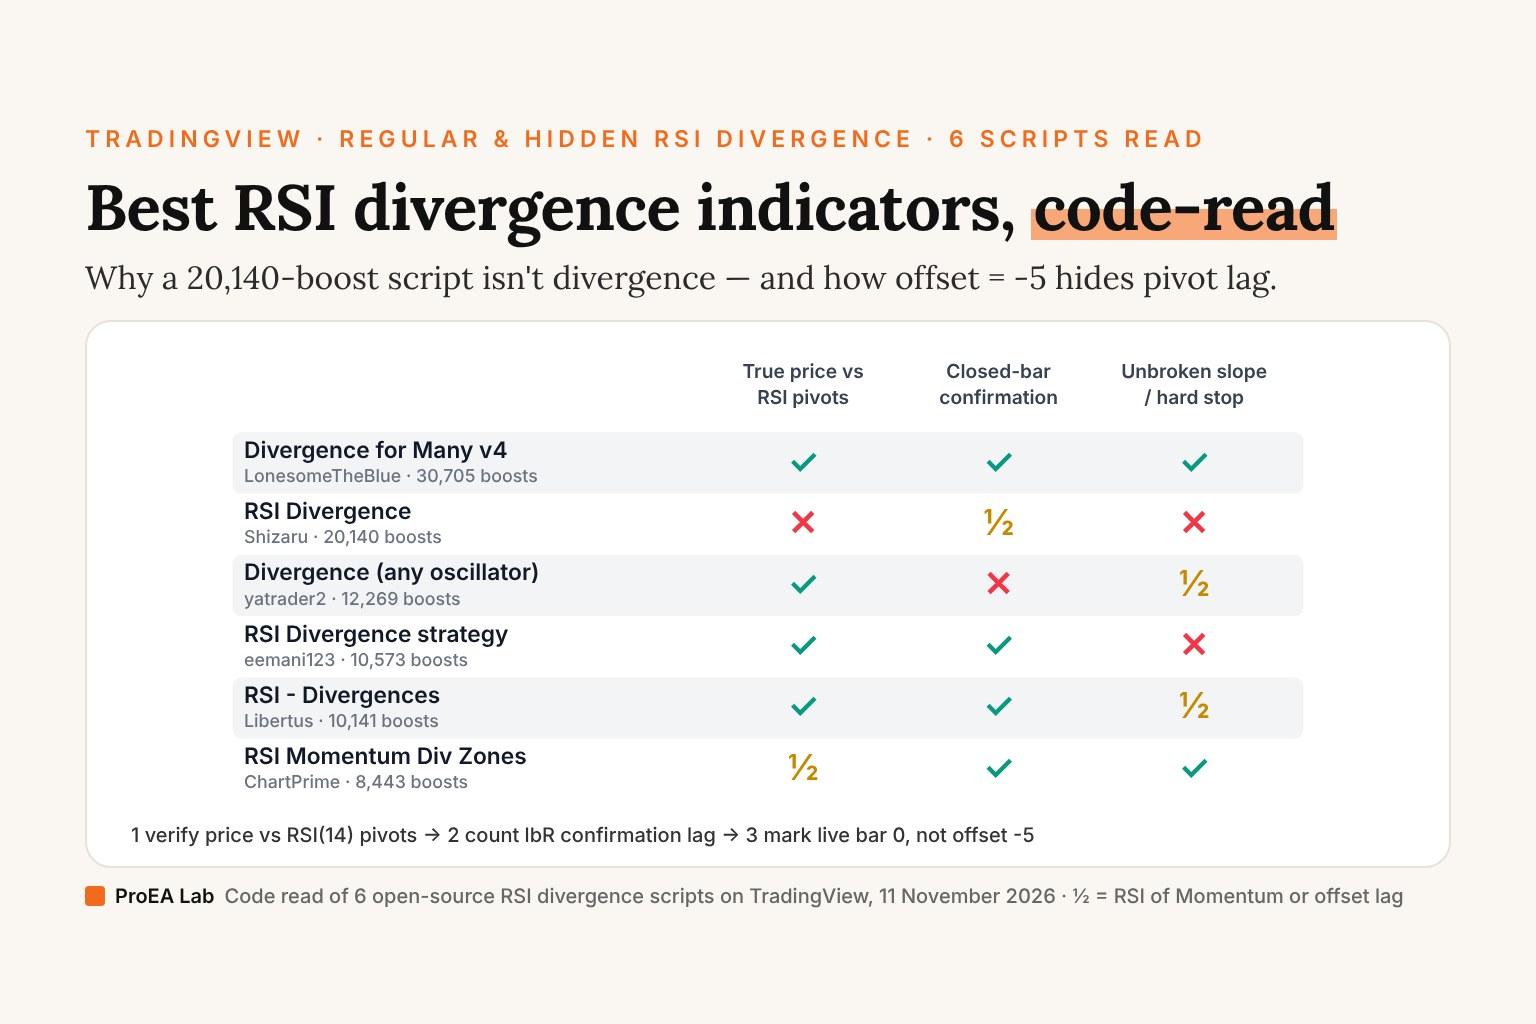
When we read the source code of six popular open-source RSI divergence scripts on TradingView on 11 November 2026, two findings stood out immediately: the second most-boosted script in our table, Shizaru's "RSI Divergence" (20,140 boosts), never compares price to RSI at all, and pivot-based scripts such as yatrader2's and TradingView's built-in plot their "Bull" / "Bear" tags 5 bars into the past (offset = -lbR), so historical screenshots hide the 5-bar confirmation delay.
Below is our line-by-line scorecard of the most-followed RSI divergence indicators on TradingView, what each script's math actually computes, why offset = -5 distorts visual backtesting, and a complete //@version=6 indicator that marks both the pivot slope and the exact real-time confirmation candle.
Scorecard: six TradingView RSI divergence scripts, read from source
| Script & Author | Boosts (11 Nov 2026) | Pine Version & Length | True Price-vs-Oscillator Divergence? | Pivot Right Lag (lbR) | Closed-Bar Lock by Default? | Key Source Finding |
|---|---|---|---|---|---|---|
Divergence for Many Indicators v4 (LonesomeTheBlue, n8AGnIZd) | 30,705 | v4 · 410 lines | Yes (10 oscillators + unbroken slope loop) | prd = 5 bars | Yes (dontconfirm = false, L16) | Checks intermediate bars so neither price nor RSI pierces the divergence line |
RSI Divergence (Shizaru, fH6e5TuN) | 20,140 | v3 · 17 lines | No | 0 (not pivot-based) | Causal oscillator | Line 13 is literally rsi(close, 5) - rsi(close, 14) — not price-vs-RSI divergence! |
Divergence Indicator (any oscillator) (yatrader2, sxZRzQzQ) | 12,269 | v4 · 168 lines | Yes (Regular + Hidden) | lbR = 5 (5..60 bar range) | No (delay_plot_til_closed = false, L24) | Plots labels at offset = -lbR (5 bars back), hiding entry delay on screenshots |
RSI Divergence Indicator strategy (eemani123, qSLcZSyw) | 10,573 | v4 · 209 lines | Yes (RSI(9) pivots) | lbL = 1, lbR = 3 | Strategy fills next open | sl_type = "NONE" by default (stopLoss = 5% off) + pyramiding = 2; holds losers until RSI > 80 |
Relative Strength Index - Divergences (Libertus, 42wcFfql) | 10,141 | v4 · 100 lines | Yes (90-bar window extremes) | 2-bar pivot + 1-bar delay | Yes (bar_index - 1) | Flags divergences only near rolling 90-bar RSI extremes rather than arbitrary mid-band swings |
RSI Momentum Divergence Zones (ChartPrime, x3KNfmR3) | 8,443 | v6 · 135 lines | Modified (RSI of Momentum!) | Hardcoded 5 / 5 (L21–22) | Causal after 5-bar pivot | Lines 42–43 compute ta.rsi(ta.mom(close, 10), 14) — RSI of 10-bar Momentum, not ta.rsi(close, 14) |
Four surprises hidden inside the .pine files
1. The 20,140-boost script that isn't divergence (Shizaru, fH6e5TuN)
Traders searching "RSI Divergence" on TradingView routinely click Shizaru's 20,140-boost script expecting pivot lines between lower price lows and higher RSI lows. Here is the entire math on lines 9–13 of fH6e5TuN:
rsi_fast   = rsi(src_fast, len_fast)   // default RSI(close, 5)
rsi_slow   = rsi(src_slow, len_slow)   // default RSI(close, 14)
divergence = rsi_fast - rsi_slow
Price highs and lows never appear anywhere in the file. It is a two-speed RSI spread histogram (conceptually identical to MACD on RSI), not a price-oscillator divergence detector.
2. ChartPrime's hidden ta.mom(close, 10) wrapper (x3KNfmR3, 8,443 boosts)
ChartPrime's RSI Momentum Divergence Zones (135 lines of Pine v6) draws clean horizontal supply and demand zones whenever a divergence confirms and terminates each box once high > levelY or low < levelY. Just note two hardcoded choices in the source:
- Lines
42–43:rsiVal = ta.rsi(ta.mom(close, momLen), rsiLen)feeds10-bar price momentum (close - close[10]) intota.rsi(..., 14)instead ofclose. That second derivative makes the oscillator snap to70/30much faster than Wilder's standardRSI(14). - Lines
21–22:int divLookbackR = 5andint divLookbackL = 5are constants rather thaninput.int()fields, so you cannot shorten the5-bar confirmation lag from the UI.
3. Why eemani123's strategy can print a high win rate (qSLcZSyw, 10,573 boosts)
A mean-reversion strategy's win rate says little when losing trades are never closed at a stop. In qSLcZSyw (209 lines), RSI(9) bullish divergences enter with lbL = 1, lbR = 3 and pyramiding = 2, while sl_type defaults to "NONE" (leaving the 5 percent stop-loss disabled unless you open Settings and switch sl_type to "PERC"). Long positions stay open through deep drawdowns until RSI(9) eventually bounces above 80 (or hits a trailing take-profit). Always enable a hard structural or ATR stop before evaluating any divergence backtest.
4. The offset = -lbR back-painting illusion (TradingView built-in & yatrader2)
Both TradingView's built-in Divergence Indicator and yatrader2's sxZRzQzQ (12,269 boosts) detect swings with pivothigh(osc, lbL, lbR) and pivotlow(osc, lbL, lbR) using defaults lbL = 5, lbR = 5, rangeLower = 5 and rangeUpper = 60.
Mathematically, pivotlow(rsi, 5, 5) cannot know bar t was a local 11-bar minimum until bar t + 5 closes. Once bar t + 5 closes, the script draws the "Bull" label using offset = -5 — stamping the badge back onto bar t's wick! That is not lookahead bias (see how to tell if an indicator repaints), but when you scroll back over a chart, your eye measures entries from bar t's bottom tick instead of bar t + 5's close, where half the bounce may already be over.
Regular vs Hidden RSI divergence settings cheat sheet
The last column is a starting point to test on your own market, not a setting we have tested.
| Divergence Type | Price Swing (Pivot 1 -> Pivot 2) | RSI(14) Swing (Pivot 1 -> Pivot 2) | Market Context | Starting lbL / lbR (untested) |
|---|---|---|---|---|
| Regular Bullish | Lower Low (low[lbR] < prevLow) | Higher Low (rsi[lbR] > prevRsi) | Exhaustion at higher-timeframe demand / session sweep | 5 / 3 (intraday) or 5 / 5 (4H/1D) |
| Hidden Bullish | Higher Low (low[lbR] > prevLow) | Lower Low (rsi[lbR] < prevRsi) | Pullback continuation inside an established uptrend | 5 / 2 or 5 / 3 paired with EMA(50) / VWAP |
| Regular Bearish | Higher High (high[lbR] > prevHigh) | Lower High (rsi[lbR] < prevRsi) | Exhaustion at higher-timeframe supply / range high | 5 / 3 (intraday) or 5 / 5 (4H/1D) |
| Hidden Bearish | Lower High (high[lbR] < prevHigh) | Higher High (rsi[lbR] > prevRsi) | Rally pullback inside an established downtrend | 5 / 2 or 5 / 3 paired with EMA(50) / VWAP |
If you prefer an EMA-normalized typical-price oscillator over Wilder's close-only RSI, compare how 2-bar fractal divergences behave inside WaveTrend oscillator settings or how two-EMA histogram scripts compare in best MACD indicators on TradingView.
Honest Pine Script v6 RSI Divergence Indicator (Pivot Slope + Real-Time Bar 0 Signal)
Unlike scripts that only stamp "Bull" 5 bars in the past, this standalone //@version=6 indicator draws the true historical divergence line between the two RSI pivots (bar_index - lbR) and plots a distinct "BULL" / "H-BULL" / "BEAR" / "H-BEAR" confirmation marker on the actual closed candle (bar_index) where an alert or live order can execute without hindsight:
//@version=6
indicator("ProEA Honest RSI Divergence v6 (Pivot Slope + Live Confirm Bar)", shorttitle = "RSI Div v6", overlay = false, max_lines_count = 200)

int  rsiLen     = input.int(14, "RSI Length", minval = 2)
int  lbL        = input.int(5, "Pivot Lookback Left (lbL)", minval = 1)
int  lbR        = input.int(3, "Pivot Confirmation Right (lbR)", minval = 1)
int  rangeMin   = input.int(5, "Min Bars Between Pivots", minval = 2)
int  rangeMax   = input.int(60, "Max Bars Between Pivots", minval = 10)
bool showReg    = input.bool(true, "Detect Regular Divergences (Reversal)")
bool showHid    = input.bool(true, "Detect Hidden Divergences (Continuation)")

float rsi = ta.rsi(close, rsiLen)

float pl = ta.pivotlow(rsi, lbL, lbR)
float ph = ta.pivothigh(rsi, lbL, lbR)

var float prevPlRsi = na
var float prevPlLow = na
var int   prevPlBar = na

var float prevPhRsi = na
var float prevPhHi  = na
var int   prevPhBar = na

bool regBull = false
bool hidBull = false
bool regBear = false
bool hidBear = false

int pivBar = bar_index - lbR

if not na(pl) and barstate.isconfirmed
    float curLow = low[lbR]
    int   span   = na(prevPlBar) ? 0 : pivBar - prevPlBar
    bool  inSpan = not na(prevPlBar) and span >= rangeMin and span <= rangeMax
    regBull := showReg and inSpan and curLow < prevPlLow and pl > prevPlRsi
    hidBull := showHid and inSpan and curLow > prevPlLow and pl < prevPlRsi
    if regBull or hidBull
        line.new(prevPlBar, prevPlRsi, pivBar, pl, color = regBull ? #089981 : #0284c7, width = 2)
    prevPlRsi := pl
    prevPlLow := curLow
    prevPlBar := pivBar

if not na(ph) and barstate.isconfirmed
    float curHi  = high[lbR]
    int   span   = na(prevPhBar) ? 0 : pivBar - prevPhBar
    bool  inSpan = not na(prevPhBar) and span >= rangeMin and span <= rangeMax
    regBear := showReg and inSpan and curHi > prevPhHi and ph < prevPhRsi
    hidBear := showHid and inSpan and curHi < prevPhHi and ph > prevPhRsi
    if regBear or hidBear
        line.new(prevPhBar, prevPhRsi, pivBar, ph, color = regBear ? #f23645 : #ea580c, width = 2)
    prevPhRsi := ph
    prevPhHi  := curHi
    prevPhBar := pivBar

hline(70, "Overbought 70", color = color.new(#f23645, 55), linestyle = hline.style_dashed)
hline(50, "Midline 50", color = color.new(color.gray, 70))
hline(30, "Oversold 30", color = color.new(#089981, 55), linestyle = hline.style_dashed)
plot(rsi, "RSI", color = #2962ff, linewidth = 2)

bool regBullNow = regBull and barstate.isconfirmed
bool hidBullNow = hidBull and barstate.isconfirmed
bool regBearNow = regBear and barstate.isconfirmed
bool hidBearNow = hidBear and barstate.isconfirmed

// Real-time marker on bar_index (zero offset: shows exact bar where signal actually confirms!)
plotshape(regBullNow, "Confirmed Regular Bull (Live Bar)", shape.labelup,   location.bottom, #089981, text = "BULL",   textcolor = color.white, size = size.tiny)
plotshape(hidBullNow, "Confirmed Hidden Bull (Live Bar)",  shape.labelup,   location.bottom, #0284c7, text = "H-BULL", textcolor = color.white, size = size.tiny)
plotshape(regBearNow, "Confirmed Regular Bear (Live Bar)", shape.labeldown, location.top,    #f23645, text = "BEAR",   textcolor = color.white, size = size.tiny)
plotshape(hidBearNow, "Confirmed Hidden Bear (Live Bar)",  shape.labeldown, location.top,    #ea580c, text = "H-BEAR", textcolor = color.white, size = size.tiny)

alertcondition(regBullNow, "Confirmed Regular Bullish RSI Divergence", "Confirmed regular bullish RSI divergence on closed bar")
alertcondition(hidBullNow, "Confirmed Hidden Bullish RSI Divergence",  "Confirmed hidden bullish RSI divergence on closed bar")
alertcondition(regBearNow, "Confirmed Regular Bearish RSI Divergence", "Confirmed regular bearish RSI divergence on closed bar")
alertcondition(hidBearNow, "Confirmed Hidden Bearish RSI Divergence",  "Confirmed hidden bearish RSI divergence on closed bar")
Want to merge this RSI divergence pane with an overlay indicator on TradingView Free, or port an RSI rule into MetaTrader? Combine scripts in our Pine Script indicator merger, or draft an EA skeleton in our Pine Script to MQL5 converter and Pine Script to MQL4 converter.
Always check two lines in any RSI divergence indicator before trading it: whether it actually compares price swings againstta.rsi(close, 14), and where price sits lbR bars after the pivot when the signal truly confirms.Frequently asked questions
Which RSI divergence indicator is best on TradingView?
Of the six open-source RSI divergence scripts we read on 11 November 2026, LonesomeTheBlue's Divergence for Many Indicators v4 (30,705 boosts) is the most rigorous multi-oscillator implementation because it verifies an unbroken virtual slope between pivots and waits for a closed confirmation bar when dontconfirm = false on line 16. For pure single-pane RSI(14) regular and hidden divergences without visual offset illusions, use the standalone Pine Script v6 indicator below.
Does TradingView's built-in RSI Divergence indicator repaint?
Once confirmed after lbR = 5 closed bars, a pivot low or pivot high does not disappear from history, so it does not repaint in the lookahead sense. However, plotting the Bull or Bear label with offset = -5 places the tag 5 candles to the left on the pivot extreme rather than on the confirmation candle where a live trader actually receives the alert.
Why does Shizaru's 20,140-boost RSI Divergence script never draw divergence lines?
Reading all 17 lines of Shizaru's script (fH6e5TuN) shows it never compares price highs or lows against RSI at all. Line 13 simply subtracts two RSI lengths: divergence = rsi(close, 5) - rsi(close, 14), making it a fast-minus-slow RSI momentum spread rather than a classical divergence detector.
Why can the RSI Divergence strategy by eemani123 show a high win rate?
In eemani123's 209-line RSI(9) strategy (10,573 boosts), sl_type defaults to NONE and pyramiding is set to 2. Losing long positions are held without a hard stop-loss until RSI(9) eventually crosses above 80 (or until a 5 percent stop is manually enabled), inflating the percentage of winning exits while exposing equity to deep open drawdowns.
What is the difference between regular and hidden RSI divergence?
Regular bullish divergence forms when price prints a lower low while RSI prints a higher low, signaling waning downside momentum near a potential reversal. Hidden bullish divergence forms during an uptrend when price prints a higher low while RSI prints a lower low, signaling oscillator reset during a trend continuation pullback.
What Pivot Lookback Right (lbR) setting should I use for RSI divergence?
TradingView's default lbR = 5 waits 5 closed candles after the swing high or low before confirming the pivot. A lower lbR, such as 2 or 3, confirms sooner and a higher one later. We haven't tested which works better: whatever you pick, the signal arrives lbR bars after the swing.