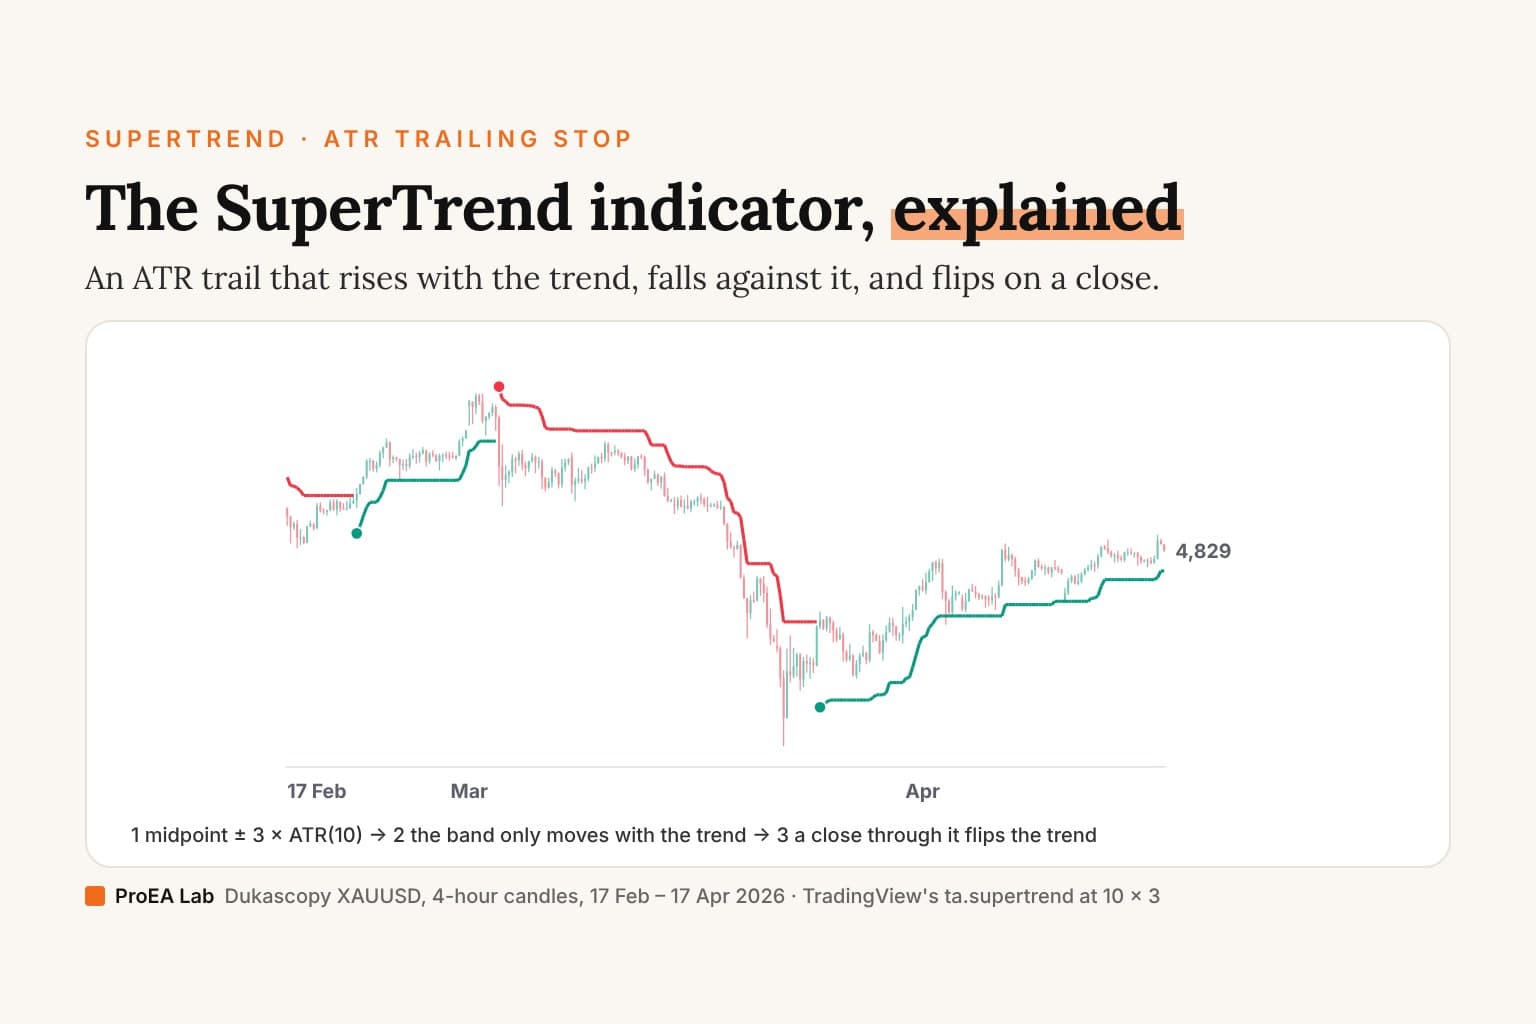
Short answer: SuperTrend is an ATR trailing stop that flips. It sits a multiple of the average true range below the candles in an uptrend and above them in a downtrend, moves only with the trend, and flips when a candle closes through it. The two settings, ATR length and multiplier, decide how often it flips.
Most SuperTrend explanations stop at "green means buy". This one takes the formula apart, shows what the settings change on real candles, and puts SuperTrend next to the other ATR trails it is often confused with.
How SuperTrend is calculated
The most-boosted SuperTrend on TradingView, KivancOzbilgic's (84,344 boosts on 27 October 2026), computes it in five steps (code read on 27 October 2026):
- The ATR. The average true range over 10 candles, Wilder's smoothing by default.
- The middle. Each candle's midpoint, (high + low) / 2.
- Two bands. Lower band = midpoint − 3 × ATR; upper band = midpoint + 3 × ATR.
- The ratchet. While the close stays above it, the lower band can only rise; while the close stays below it, the upper band can only fall. That is what makes it a trailing stop.
- The flip. In an uptrend the line is the lower band; a close below it flips the trend down, and the line becomes the upper band. A close above the upper band flips it back up.
TradingView's built-in ta.supertrend follows the same steps with one difference: it compares the close with the current candle's band, KivancOzbilgic's with the previous candle's, so their flips can land a candle apart. The drill below runs the built-in.
The formula, the three ATR trails, a ten-step checklist and the test's result fit on one page: the SuperTrend and ATR trailing stop cheat sheet (PDF). The defaults, 10 and 3, are where the multiplier and the length start; nothing in the formula makes them best.
An example: two months of gold
SuperTrend 10 × 3: 3 flips in two months.
It sat a median 2.45 × ATR(14) from the close. A wide trail sits through the pullbacks, so it flips only when the trend turns, and gives back more before it does.
Real gold candles (Dukascopy XAUUSD bid, 4-hour candles on UTC boundaries), 17 February to 17 April 2026. SuperTrend is TradingView's ta.supertrend on hl2; the Chandelier Exit uses the highest and lowest close of 22 candles, as the most-boosted open-source Chandelier Exit does. Counting flips shows the mechanics, not which trail is better: no costs and no trades are counted.
The drill shows the trade-off the settings make. With the multiplier at 2, the line sits close to the price and flips on the pullbacks inside a trend: 13 flips in two months. At 3 and 4 it sits through them and flips only when the trend turns: 3 flips each. The cost of a wide trail is the distance: when the trend does turn, it gives back more before it flips.
The settings
- The multiplier sets the distance. A higher multiplier means fewer flips and later exits; a lower one means more flips and earlier exits.
- The ATR length sets how fast the distance adapts. A short ATR follows a sudden burst of volatility quickly, widening the trail; a long one smooths it.
- The time frame sets what counts as a swing. The same 10 × 3 on a 5-minute chart trails 5-minute swings; on a 4-hour chart it trails 4-hour ones.
"Best settings" depend on the market's swings and on what a flip costs you in fees and slippage. Count the flips on your own chart, as the drill does, before you trust any setting.
SuperTrend vs ATR trailing stop vs Chandelier Exit
All three are ATR trailing stops that follow the trend and flip on a close. They differ in where the distance is measured from:
| Trail | Measured from | Common default |
|---|---|---|
| SuperTrend | The current candle's midpoint, (high + low) / 2 | ATR(10) × 3 |
| ATR trailing stop (close-based) | The close | varies by script |
| Chandelier Exit | The highest high (long) or lowest low (short) of the last N candles, or their highest or lowest close | ATR(22) × 3 |
The Chandelier Exit hangs from the trend's extreme, so after a strong run its stop is close to the high; SuperTrend measures from each candle's middle. SuperTrend's bands only tighten while the trend holds; a Chandelier Exit taken straight from its formula is recomputed on every candle and can step back when an old high leaves the window or the ATR widens, while the most-boosted script ratchets it like SuperTrend. On our two gold months the Chandelier Exit at 22 × 3 flipped 8 times, between SuperTrend's 3 at 10 × 3 and 13 at 10 × 2. The Chandelier figures use the close for the extremes, the default of the most-boosted open-source Chandelier Exit on TradingView, everget's (code read on 27 October 2026).
Which open-source scripts draw each of these, and how carefully, is in the best SuperTrend indicators, code-read and the best ATR trailing stop indicators, code-read. The Chandelier Exit's own inputs, ATR Period, the multiplier and the close-or-high switch, are read from its most-boosted script in Chandelier Exit settings. UT Bot Alerts, the most-boosted UT Bot script on TradingView, is a close-based one: it sets its distance as Key Value × ATR, and what each of its settings changes is read from its code.
ATR bands
ATR bands are the same two lines without the ratchet: the price ± a multiple of ATR on every candle. They show how far a typical move reaches; they don't trail and they don't flip. SuperTrend is ATR bands with a memory.
Buy and sell signals, and repainting
A SuperTrend "buy" is the close that flips the line up, a "sell" the close that flips it down. The flip only counts on a closed candle: while a candle is forming, its price can cross the line and come back, so an indicator that judges the live candle can show a flip that is gone at the close. Alerts set to fire once per bar close avoid that. More in how to tell if an indicator repaints.
Using it as a stop, and waiting for the pullback
SuperTrend can be used two ways:
- As direction: trade only long while it is up, only short while it is down.
- As the stop: the line is the trailing stop, and a flip is the exit.
The entry is a separate decision. At a flip the close is beyond the line, sometimes far beyond it, so a stop at the line can be wide. One answer is to wait for a pullback towards the line before entering, which brings the stop closer; Drift Desk Premium has that wait built in.
What the trail leaves to you
SuperTrend gives you a direction and a stop. On every flip, the rest is yours to do:
- The bigger trend. Does the next timeframe up agree? Before a 15-minute flip, read the 1-hour, 4-hour and daily trails.
- The entry. At the flip's close, or on a pullback towards the line? If you wait, for how long?
- The size. Risk ÷ (stop distance × point value), rounded down to your lot step.
- The costs. Commission and slippage on both sides, in R, against a stop that may be narrow.
- The watchlist. A flip on one of 20 charts is easy to miss.
- The management. Where the stop goes at 1R, whether to take half off, and when to trail the rest.
Each is a decision to make the same way every time, which is what a checklist is for: the cheat sheet has one. Drift Desk Premium does all six on the chart, on a SuperTrend-style trail, and sends an alert at the flip, the entry, the half, each stop move and the close; you place the orders.
Does SuperTrend work?
We tested a SuperTrend-style band, Drift Desk's, the written-first way on 20 Binance coins, 4-hour candles, after costs. Both ways, it lost −141.86R over 3,249 positions. A long-only version made +264.37R, but on the untouched coins holding long made more, and it failed its pre-set gate. The full numbers are in the SuperTrend-style backtest.
So a trailing stop is a way to stay with a trend and get out when it turns, not an edge on its own.
Drift Desk: a SuperTrend-style band
Drift Desk draws an ATR band of the same family, with one change: its centre isn't the candle's midpoint but the typical price, (high + low + close) / 3, shifted by a candle-pressure read, at ±2 × ATR(14). It ratchets and flips on a close like SuperTrend. A flip becomes a plan only when its checks pass. Its full Pine v6 source is in Pine Pro Library.
Drift Desk Premium, $49 once, builds on it and does the six jobs above: it reads the bigger trend, waits up to 10 candles for the pullback, sizes the plan to your lot step with fees in R, manages the stop (half off and the stop to entry at 1R, then the Drift trail) and scans 20 symbols with one alert. Premium is a toolset: its signals are not proven to earn more.
Sources
- KivancOzbilgic's SuperTrend and everget's Chandelier Exit: their Pine source on TradingView, read on 27 October 2026.
- The drill:
src/components/blog/supertrend/trail.ts(TradingView'sta.supertrendon the midpoint; the Chandelier Exit on the close's extremes) on Dukascopy XAUUSD 4-hour candles built from the repository's 5-minute gold files. - Drift Desk's band: its Pine source,
drift-desk.pine1.5.0. - A SuperTrend-style trend rule on 20 coins, 27 October 2026.
Disclosure
We, ProEA Lab, build Drift Desk and Drift Desk Premium, and sell them in Pine Pro Library and the Premium Vault. The code is AI-assisted. The drill's candles are real gold prices; it counts flips, not trades or profits. Nothing here is a forecast. Trading involves risk.
Frequently asked questions
What is the SuperTrend indicator?
A trailing line built from the average true range (ATR). In an uptrend it sits a multiple of ATR below the candles' midpoint and only rises; in a downtrend it sits above and only falls. When a candle closes through it, the trend flips and the line jumps to the other side.
What is the SuperTrend formula?
Band = (high + low) / 2 ± multiplier × ATR(length). The lower band can only rise while the close stays above it, the upper band can only fall while the close stays below it, and the trend flips when a close crosses the active band. The most-boosted SuperTrend on TradingView defaults to ATR(10) and a multiplier of 3.
What are the best SuperTrend settings?
There is no best; the multiplier trades flips for give-back. On two months of gold 4-hour candles, SuperTrend at 10 × 2 flipped 13 times, at 10 × 3 and 10 × 4 three times each. A tighter trail flips on pullbacks inside a trend; a wider one waits for the trend to turn and gives back more before it does.
What time frame is best for SuperTrend?
The same rule runs on any chart, but the ATR it reads is the chart's: on a 5-minute chart it trails 5-minute swings, on a 4-hour chart 4-hour ones. Our written-first test of a SuperTrend-style band used 4-hour candles on 20 coins, and even there the short trades were what lost; long only, holding beat it on the untouched coins.
Is SuperTrend reliable? Does it work?
It draws exactly what its formula says, so it is reliable as a trail. As a strategy it is a trend rule: in our test of a SuperTrend-style band on 20 Binance coins after costs, the both-ways rule lost −141.86R over 3,249 positions, and a long-only version made money but less than holding long on the coins never used to build it.
What is an ATR trailing stop?
A stop that sits a multiple of the average true range away from price and usually only moves in the trade's favour (a Chandelier Exit taken straight from its formula can step back). SuperTrend is one, measured from the candle's midpoint; the Chandelier Exit measures from the highest high or lowest low of the last candles (the most-boosted script, everget's, uses the highest or lowest close by default); a close-based trail measures from the close.
SuperTrend vs Chandelier Exit: what's the difference?
Where the distance is measured from. SuperTrend measures from the current candle's midpoint, the Chandelier Exit from the highest point (long) or lowest point (short) of the last 22 candles: the high or low, or the close, which is the default in the most-boosted Chandelier Exit on TradingView. On our two gold months, the Chandelier Exit at 22 × 3 flipped 8 times against SuperTrend's 3 at 10 × 3.
How do you use SuperTrend buy and sell signals?
A buy is a close above the line that flips it up, a sell a close below that flips it down. Act on the closed candle: on the live candle the line can flip and flip back before the close. The flip can serve as the direction and the line as the stop, rather than as an entry by itself.