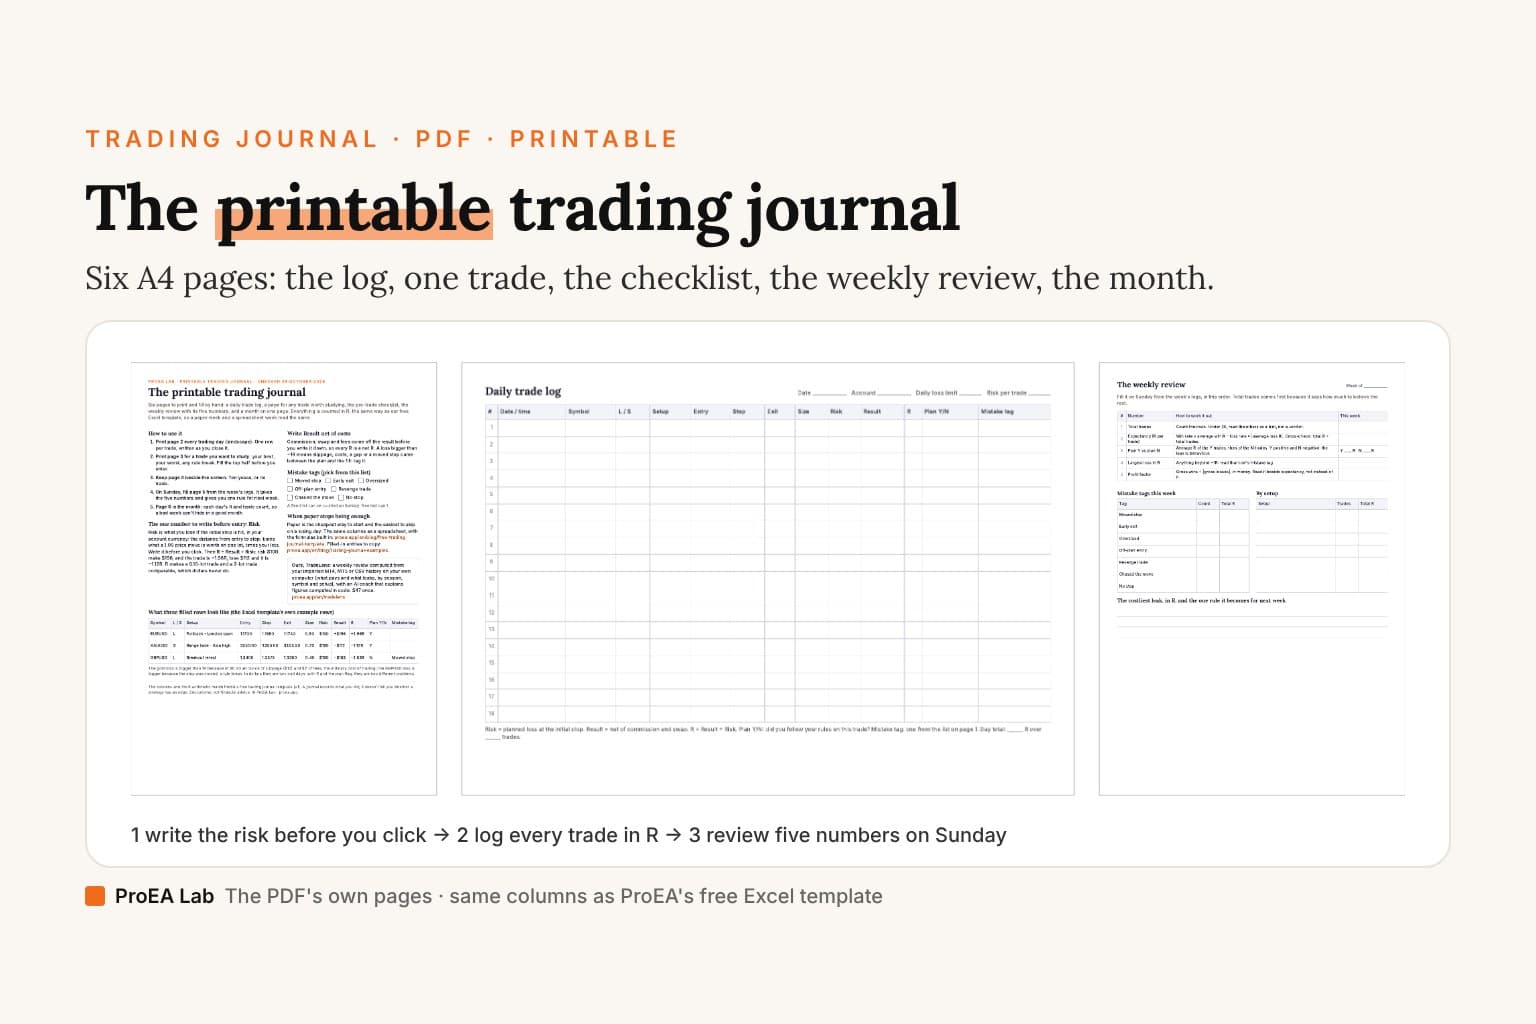
For a cTrader trading journal, use our free trading journal template: download the Excel workbook (.xlsx) or the CSV for Google Sheets. There's no cTrader edition, and it doesn't need one: the template's 18 columns fit a cTrader account as they are, R multiple and Win/Loss are formulas, and the Summary sheet computes expectancy, profit factor and the plan-followed split. Below: how cTrader saves your history, which of its columns go where, and the one number you add yourself.
cTrader records what happened. Your journal needs one number it can't record: what you planned to lose.How do I export my trade history from cTrader?
From the History tab, with the Statement button. cTrader's help pages, read 29 October 2026, describe the tab: "After being closed, all positions end up in the History tab of Trade Watch panel. This tab holds the complete history of all deals that have filled or attempted to fill your orders." The steps, in their words:
- Open it. "The trading history can be seen by selecting the History tab in Trade Watch at the bottom of cTrader."
- Pick the period. "use the fields above to filter by standard or custom periods."
- Show the columns you need. "Not all the table columns are enabled by default. Right-click any column to select which columns to show or hide."
- Save the statement. The Statement button sits "in the upper right of the History tab". "Click Statement to open either an HTML or .xlsx account statement in a new tab. On the statement page, click Save to save it locally as an Excel spreadsheet in .csv format."
- For your stops, Order history. "Click Order history to open the list of all orders created, including stop-loss and take-profit orders."
The help pages don't split these steps by desktop and web, and they don't say which columns the saved statement holds. The column names below are the on-screen History table's, so check them against your own file.
How do cTrader's columns map to the template?
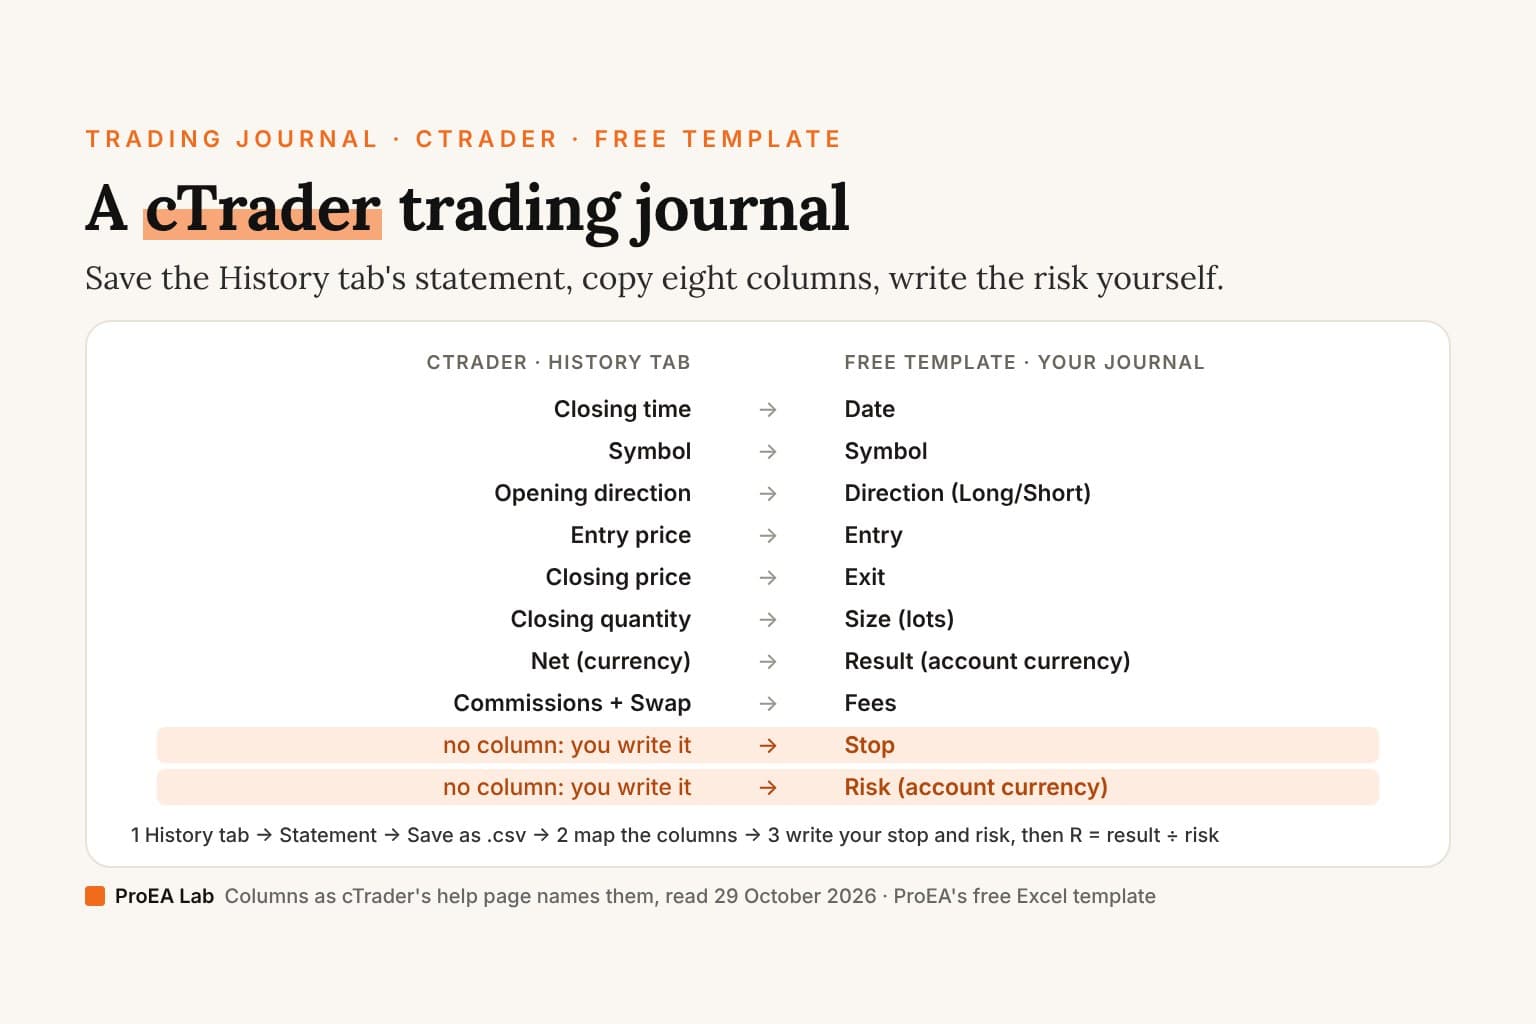
Seven of the template's columns come straight from cTrader's, and Fees from two more. The rest are yours:
| Template column | From cTrader's History table |
|---|---|
| Date | Closing time (the day) |
| Symbol | Symbol |
| Direction (Long/Short) | Opening direction: a buy opens a long and a sell a short; check how your file writes it |
| Setup / reason | Not in it. One name from your setup menu |
| Entry | Entry price |
| Stop | Not in it. Your initial stop; Order history lists stop-loss orders |
| Target | Not in it. Order history lists take-profit orders |
| Exit | Closing price |
| Size (lots) | Closing quantity |
| Risk (account currency) | Not in it. Work it out, below |
| Result (account currency) | Net (currency) |
| R multiple, Win/Loss | Formulas: leave them |
| Fees | Commissions plus Swap, as a positive cost |
| Followed plan? (Y/N), Mistake tag | Yours |
| Notes | The ID, so you can find the deal again, and one line |
| Screenshot link | Yours |
Four checks before you copy:
- Check Net on one trade. The help page lists "Gross (currency)", "Net (currency)", "Swap" and "Commissions" without defining them. The template's Result is net of commission and swap, so confirm by hand that Gross, after Commissions and Swap, gives Net on your statement.
- Pick one currency. The table has "Gross (USD)" and "Net (USD)" beside the "(currency)" pair. Use the pair in your account's currency, the one your Risk is in.
- Check the size unit. The help page doesn't give Closing quantity's unit. The template's column is lots; if your file shows another unit, convert it.
- One trade, one row. If a position you closed in parts shows on more than one row, add their results into one.
The other columns (Order ID, Opening time, Closing direction, Closing volume (currency), Requested quantity, Pips, Label, Comment, Balance (currency) and Channel) aren't needed. If Label or Comment holds your setup name, copy it across.
How do I add the risk cTrader doesn't record?
Work it out from your initial stop: the stop distance, times what that distance is worth on one lot, times your lots. None of the History table's columns is a stop or a planned risk, and R can't be computed without one.
The template's first example row is a EURUSD long: entry 1.1700, stop 1.1680, 0.50 lots. That's a 20-pip stop. With a 100,000-unit lot in a USD account, a pip is worth $10 a lot, so the risk is 20 × $10 × 0.50 = $100. It closed at the 1.1740 target for +$196 after $4 of fees: 196 ÷ 100 = +1.96R. Check your broker's contract size for each symbol before you rely on the $10. The forex position size calculator and the pip value calculator do the pip arithmetic for any pair, and the XAUUSD lot size calculator sizes gold from the same stop.
Write the risk on the day you trade. Order history can remind you where the stop was, but the risk is a decision made before entry, and weeks later it's a guess. If you moved the stop, keep the first one: the loss then shows up as worse than −1R, which is what the sheet should catch.
What should I review each week?
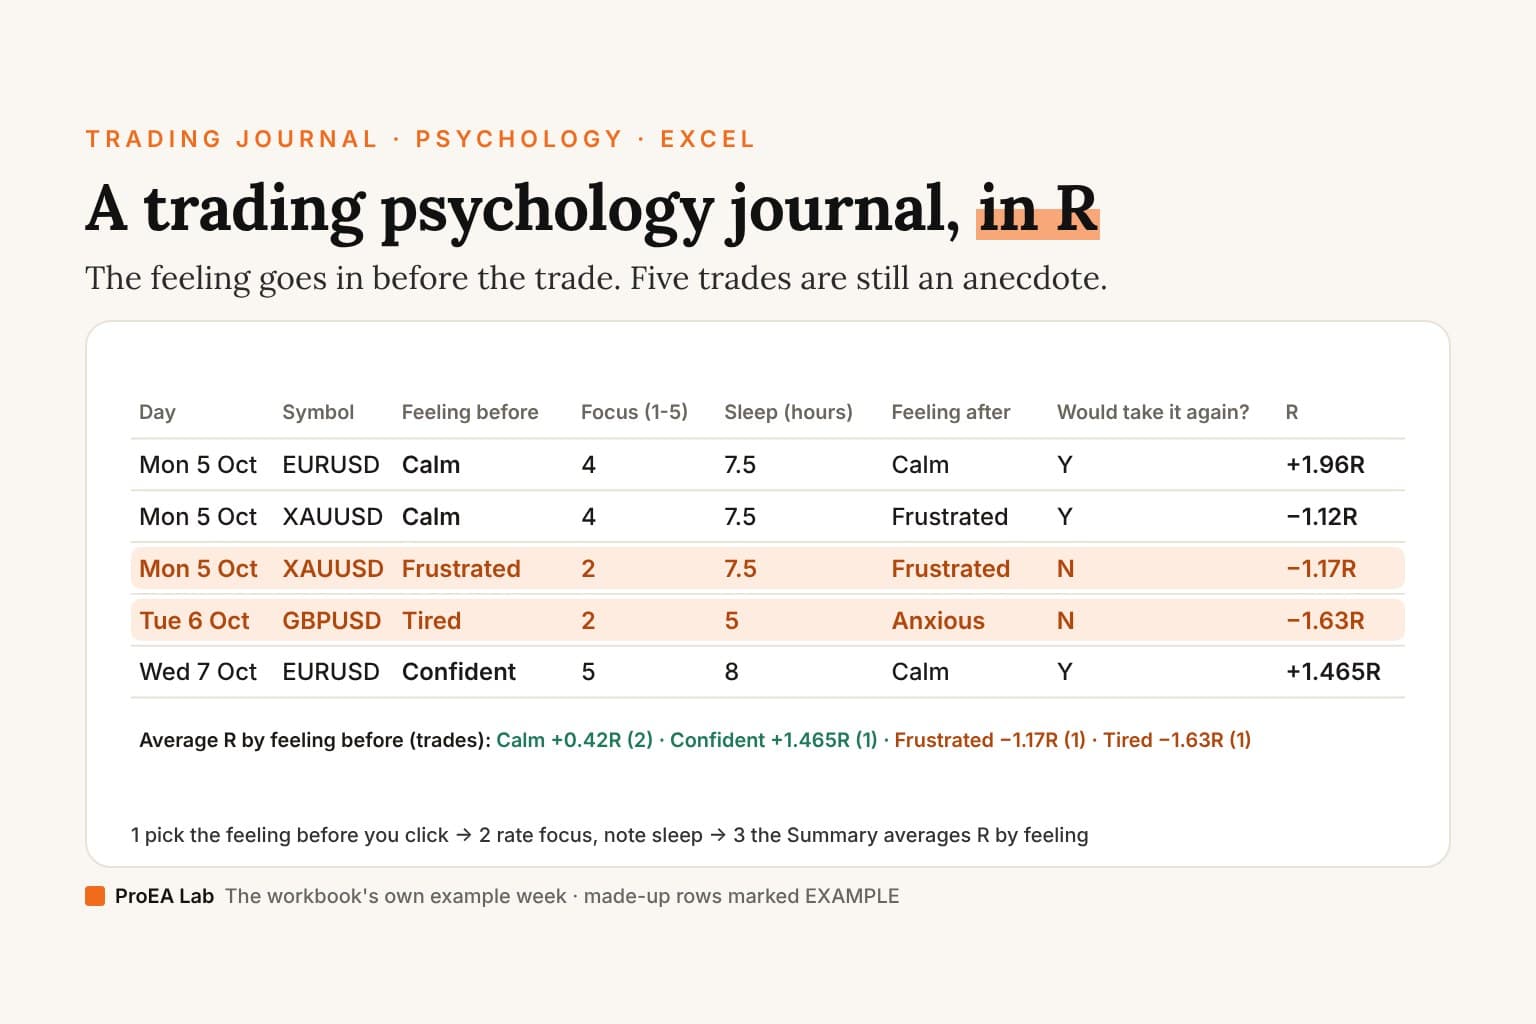
Five numbers, and the Summary sheet computes them: total trades, expectancy in R, the average R of plan-followed against plan-broken trades, the largest loss in R, and profit factor. On the template's three example rows that's 3 trades, −0.26R expectancy, +0.42R against −1.63R, a largest loss of −1.63R and a profit factor of 0.71. Three trades prove nothing about a method; the plan split already shows the one rule break cost more than the two planned trades made. Six filled-in trading journal examples show how to read them, and the printable trading journal has the same review on paper.
The deep version, as a PDF
The Trading Journal Playbook
What to write on every trade and why, filled-in entries across markets, the pre-trade checklist, the weekly and monthly review with the arithmetic shown, and the same columns on paper, in a spreadsheet or an app.
- What to write on every trade, and why each of the template's eighteen columns exists, in the order you fill them
- 13 filled-in entries across forex, gold, an index CFD, a partial close, a prop-firm evaluation day, a skipped trade and a backtest, every Risk, Result and R worked from the prices
- The pre-trade checklist, and how a month of mistake tags turns into checks of your own
Opens soon · USD 19, one payment. See what's inside →
Is there a cTrader journal app?
Ours, TradeLens, has a cTrader starter. Its import step reads: "A broker CSV goes through a column-mapping wizard", and the download includes "Pre-mapped CSV starters for MT4 / MT5 / cTrader / TradingView / generic." cTrader's help doesn't list the saved statement's columns, so check the starter's mapping against your own file in the wizard before you import. TradeLens is a $47 download (launch price; $79 regular) that runs on your own computer: Python, a browser UI and one SQLite file. Its AI coach runs on a free local model or your own Claude, OpenAI or Gemini key, and the figures it explains are computed in code. The TradeLens guide walks through the import step.
Elsewhere, FX Blue's FAQ (read 29 October 2026) says: "You can upload your trading history from MT4, MT5, cTrader, Oanda fxTrade, XOpenHub, Vertex FX, or FXCM TS2." Our trading journal comparison prices the subscription journals side by side. Whichever you pick, write the planned risk yourself: cTrader's History table has no column for it.
Frequently asked questions
How do I export my trade history from cTrader?
Open the History tab of the Trade Watch panel at the bottom of cTrader and click Statement. The statement opens as HTML or .xlsx in a new tab, and Save on that page keeps it as a spreadsheet in .csv format, according to cTrader's help pages read on 29 October 2026.
Is there a free cTrader trading journal?
Yes: our free trading journal template for Excel and Google Sheets. It has 18 columns, works out R and Win/Loss by formula, and its Summary computes expectancy, profit factor and the plan-followed split. There is no cTrader edition because its columns fit a cTrader account as they are.
Does cTrader's history show my stop loss?
Not in the History table's columns. Order history lists the orders created, including stop-loss and take-profit orders, which can remind you where the stop was. The risk you planned at entry is still yours to write in the journal.
How do I calculate R for a cTrader trade?
Divide the net result by the risk you planned. A EURUSD long with a 20-pip stop on 0.50 lots risks 20 × $10 × 0.50 = $100 with a 100,000-unit lot in a USD account. Closed for +$196 net, it's +1.96R.
Which cTrader column is the net result?
Net (currency), as the History table names it. The help page lists the columns without defining them, so check one trade by hand first: Gross (currency), after Commissions and Swap, should give Net (currency) on your own statement.
Can a journal app import cTrader trades?
TradeLens takes a broker CSV through a column-mapping wizard and ships a pre-mapped starter for cTrader. FX Blue's FAQ lists cTrader among the platforms whose history you can upload. Whichever you use, check the mapping against your own file first.