Short answer: TradingView has no trading journal. It saves your Paper Trading or broker orders and closed positions in the Trading Panel under the chart, and "Download data" exports each tab as a CSV; no TradingView page we read ties that to a plan. Portfolios can import that history as a transaction log, up to 2,000 transactions on the free Basic plan and 5,000 on the paid ones. A strategy's list of trades exports as CSV on Essential and up, and Bar Replay trades aren't saved after the session. To journal your TradingView trades, draw them on the chart with a script, log them in a spreadsheet or a PDF, or import the CSV into a journal app.
Everything below was read on 29 October 2026: TradingView's Help Center, its blog and its pricing page, and the code of the journal scripts in its script search the same day.
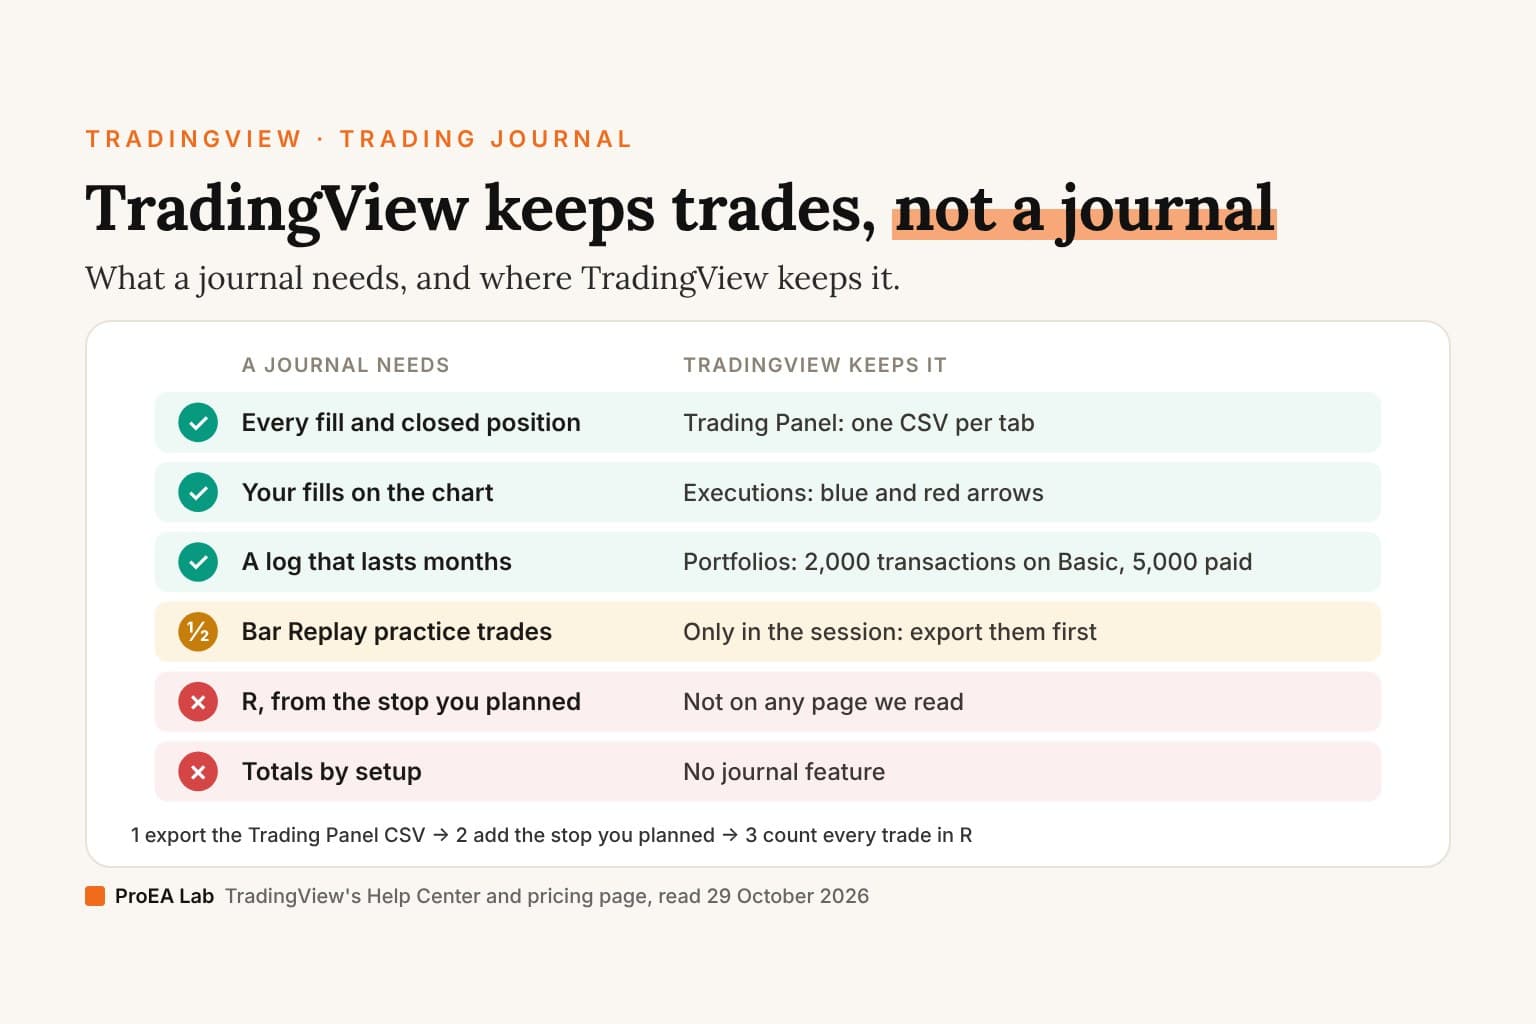
| What a journal needs | Where TradingView keeps it |
|---|---|
| Every fill and closed position | The Trading Panel, one CSV per tab |
| Your fills on the chart | Executions, as blue and red arrows |
| A log that lasts months | Portfolios: 2,000 transactions on Basic, 5,000 on paid plans |
| Bar Replay practice trades | Only in the session: export them before you leave |
| R, from the stop you planned | Not on any page we read |
| Totals by setup: win rate, expectancy | No journal feature |
What does TradingView save about your trades?
Your orders and closed positions, in the Trading Panel; a transaction log, in Portfolios; your fills, on the chart; and a strategy's or a replay session's list of trades. Each exports differently, and some depend on your plan:
| What | Where | Export | Plans (pricing table, 29 Oct 2026) |
|---|---|---|---|
| Trading Panel history, for Paper Trading or a connected broker | The panel under the chart, after Trade and a broker | CSV, one tab or all tabs ("Download data") | No plan named on any page we read; paper trading and trading through brokers are ticked on all five plans |
| Executions on the chart | Chart settings, Trading tab | None; chart snapshots can show them | Not tied to a plan on any page we read |
| Portfolios | Products → Portfolios | CSV of all transactions | Basic 1 portfolio, 20 holdings, 2,000 transactions; Essential 3, 50, 5,000; Plus 4, 75, 5,000; Premium 5, 100, 5,000; Ultimate 7, 150, 5,000 |
| A strategy's List of trades (simulated) | The strategy report | Trades as CSV, the report as XLSX | Essential, Plus, Premium and Ultimate; not Basic |
| Replay Trading (Bar Replay) | The Replay Trading panel | Performance and List of trades | "Trading in Bar Replay": all five plans |
| Text notes | Alt/Option + N, or the details widget | None stated | None stated |
| Private ideas | Publish, then Private | None stated | Basic can post private ideas; public ones need a paid plan |
Basic is the free plan ($0). The paid plans were Essential, Plus, Premium and Ultimate that day.
The Trading Panel, and its CSV
Connect Paper Trading or a broker with the Trade button and the account manager opens at the bottom of the chart: "the place where you can track your orders and positions", in TradingView's words. Clicking the broker's name lets you "Export your trading data as a CSV file". For Paper Trading, its help describes these tabs (it notes that the columns are "different for each broker"):
- Positions and Orders: what's open now.
- History: "all your filled, rejected, and canceled orders, as well as used margin, placement and closing times, and more".
- Account history: "your closed positions, with their entry and close prices, realized PnL, and more".
- Trading journal: "textual information about your orders and their times". It's a log of orders, not a journal you write in.
The tab names move. The help text says History, Account history and Trading journal; a screenshot uploaded in June 2026 shows Order history, Balance history and Trading journal; one from August 2026 shows Order history, Balance history and Activity log.
To export: click Download data. The dialog reads "Select a trading tab to export. It'll be saved to a CSV file", with All tabs, Positions, Orders, Order history, Balance history, Activity log in the dropdown. "The information from each tab is exported individually." TradingView's 2022 blog post on the feature calls it "Export data…" in the broker's dropdown menu. None of the pages names a plan for it, and the pricing table has no row for exporting trading data.
Download before you reset Paper Trading. "Resetting the account will delete the transaction history, active orders, and open positions." Our TradingView paper trading guide has the clicks.
One gap matters for any journal: the CSV's exact column headers aren't shown on any TradingView page we read. Open your own export before you build anything on it.
Portfolios: TradingView's own transaction log
TradingView's pitch for Portfolios is the closest it comes to a journal: "Tired of hand-writing your trades? To free up your time, we've designed Portfolios — your analytical hub to evaluate your trading and investment strategies." You can import a CSV or XLSX, add symbols by hand, or start from a watchlist.
- From the Trading Panel: "Click Export Data and select the History section to download a file with your trading history." Then import it. "Only trades with the field Status set to Filled will be added to the portfolio."
- The import format: "Only one format is supported. The file must be in CSV format with a comma as the delimiter. A header is required." The fields are Symbol, Side, Qty, Status (optional), Fill Price (optional), Commission and Closing Time, "in the format YYYY-MM-DD hh:mm:ss or YYYY-MM-DDTHH:mm:ss.sssZ". The file can be up to 25 MB, and a trade that matches an existing one on all six fields isn't added twice.
- From Paper Trading, since a May 2026 update, in one go: "This works like a CSV import — it’s not a live sync. New trades you make on a paper trading account after the import won’t appear automatically."
- What you get: a Transactions page with "paid commissions, and cash deposits or withdrawals", a "Notes" column per transaction, a CSV download of all transactions, and risk metrics such as Beta and the Sharpe and Sortino ratios.
| Basic | Essential | Plus | Premium | Ultimate | |
|---|---|---|---|---|---|
| Number of portfolios | 1 | 3 | 4 | 5 | 7 |
| Holdings per portfolio | 20 | 50 | 75 | 100 | 150 |
| Transactions per portfolio | 2,000 | 5,000 | 5,000 | 5,000 | 5,000 |
Two of TradingView's own pages disagree with that table or with each other. The Portfolios article says "Currently, you can create up to three portfolios". And past the limit, its blog says "we’ll create the portfolio within your limits only", while its Help Center says "the portfolio will not be created."
Portfolios is a transaction log with portfolio analytics. Nothing on the pages we read mentions a stop, a setup or R.
Your executions on the chart
Open the chart settings (the gear on the top toolbar or at the bottom of the chart), then the Trading tab. "Executions are displayed as red arrows for executed sell orders and as blue arrows for executed buys", and execution labels add the price; TradingView's screenshot shows "9 @ 110259.60" (quantity @ price). Its "Execution history on the chart" page says the overlay helps you "visually correlate entry and exit points with market movements".
For a screenshot journal, turn on Orders, executions and positions in screenshots: then a chart snapshot keeps your trades on the picture. TradingView notes it "does not affect regular screenshots or printing from your browser."
Bar Replay and strategy trades
Bar Replay trades vanish when the session ends. "Data on trades and the overall result are available only in the session itself, and they are not saved anywhere." The Replay Trading panel's "Performance and List of trades can also be exported for further analysis or record-keeping", so export them before you leave. Trading in Bar Replay is on all five plans. More in our TradingView Bar Replay guide.
A strategy's trades are simulated. "TradingView uses a broker emulator to simulate trades while running a strategy script." Its List of trades counts "a pair of orders: an entry order and an exit order" as a trade. "Export trades in CSV" and "Export report in XLSX" are ticked on Essential, Plus, Premium and Ultimate, not on Basic.
Notes and private ideas
- Text notes: Alt/Option + N, or the Add note button in the details widget. All notes lists every symbol that has one, and symbols with notes get an icon in the watchlist. Notes belong to a symbol, not to a trade.
- The Note drawing tool pins a comment to a price level on the chart.
- Private ideas: a free Basic account can post them. They aren't in your profile, the Ideas Stream or search, they open by direct link, and you can edit them any time. Ideas on a timeframe under 15 minutes can only be published privately or sent in chat.
No page we read gives a limit on the number of notes or private ideas.
What TradingView says about a journal
TradingView's own published idea "Crafting the Perfect 2025 Trading Journal" (7 January 2025, Editors' picks) lists the columns it suggests, from "Your entry / Your exit / Your stop loss (yes, add that, too)" to "Your risk/reward ratio", "Your state of mind" and "Transaction costs", and then says: "So grab a pen and list (or go to an online graphic design platform) and get creative!" One reader answered under it: "rather than suggesting it make it happen TV!! add journal to the right side that integrates fast with long - short position tool". A search of tradingview.com for "tradingview journal" returned community scripts and ideas, and no Help Center or blog page describing a journal feature.
Which TradingView journal scripts are worth adding?
For many trades, Trade Coach-Journal; for one trade drawn precisely, Ultra Trade Journal. Neither reads your account, and neither measures a list of trades from their stops. We searched TradingView's scripts on 29 October 2026 for eight terms (trading journal, trade journal, trade log, trading log, trade tracker, pnl tracker, trading diary and journal): 48 scripts, 25 with open code. Eight of the open ones are journals, and we read each in full. Boosts as the search showed them that day.
| Script | Boosts | You enter | It draws or counts | Trades it holds |
|---|---|---|---|---|
| Sticky Notes, Checklist, To-do, Journal [algoat] | 2,362 | Six notes: a title, a text box, a done tick, a due date | A table of the notes, with "days left" or "Overdue!" | None: no trade fields |
| Ultra Trade Journal (Rathack) | 654 | Entry and exit, price and time, clicked on the chart; a stop; up to four targets | Entry, stop and target lines and fills; a table of RR, ticks and price per level | One per copy of the indicator |
| [TT$] Trade Tracker - By BlueJayBird | 411 | Entry time and price, a target, stop and break-even as a %, a fee % | Lines and boxes from the entry to the last bar; a label with the levels and the last close | One open trade, no exit |
| Trade Coach-Journal (TheRealDrip2Rip) | 152 | A text box, one trade per line: date, time, L or S, entry, an optional exit time, exit, #tags | Entry marks, entry-to-exit lines, R labels; a coach panel with win rates, today's R and totals by tag | As many lines as the box holds; draws the last 120 by default, 300 at most |
| TradeTracker v33 - Interactive Journal [AR33_] | 150 | The same six notes as algoat's | The same table | None |
| Trade Journal Pro (CreativeAdvance) | 49 | Counts: wins, losses, breakevens, risk-rule breaks, losses in a row; limits; prompts | One label: the counts, a win rate, limit breaches, prompts and advice; 5 alerts | None: counts only |
| MohdTZ Trade Journal Dashboard | 5 | Counts of trades, wins, losses, breakevens and open trades; a starting balance, risk per trade, an R:R | A table: each outcome's share, gross and net P&L, balance, ROI | None: counts only |
| FlowScope Journal Capture Overlay (craftyshafter) | 5 | Direction, setup, mistake, entry, stop, target, grade, a short note | A journal card with the levels and the planned R; entry, stop and target lines | One |
| Trade Log in R [ProEA] (ours, below) | – | A text box, one trade per line: entry time, side, entry, stop, exit, tag | A box from entry to exit, the stop as a dashed line, an R label; a table of totals and the top 5 tags | 500 trade lines |
None of the eight reads your trades. Across all 25 open-source files, the only strategy. references are in one script that is itself a strategy and in one tooltip. Every journal takes its trades from its own inputs and uses only chart prices otherwise.
Trade Coach-Journal is the most useful free one, for a log of many trades. One text box holds the log, "spaces or commas, both fine", one trade per line, such as 8/17 9:45 L 29048 10:15 29096.5 #plan; it reads L, S, LONG, SHORT, BUY and SELL, and the exit time is optional. It draws an entry mark, an entry-to-exit line and an R label for each trade, placed by time, the last 120 by default and up to 300. Its coach panel shows a status ("KEEP LOGGING" until 20 trades), win rates by morning and afternoon, the last 10 trades, an equity sparkline, today's R and totals by tag, with up to 12 tags and three alerts. Read its R with care: it isn't measured from your stop. It's the price move divided by the previous bar's ATR(14) on the chart's timeframe (r = (ex - en) * sd / aRef, with aRef = atr[1]), so the same trade reads a different R on a 5-minute chart and an hourly one. It has no stop, size or fee field, and no symbol field: every line lands on whatever chart is open, in the symbol's exchange timezone. Trades on the first 220 bars of the loaded history are skipped and reported. Its "TOP FIX" advice, such as "stop taking" a tag's entries, waits for 15 trades per pattern and 8 per tag by default. A "MODEL" section trains a small neural network (8 inputs, 5 hidden units) on your trades and compares it with a copy trained on shuffled labels, and shows a result only past a z-score threshold and a minimum number of test trades.
Ultra Trade Journal draws one trade precisely. You click the entry and the exit on the chart, then set a stop, a main target and up to three more; "Live Position" sets the exit to the current bar. The direction comes from the target being above or below the entry. Its table shows RR (the target's ticks over the stop's), ticks and price for each target, an SL row, and a POS row with the entry, the result in ticks and the exit. The result ticks have no sign: a loss and a win of the same size read the same, and only the fill colour tells them apart. One trade per copy; a second trade needs a second copy of the indicator.
Sticky Notes, Checklist, To-do, Journal is the most boosted (2,362), and it holds notes, not trades. Six notes, each with a title, a text box, a done tick and an optional due date that turns into "days left" or "Overdue!". TradeTracker v33 is the same code: a line-by-line diff shows only the title, the defaults and the dates changed, and it was published on 8 September 2024, after algoat's of 12 July 2024.
[TT$] Trade Tracker tracks one open trade. It has no exit input, so the trade runs to the last bar. Its "💱 Fee (%)" is printed in the label and used in no calculation, and the move from entry is shown without a sign.
Trade Journal Pro and MohdTZ Trade Journal Dashboard count; they don't log. In Trade Journal Pro you update the wins, losses and breakevens by hand, and its "Trades Today" is the running total, with no daily reset. MohdTZ values every win at your fixed R:R and every loss at your full risk, so its P&L is arithmetic on counts, not on your trades.
FlowScope Journal Capture Overlay is a one-trade plan card. It shows the planned R, |target − entry| over |entry − stop|, with no exit or result field. Its "Short Note" input is declared and never shown, and "Show FlowScope OCR Card" suggests the card is meant to be read from a screenshot by a separate FlowScope tool; the code itself sends nothing anywhere.
Ten more journal-type scripts in the search keep their code hidden (TradeChartist Tracker Lite has the most boosts of them, 417), so we can't say what they do. The trackers in the same search, led by Portfolio PnL Tracker (256 boosts), follow open positions or a single trade, not a log of closed trades.
What none of the open-source scripts does:
- take your own fills: every trade is typed;
- hold many trades with a stop for each, so none measures a list of trades in R from their stops;
- filter a multi-trade log by symbol;
- pair entry and exit fills into round trips, or group scale-ins;
- show a free-text note for each trade in a multi-trade log.
Our free script: Trade Log in R
Trade Log in R [ProEA] draws the trades you type on the chart, measures each one from its own stop, and totals them in a table. We wrote it for the second gap above. It's an open-source indicator in Pine v6, under the Mozilla Public License 2.0, and it compiled on TradingView's compiler on 29 October 2026 with no errors and no warnings. We're publishing it on TradingView under that name; until it shows in the script search, copy the code from this text file into the Pine Editor, save it and add it to the chart.
It reads only what you type. It doesn't connect to a broker, to Paper Trading or to your TradingView account, and it can't see your fills. It has no symbol field, so paste only the chart symbol's trades.
What you type goes in the "Trades, one per line" box, one trade per line, the fields separated by commas:
entry time, side, entry, stop, exit, tag
2026-10-01 08:15, long, 1.1700, 1.1680, 1.1740, london break
- Entry time: YYYY-MM-DD HH:MM, seconds optional, a T between the date and the time allowed, in the clock you pick in "Timezone of your times" (Exchange, the symbol's own, by default).
- Side: long or short; L, S, buy and sell are read too.
- Entry, stop, exit: prices with a decimal point and no thousands separators.
- Tag: optional, free text. Tags are grouped without regard to case.
- A tab or a semicolon counts as a comma, so rows copied from a spreadsheet work. Blank lines and lines that start with # or // are ignored. Any other line that doesn't read is counted as a line skipped. The first 500 trade lines are read; lines after them are counted, not read. The box itself holds up to 40,960 characters, Pine's limit for a text input.
The R of each trade:
- long: (exit − entry) ÷ (entry − stop);
- short: (entry − exit) ÷ (stop − entry);
- then "Cost per trade, in R" (0 by default) is subtracted: 0.05 takes 5% of the risk off every trade for spread and commission.
A stop on the wrong side of the entry, or at the entry, gives no R: the trade gets a grey "no R" label and stays out of the totals, and the table counts it.
What it draws: at each trade's entry time, a box from the entry price to the exit price, green above 0R and red below; the stop as a short dashed line; and a label at the box's right end with the R, whose tooltip holds the date, side, tag and prices. The lines have no exit time, so "Box width, in bars" (8 by default) sets how far right each trade reaches. Trades dated outside the chart's loaded bars are counted in the table and not drawn.
The table: trades, wins, losses (and trades at 0R, when there are any), win rate, average win, average loss, expectancy (win rate × average win − loss rate × |average loss|), the check total R ÷ trades beside it, total R, the largest loss, and totals for the 5 tags with the most trades. Below them, the counts of lines skipped, stops on the wrong side, stops at the entry, lines over the cap and trades outside the chart.
A worked example. Paste these made-up EURUSD trades (not anyone's account):
# entry time, side, entry, stop, exit, tag
2026-10-01 08:15, long, 1.1700, 1.1680, 1.1740, london break
2026-10-02 14:30, short, 1.1725, 1.1745, 1.1745, ny reversal
2026-10-05 08:40, long, 1.1690, 1.1675, 1.1705, London break
2026-10-06 09:05, short, 1.1712, 1.1730, 1.1676, london break
2026-10-07 15:10, long, 1.1660, 1.1645, 1.1640, ny reversal
2026-10-08 08:20, long, 1.1655, 1.1640, 1.1655
2026-10-09 08:30, long, 1.1650, 1.1665, 1.1690, london break
2026-10-09 buy 1.1650
The first trade is long from 1.1700 with its stop at 1.1680 and its exit at 1.1740: (1.1740 − 1.1700) ÷ (1.1700 − 1.1680) = 0.0040 ÷ 0.0020 = +2.00R. The others, in order, read −1.00R, +1.00R, +2.00R, −1.33R and 0.00R. The −1.33R is a loss past the stop: the long from 1.1660 exited at 1.1640, 0.0020 below the entry on 0.0015 of risk. The 9 October long has its stop above its entry, so it gets no R; the last line has no commas, so it's skipped.
| Row | Reads |
|---|---|
| Trades | 6 |
| Wins, losses, at 0R | 3, 2, 1 |
| Win rate | 50.0% |
| Average win, average loss | +1.67R, −1.17R |
| Expectancy | +0.44R |
| Check: total R ÷ trades | +0.44R |
| Total R | +2.67R |
| Largest loss | −1.33R |
| By tag | london break (3) +5.00R; ny reversal (2) −2.33R; (no tag) (1) 0.00R |
| Below | 1 line skipped; 1 with the stop on the wrong side |
With "Cost per trade, in R" at 0.05, each trade gives up 0.05R: the 0R trade becomes a loss of 0.05R, and the total falls by 0.30R to +2.37R.
What it leaves out: no size, money or fees beyond the cost in R; one line is one round trip, so partial exits and scale-ins need one line each or an average; no exit time; no alerts. The numbers describe the lines you typed. They don't say what the next trades will do.
How do you journal TradingView trades in a spreadsheet, a PDF or an app?
Export, pair, add the stop, count in R. Whatever holds the journal, the steps are the same:
- Export the Trading Panel's order history with Download data, the Replay Trading panel's List of trades before the session ends, or a strategy's trades CSV (Essential and up).
- Pair the fills into trades: an entry and its exit make one round trip.
- Add what TradingView doesn't keep: the stop you planned at entry, the setup, whether you followed your plan, and one line of lesson.
- Count in R, and review the totals by setup once a week.
A spreadsheet
Our free trading journal template, for Excel and Google Sheets, computes R, expectancy and the plan-followed split from the columns you fill. Paste your exported fills beside it, pair them, and type the stop. Trading journal examples shows what filled-in entries look like.
A PDF
The printable trading journal is six A4 pages, with a daily log, a page for one trade and a weekly review, counted in R. Download the PDF. It suits a few trades a day, logged by hand beside the chart.
A journal app
An app imports the CSV, so no day goes missing, and computes the totals for you. TradeLens is ours: a $47 one-time download, a local Python app that imports MT4, MT5 and CSV files, with a starter CSV template for TradingView exports in its column-mapping import. Because TradingView doesn't publish the Trading Panel CSV's columns, check the mapping against your own file the first time. It has no phone app and no free plan. Its AI coach explains figures computed in code; our AI trading journal guide covers why that matters.
The subscription journals: our notes on TraderSync (its own pages, last read on 3 October 2026) and Tradervue (read on 29 October 2026) don't mention TradingView, so we can't say whether either takes its exports. TraderSync connects directly to brokers with a tick in the Autosync column of its supported-broker list, takes a CSV from the rest, and its forex page says "Automatically sync your forex trades from top brokers like OANDA, TradeLocker, and Metatrader 4/5". Tradervue lists MetaTrader 4 and MetaTrader 5, imports MT5 trades from the History report saved as an HTML file, and has Broker Sync on both paid plans. If you trade through a broker, check its name on their lists, not TradingView's.
| You trade | Journal it with |
|---|---|
| A few trades a week, and want them on the chart | The script: type them in |
| Paper Trading or a broker connected to TradingView | Download data, then a spreadsheet or an app |
| Bar Replay practice | Export the List of trades before the session ends |
| MT4 or MT5, with TradingView for charts | An app that imports MetaTrader history directly |
Limits
One read, on 29 October 2026, of TradingView's pages and of the versions of the scripts TradingView served that day; TradingView changes its panels, tab names and plans, and scripts change. Boosts measure popularity, not quality. We build and sell TradeLens, we wrote Trade Log in R, and we have no relationship with any script author named here. Nothing here is financial advice.
Frequently asked questions
Does TradingView have a trading journal?
No. TradingView has no journal feature, and none of its help pages we read describes one. It keeps your orders and closed positions in the Trading Panel under the chart, exportable as CSV, and Portfolios can import that history as a transaction log. The Paper Trading panel has had a tab called Trading journal, but it lists your orders and their times; a screenshot from August 2026 shows an Activity log tab in its place.
How do I see my trade history on TradingView?
Connect Paper Trading or a broker with the Trade button, and the account manager opens under the chart. Its order history tab lists filled, rejected and canceled orders; its account or balance history lists closed positions with their entry and close prices and realized PnL. To see your fills on the chart, open the chart settings, Trading tab, and turn on Executions: buys show as blue arrows and sells as red ones.
How do I export my trades from TradingView?
In the Trading Panel, click Download data (earlier, Export data in the broker's menu), pick one tab or All tabs, and each tab is saved as its own CSV. No TradingView page we read ties this to a plan. A strategy's list of trades exports as CSV on Essential and above, not on the free Basic plan. Bar Replay trades aren't saved after the session, but the Replay Trading panel can export its Performance and List of trades first.
Is there a free trading journal on TradingView?
Not built in, but free community scripts draw trades you type. Trade Coach-Journal holds many trades in one text box and totals them by tag, Ultra Trade Journal draws one trade per copy with its stop and targets, and our Trade Log in R measures each typed trade from its own stop and totals them. None of them reads your account: you type or paste every trade.
Can a TradingView script read my trades?
Not any script we read. None of the 25 open-source scripts in our search reads a Paper Trading or broker account; the journals among them take their trades from what you type into their settings. TradingView's strategy scripts trade simulated orders through a broker emulator that, by default, fills them using only the chart's data. To get your real fills out, export the Trading Panel's CSV.
How do I measure my TradingView trades in R?
Divide each trade's result by its risk, the distance from entry to stop. A long at 1.1700 with its stop at 1.1680 that exits at 1.1740 moved 0.0040 on 0.0020 of risk, so it made +2.00R before costs. A short is the same with the signs turned: entry minus exit, over stop minus entry. Our free script does this on the chart for the trades you type, and our free spreadsheet template does it in a column.
Does TraderSync work with TradingView?
Our notes on TraderSync's own pages, read on 3 October 2026, don't mention TradingView, so we can't say either way. What they do say: brokers with a tick in the Autosync column of its supported-broker list connect directly, others upload their trades by CSV, and its forex page says "Automatically sync your forex trades from top brokers like OANDA, TradeLocker, and Metatrader 4/5". Check that list for your broker.
Does Tradervue work with TradingView?
Our notes on Tradervue's pricing and platforms pages, read on 29 October 2026, record nothing about TradingView, so we can't say either way. They list MetaTrader 4 and MetaTrader 5, with MT5 trades imported by saving the History report as an HTML file and uploading it, and Broker Sync on both paid plans.