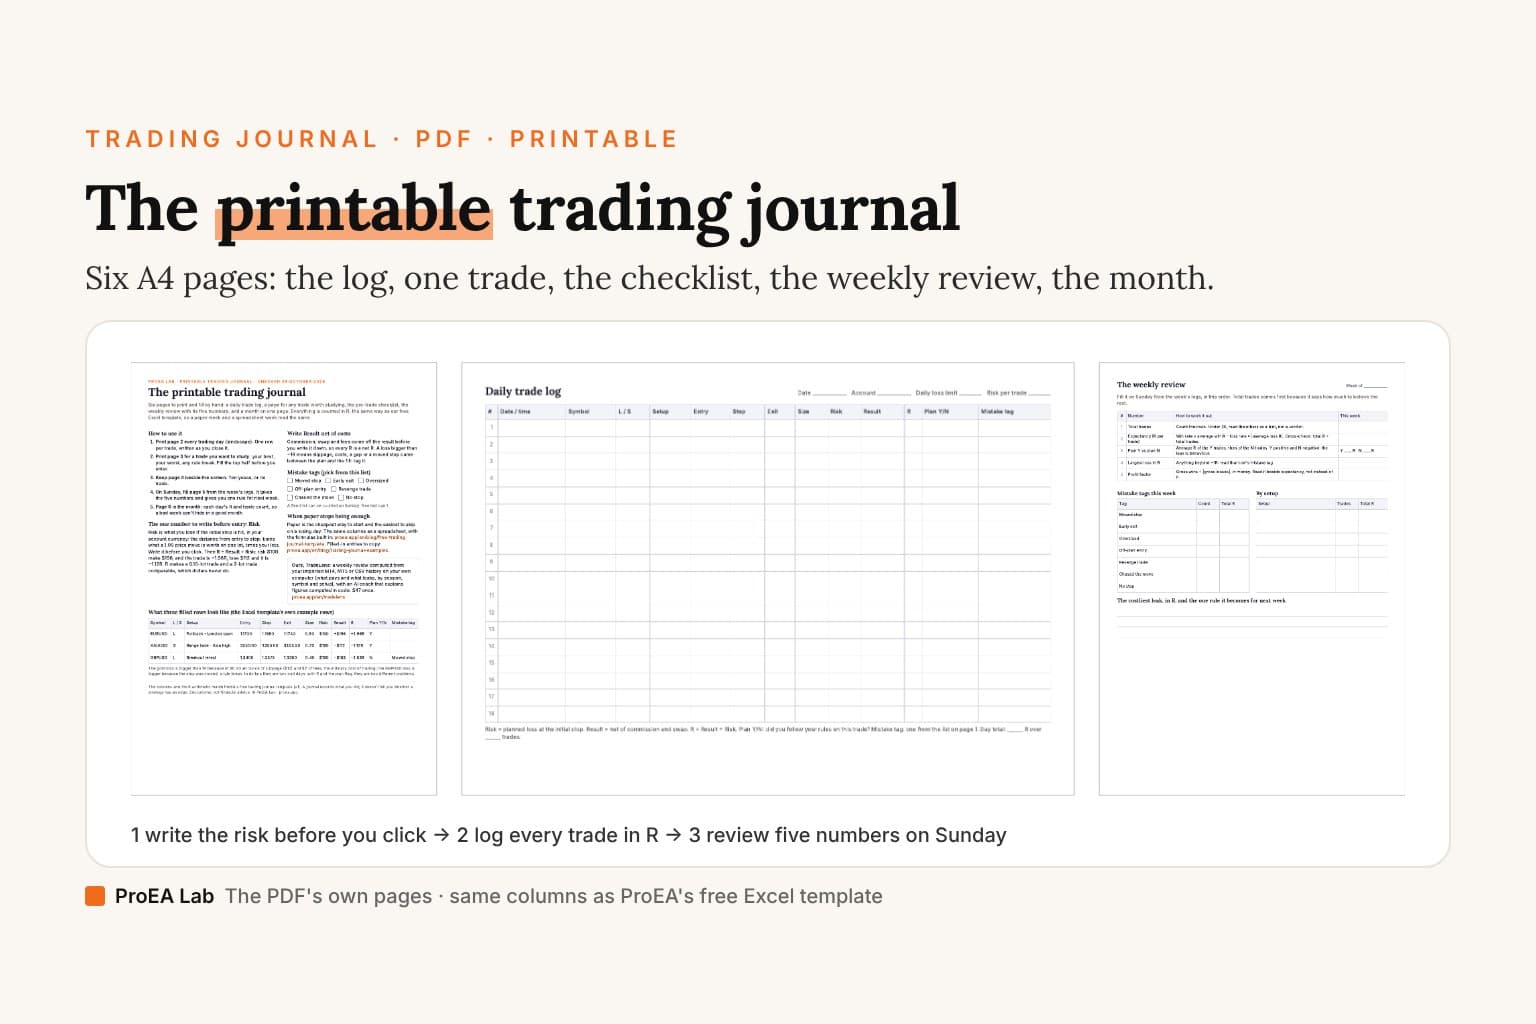
Download the printable trading journal (PDF, six A4 pages). It holds a daily trade log, a page for any trade worth studying, the pre-trade checklist, a weekly review with its five numbers and a month on one page. Everything is counted in R, with the same columns as our free Excel and Google Sheets template, so a paper week and a spreadsheet week read the same.
| Page | What it's for | When you fill it |
|---|---|---|
| 1. The guide | How to use it, the R formula, the mistake tags, three filled example rows | Read once |
| 2. Daily trade log | One row per trade, 18 rows, landscape | As each trade closes |
| 3. One trade, studied | Before entry, after exit, a box to sketch the chart, the lesson | For your best, your worst and any rule break |
| 4. Ten yeses | The pre-trade checklist, your setup menu and your limits | Beside the screen, before every trade |
| 5. The weekly review | The five numbers, mistake tags and setups, one rule for next week | Sunday |
| 6. The month on one page | Each day's R and trade count | Every evening |
What format should a trading journal have?
One row per trade, with the planned risk written before entry and the result written net of costs. Then the R multiple, result divided by risk, makes every trade comparable whatever its size. The daily log's fourteen columns:
| Column | What you write | Why |
|---|---|---|
| # and Date / time | When the trade closed | The review groups by day and session |
| Symbol, L / S | The market and the direction | Some traders only make money one way |
| Setup | One name from your menu (page 4) | A closed menu can be counted; free text can't |
| Entry, Stop, Exit | Prices. Stop is the initial stop | The stop sets the risk |
| Size | Lots or contracts | Shows whether size followed your rule |
| Risk | The loss at the initial stop, in money | The denominator of every R |
| Result | Net of commission and swap | What actually happened |
| R | Result ÷ Risk | Makes a 0.10-lot trade and a 2-lot trade comparable |
| Plan Y/N | Did you follow your rules? | Splits the system from the rule breaks |
| Mistake tag | One from a fixed list | Counts the repeat offender |
The Excel template has the same columns plus Target, Win/Loss, Fees, Notes and a screenshot link. On paper, Win/Loss is the sign of R, and the rest live on the one-trade page, so the daily log fits on one landscape sheet.
What do filled rows look like?
Page 1 prints the Excel template's own three example rows:
| Symbol | L / S | Setup | Risk | Result | R | Plan | Mistake tag |
|---|---|---|---|---|---|---|---|
| EURUSD | L | Pullback - London open | $100 | +$196 | +1.96R | Y | |
| XAUUSD | S | Range fade - Asia high | $100 | −$112 | −1.12R | Y | |
| GBPUSD | L | Breakout retest | $100 | −$163 | −1.63R | N | Moved stop |
Both losses are bigger than 1R for different reasons. The gold trade paid $0.50 an ounce of slippage ($10) and $2 of fees, the ordinary cost of trading. The GBPUSD trade had its stop moved, a rule break. In dollars they're two bad days; with R and the plan flag, they're two different problems. For whole entries with notes, see six filled-in trading journal examples.
What goes on the pre-trade checklist?
Ten checks, each a yes, or no trade. Page 4 prints them with a tick column for each weekday:
- The setup is on my menu, and I can name it.
- I wrote the reason in one line before entry.
- The stop is where the idea is wrong, not where the loss feels small.
- Risk is my fixed amount or less, and the size comes from it.
- The target, or the exit rule, is written down.
- No news in the next 30 minutes that I haven't planned for.
- I am under my daily loss limit, and this is not a trade to win a loss back.
- Spread and commission are normal for this market and hour.
- This position doesn't double a risk I already hold (same currency, same direction).
- If it stops out, I'll still be fine with having taken it.
A skipped trade is a row in the log too: write it with a dash for the result. Over a month, the skipped trades show what the checklist saved you from, or what it cost.
Below the checklist sit your setup menu (five setups, when each is valid, where its stop goes) and your limits: risk per trade, daily loss limit, the most trades a day, and what you do after two losses in a row. Fill them once, in pen.
How do you do the weekly review on paper?
Five numbers, in this order, from the week's logs:
- Total trades. It says how much to believe the other four. Under 20, read them as a hint.
- Expectancy in R per trade: win rate × average win R − loss rate × |average loss R|. Cross-check it: total R ÷ total trades gives the same figure.
- Plan Y vs plan N. The average R of the trades where you followed the plan, then of the ones where you didn't. If Y is positive and N negative, the method may be fine and the leak is behaviour.
- Largest loss in R. Anything beyond −1R: read that row's mistake tag.
- Profit factor: gross wins ÷ |gross losses|, in money. It moves with position size, so read it beside expectancy, not instead of it.
On the template's three rows, that's 3 trades, −0.26R expectancy, Y +0.42R against N −1.63R, a largest loss of −1.63R and a profit factor of 0.71. Then count the mistake tags and total each setup's R. Write down the leak with the largest cost in R and the one rule it becomes for next week. One rule, not five.
The deep version, as a PDF
The Trading Journal Playbook
What to write on every trade and why, filled-in entries across markets, the pre-trade checklist, the weekly and monthly review with the arithmetic shown, and the same columns on paper, in a spreadsheet or an app.
- What to write on every trade, and why each of the template's eighteen columns exists, in the order you fill them
- 13 filled-in entries across forex, gold, an index CFD, a partial close, a prop-firm evaluation day, a skipped trade and a backtest, every Risk, Result and R worked from the prices
- The pre-trade checklist, and how a month of mistake tags turns into checks of your own
Opens soon · USD 19, one payment. See what's inside →
Paper, spreadsheet or app?
Start where you'll keep going. The columns are the same in all three; what changes is how much work the review takes and whether a day can go missing.
| Paper (this PDF) | Spreadsheet | Journal app | |
|---|---|---|---|
| Cost | Printing | Free | Free to monthly, or once |
| Getting trades in | By hand | By hand or paste | Import or sync |
| The weekly numbers | Hand arithmetic | Formulas | Computed |
| Skipped days | Easy to skip | Easy to skip | Imports fill them |
| Charts and tags | A sketch box | A link per row | Built in |
Paper suits a trader with a few trades a day who wants the habit of writing the reason before entry. Past about ten trades a day, the arithmetic becomes the reason the review doesn't happen; move to the Excel template or an app. If you trade MetaTrader, importing MT5 trades into a journal covers the three routes.
Ours, TradeLens, computes a weekly review from your imported MT4, MT5 or CSV history on your own computer (what pays and what leaks by session, symbol and setup, and what broken-rule trades cost), and its AI coach explains figures computed in code (what an AI journal should and shouldn't do). It's $47 once. It has no phone app and no free plan, so the PDF and the template are the free ways to start.
A trading journal book, or print as you go?
A bound trading journal book holds the same pages, and some traders write more in one. Printing as you go costs less and lets you change the setup menu when your trading changes. A month is about 28 pages if you trade every weekday: 20 daily logs, a few trade pages, four reviews and a calendar. Keep each month's pages together, with the review on top.
Frequently asked questions
Is there a printable trading journal PDF?
Yes. Ours is six A4 pages: a guide with three filled example rows, a daily trade log (landscape, 18 rows), a page for one trade worth studying, the pre-trade checklist, the weekly review and a month calendar. No email, no account.
What format should a trading journal have?
One row per trade with at least: date, symbol, long or short, a setup name from a fixed menu, entry, stop, exit, size, the planned risk, the net result, R (result ÷ risk), a yes or no for whether you followed your plan, and a mistake tag from a fixed list. Notes and a chart belong on a separate page for the trades you study.
What should a trading journal checklist include?
The checks you would want answered before every trade: the setup is on your menu, the reason is written, the stop is where the idea is wrong, the risk is your fixed amount or less, the exit is written, no unplanned news is due, you're under your daily loss limit, costs are normal, the trade doesn't double a risk you hold, and you'd be fine if it stopped out. Ten yeses, or no trade.
How do I calculate R in a trading journal?
Divide the net result by the risk you planned at entry. Risk $100 and make $196, and the trade is +1.96R; lose $112, and it is −1.12R. Write the risk before you enter, as the loss at the initial stop in your account currency.
Is a paper trading journal better than a spreadsheet or an app?
Paper is the cheapest way to start and the slowest to review: the weekly numbers are hand arithmetic, and a log is easy to skip on a losing day. A spreadsheet does the arithmetic for you; an app imports the trades so no day goes missing. The columns matter more than the medium.
How many pages do I need to print?
One daily log per trading day (18 rows each), one trade page for each trade you want to study, the checklist once to keep beside the screen, one weekly review a week and one calendar a month. About 28 pages a month if you trade every weekday.