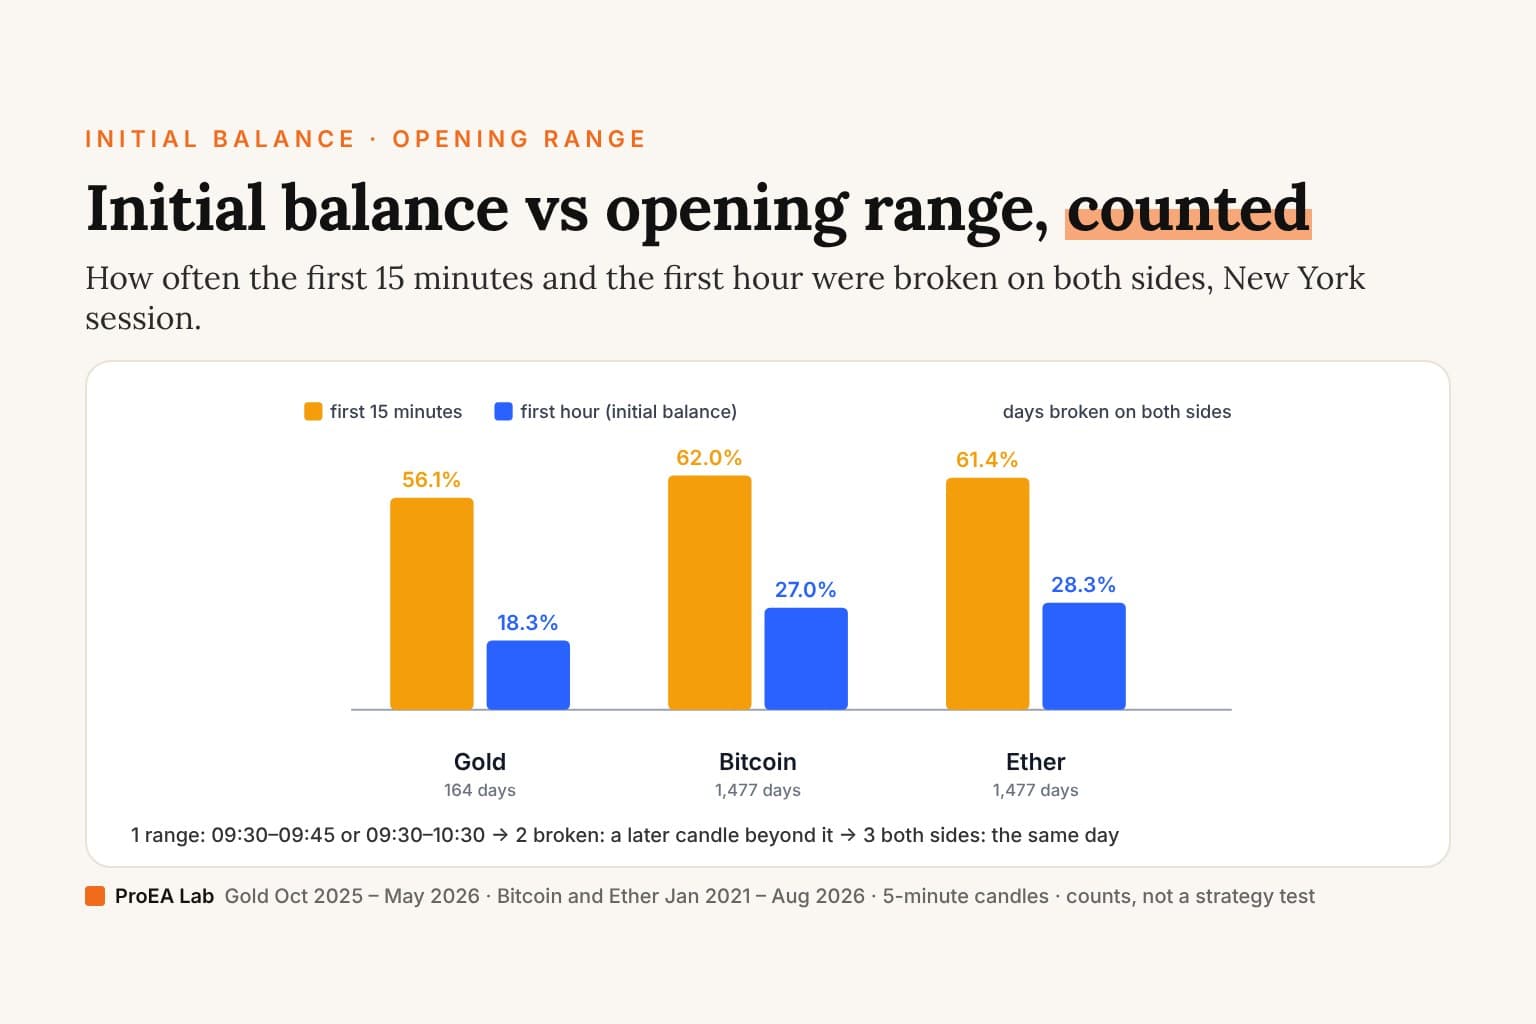
Short answer: the initial balance is the high and low of the first hour of the session; the opening range is usually the first 15 minutes. The longer the range, the less often both sides break: on our counts, the 15-minute range broke on both sides on 56–62% of days, the first hour on 18–28%.
Traders searching for the initial balance usually want three things: what it is, how it differs from the opening range breakout (ORB), and how often it breaks. The first two are definitions. The third needs counting, so we counted, on the same candles as our opening range breakout backtest.
What the initial balance is
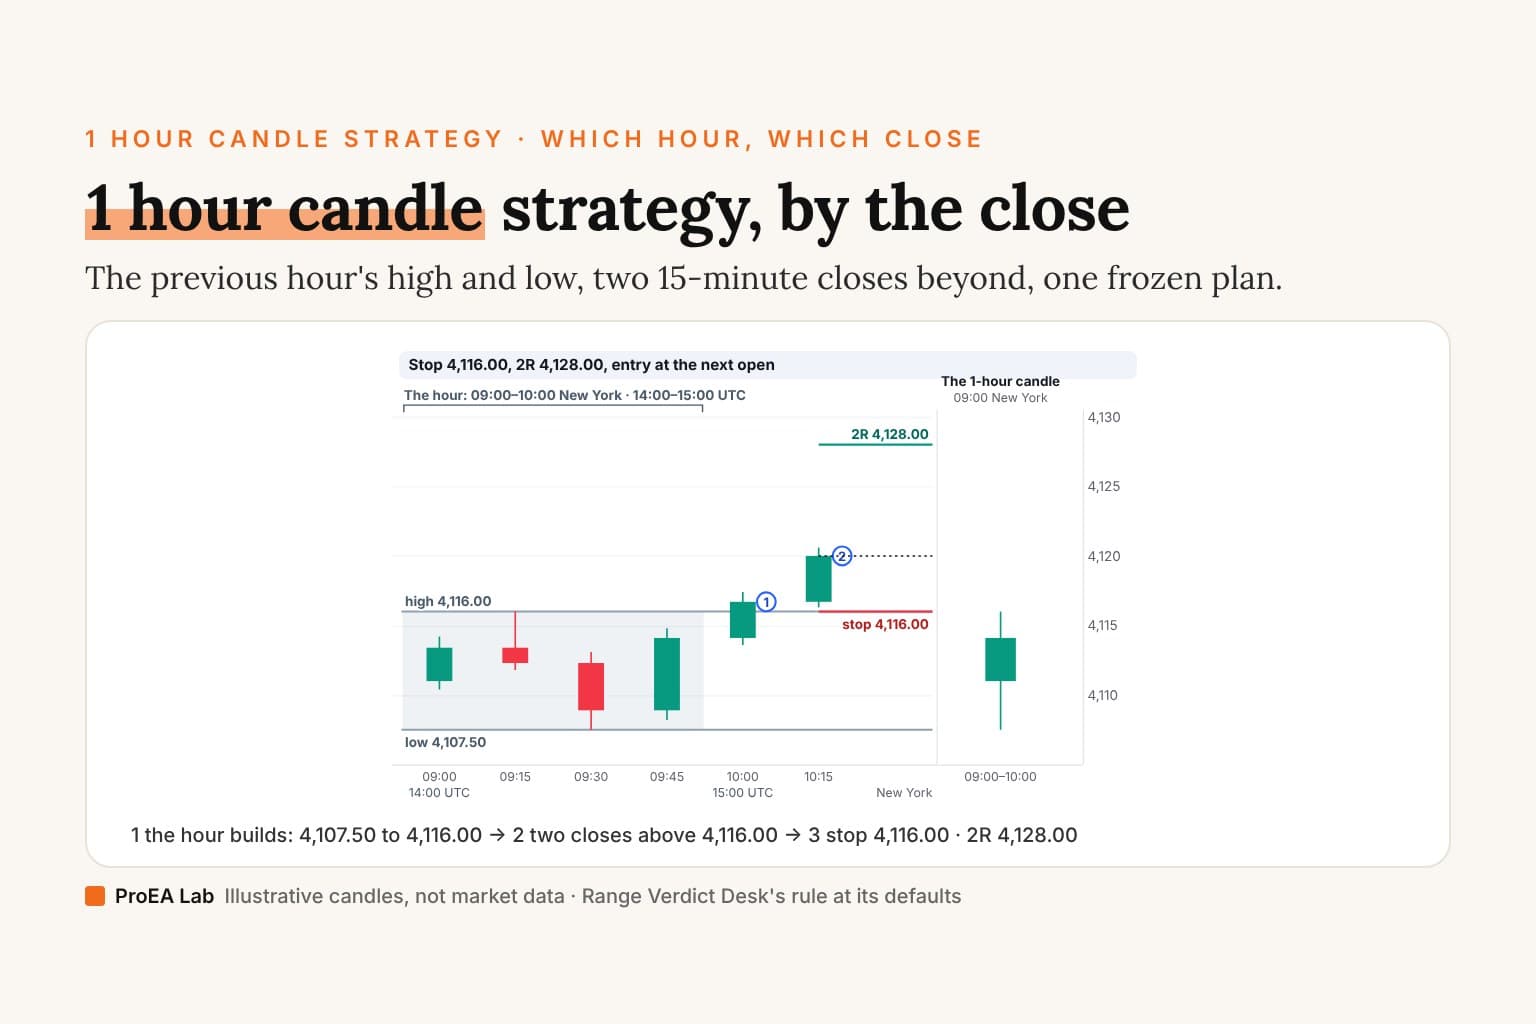
The initial balance (IB) is the high and low of the session's first hour: 60 minutes, against the opening range's usual 5, 15 or 30.
The scripts traders use agree on the hour. Two of the most-boosted open-source initial balance indicators on TradingView, noop-noop's Initial Balance and dgtrd's Initial Balance Auction Intelligence, default to 0930-1030: 09:30 to 10:30, the US stock session's first hour (code read on 27 October 2026). noop-noop's reads that window in the chart's exchange time, so on CME futures, whose clock is Chicago's, it is 10:30–11:30 New York; dgtrd's has a timezone input set to New York.
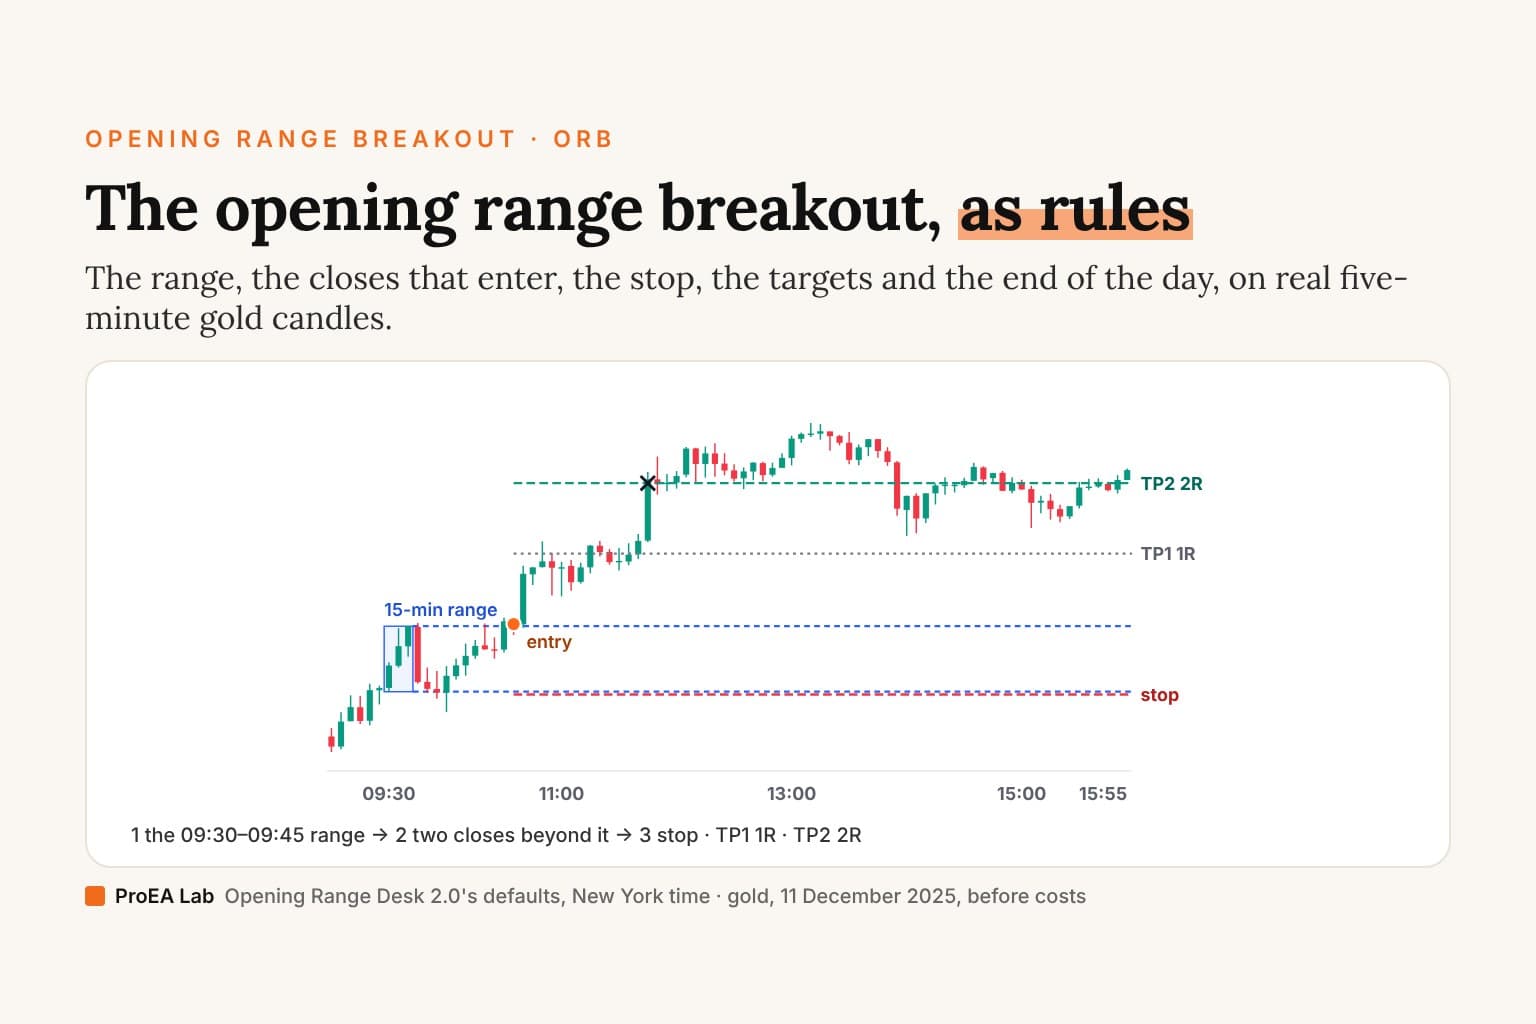
The opening range is the same idea over a shorter window. Opening Range Desk's default is 09:30–09:45 New York; 5 and 30 minutes are the other common choices, compared in the ORB rules.
Initial balance vs opening range
| Opening range (15 min) | Initial balance | |
|---|---|---|
| The window | 09:30–09:45 New York | 09:30–10:30 New York |
| Final at | 09:45 | 10:30 |
| A breakout trade can start | 09:45 | 10:30 |
| Broken on both sides (gold) | 56.1% of days | 18.3% of days |
| Broken on neither side (gold) | 0.6% of days | 5.5% of days |
| Closed inside it (gold) | 18.3% of days | 45.7% of days |
A short range sets early and breaks often, on both sides. The first hour waits out more of the open, so a break of it comes later and less often, and the day ends inside it more often.
The counts
We counted every New York weekday with all 78 five-minute candles from 09:30 to 15:55, on the candles our ORB backtest used:
- Gold: Dukascopy XAUUSD, 1 October 2025 to 29 May 2026, 164 of 173 weekdays. Nine were left out: Christmas Day, New Year's Day and Good Friday had no candles, and six holiday halts and early closes (Thanksgiving, the day after it, Christmas Eve, Martin Luther King Day, Presidents' Day and Memorial Day) lacked the afternoon.
- Bitcoin and Ether: Binance's USD-M perpetuals, January 2021 to August 2026, 1,477 days each.
The definitions were committed before the first count. They are descriptions, not a test: no entry, no stop, no costs, no verdict.
| Gold | Bitcoin | Ether | |
|---|---|---|---|
| Days counted | 164 | 1,477 | 1,477 |
| 15-minute range broken on both sides | 56.1% | 62.0% | 61.4% |
| First hour broken above only | 42.7% | 33.6% | 33.1% |
| First hour broken below only | 33.5% | 36.2% | 35.3% |
| First hour broken on both sides | 18.3% | 27.0% | 28.3% |
| First hour broken on neither side | 5.5% | 3.2% | 3.3% |
| Day closed inside the first hour | 45.7% | 36.6% | 37.0% |
| Closed back inside after breaking one side | 42.4% (53 of 125) | 34.8% (359 of 1,031) | 33.7% (340 of 1,010) |
| The first hour's share of the 09:30–16:00 range (median) | 58% | 50% | 49% |
"Broken" means a later candle traded beyond the level, even by a tick; "closed" is the 15:55 candle's close.
Three readings:
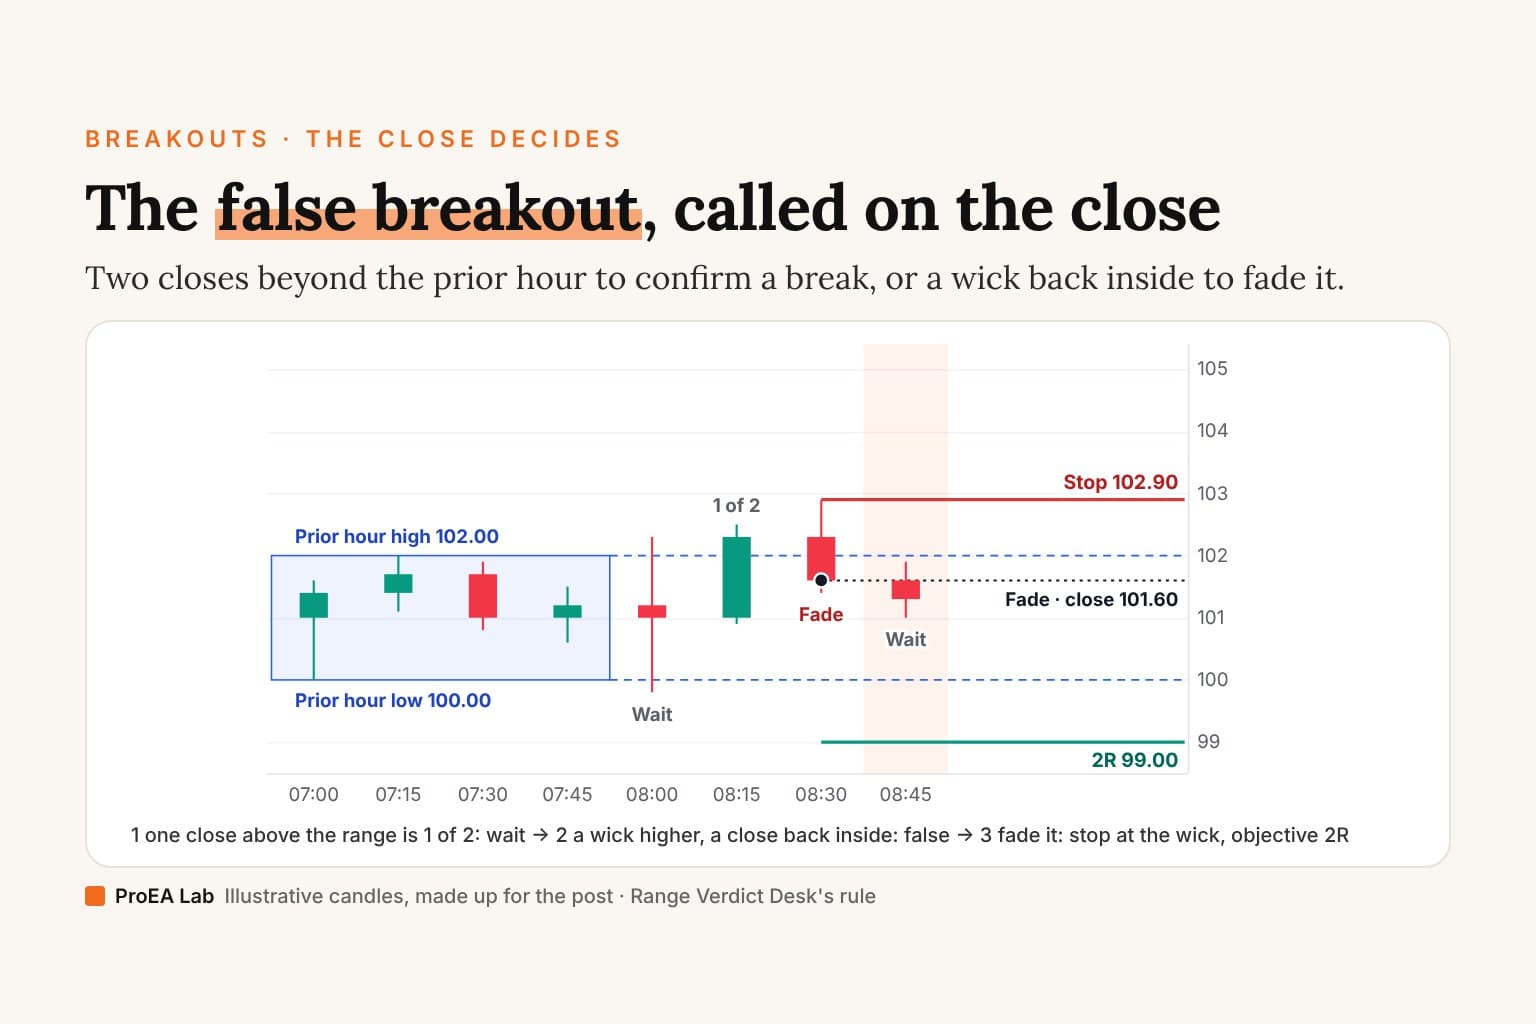
- Both sides of the 15-minute range broke on most days. A first break of the 15-minute range was often followed by a break of the other side the same day. That's the fake-out problem every ORB rule has to deal with. In our ORB backtest, waiting for a second close lost less than entering on the first, but both ended below zero after costs.
- The first hour was usually broken on one side only. On 68% to 76% of days, depending on the market.
- A one-sided break of the first hour often closed back inside by 15:55. 42% of gold's one-sided days did, and about a third of the perpetuals' (34.8% on Bitcoin, 33.7% on Ether).
The shares moved from year to year. On Bitcoin, the first hour broke on both sides on 33.7% of days in 2021 and 21.4% from January to August 2026; on Ether, 36.4% and 23.7%.
Initial balance extensions
An extension is how far the price went beyond the first hour after 10:30, in multiples of the first hour's size. A day counts once it reaches the multiple on either side.
| Reached beyond the first hour | Gold | Bitcoin | Ether |
|---|---|---|---|
| 0.5 × its size | 62.8% | 70.9% | 72.6% |
| 1 × its size | 30.5% | 46.3% | 47.2% |
| 1.5 × its size | 16.5% | 29.2% | 29.9% |
| 2 × its size | 9.8% | 18.3% | 19.2% |
On gold, a full first-hour extension came on about three days in ten, and a double extension on one in ten. The perpetuals stretched further. That fits the share above: gold's first hour already held a median 58% of its 09:30–16:00 range.
What the counts don't tell you
- Whether trading it pays. A level that breaks often isn't a trade that pays: the entry, the stop and costs decide that. When we tested the 15-minute opening range breakout as a strategy, it ended at −0.24R after costs on gold and below zero on Bitcoin and Ether (the backtest).
- The index futures. The Nasdaq 100 and S&P 500 aren't here yet; their data download is pending, as in the backtest.
- Gold's and crypto's own sessions. Both trade almost around the clock. We counted them on the New York stock session's clock, 09:30–16:00, which is when the opening range and initial balance are usually drawn.
Drawing the initial balance on TradingView
Opening Range Desk takes the range window and the timezone as inputs, so 0930-1030 with America/New_York draws the first hour. It then waits for two closes beyond it, on closed candles, and draws the plan: entry, stop and two targets. It doesn't draw extensions; Opening Range Desk Pro adds an extension map, how far first breaks have run on that market, drawn from today's range as a band. Its full Pine v6 source is in Pine Pro Library, so you can read every rule.
For dedicated initial balance indicators, with extensions and session statistics, we code-read the most-boosted open-source ones in the best initial balance indicators on TradingView.
Sources
- The counts:
scripts/research/ib-stats.mjsand its definitions,docs/research/2026-10-27-ib-stats-plan.md, committed before the first count, with one amendment after it (gold's three full holidays counted as left out; no count changed); results indata/research/ib-stats/results.json. - The candles: the ORB backtest's files, checked by SHA-256 (what we measured).
- The IB scripts' default windows: their Pine source on TradingView, read on 27 October 2026.
Disclosure
We, ProEA Lab, build Opening Range Desk and Opening Range Desk Pro, and sell them in Pine Pro Library and the Premium Vault. The code is AI-assisted. The counts describe past candles on three markets; they aren't a strategy test or a forecast. Trading involves risk.
Frequently asked questions
What is the initial balance in trading?
The high and low of the first hour of the regular session. Two of the most-boosted open-source initial balance scripts on TradingView, noop-noop's Initial Balance and dgtrd's Initial Balance Auction Intelligence, default to 09:30–10:30, the first hour of the US stock session (code read on 27 October 2026); noop-noop's reads it in the chart's exchange time, so on CME futures it is 10:30–11:30 New York.
What is the difference between the initial balance and the opening range?
Length. The opening range is usually the first 5, 15 or 30 minutes; the initial balance is the first 60. On our counts the 15-minute range was broken on both sides on 56% of gold days and 62% of Bitcoin days; the first hour only on 18% and 27%.
How often does price break the initial balance?
On 164 gold days (October 2025 to May 2026), the first hour broke on one side only on 76% of days, on both sides on 18% and on neither on 5.5%. On 1,477 Bitcoin days (2021 to August 2026): one side 70%, both 27%, neither 3.2%. These are counts, not a tested strategy.
What is an initial balance extension?
How far the price goes beyond the first hour's high or low, in multiples of the first hour's size. On gold, the price reached one full IB beyond either side after 10:30 on 30.5% of days, and half an IB on 62.8%. On Bitcoin, 46.3% and 70.9%.
Does the initial balance breakout strategy work?
We haven't tested it as a strategy, so we don't know, and these counts don't say. What we did test is the 15-minute opening range breakout, after costs: it ended slightly below zero on gold and below zero on Bitcoin and Ether.
Is there an initial balance indicator for TradingView?
Many. We code-read the most-boosted open-source ones in a separate post. Opening Range Desk, ours, takes the range window as an input, so 0930-1030 draws the first hour with a breakout plan on closed candles; it doesn't draw IB extensions. Opening Range Desk Pro adds an extension map: how far first breaks have run on that market, drawn from today's range as a band.