Short answer: the 1 hour candle strategy marks the previous hour's high and low and reads the next, smaller candles against them. Two 15-minute closes in a row beyond one side is a break you go with; a wick through one side and a close back inside is a rejection you fade. As a rule you can check, it also names which hour counts, the stop, the target and the hours it trades.
Below: one hour built candle by candle, the question most guides skip (which hour is "the previous hour"?), a plan worked by hand, and the New York window, which moves an hour against UTC on 1 November 2026.
The hour sets the levels.
The 15-minute close decides.
Before any of that, decide which hour you mean.What is the 1 hour candle strategy?
A rule built on one hour's high and low. To trade it you have to decide five things:
- The hour. Which hour counts: TradingView's 1-hour candle, or a clock hour. On some markets they are different hours.
- Its high and low. The levels, frozen once the hour is over.
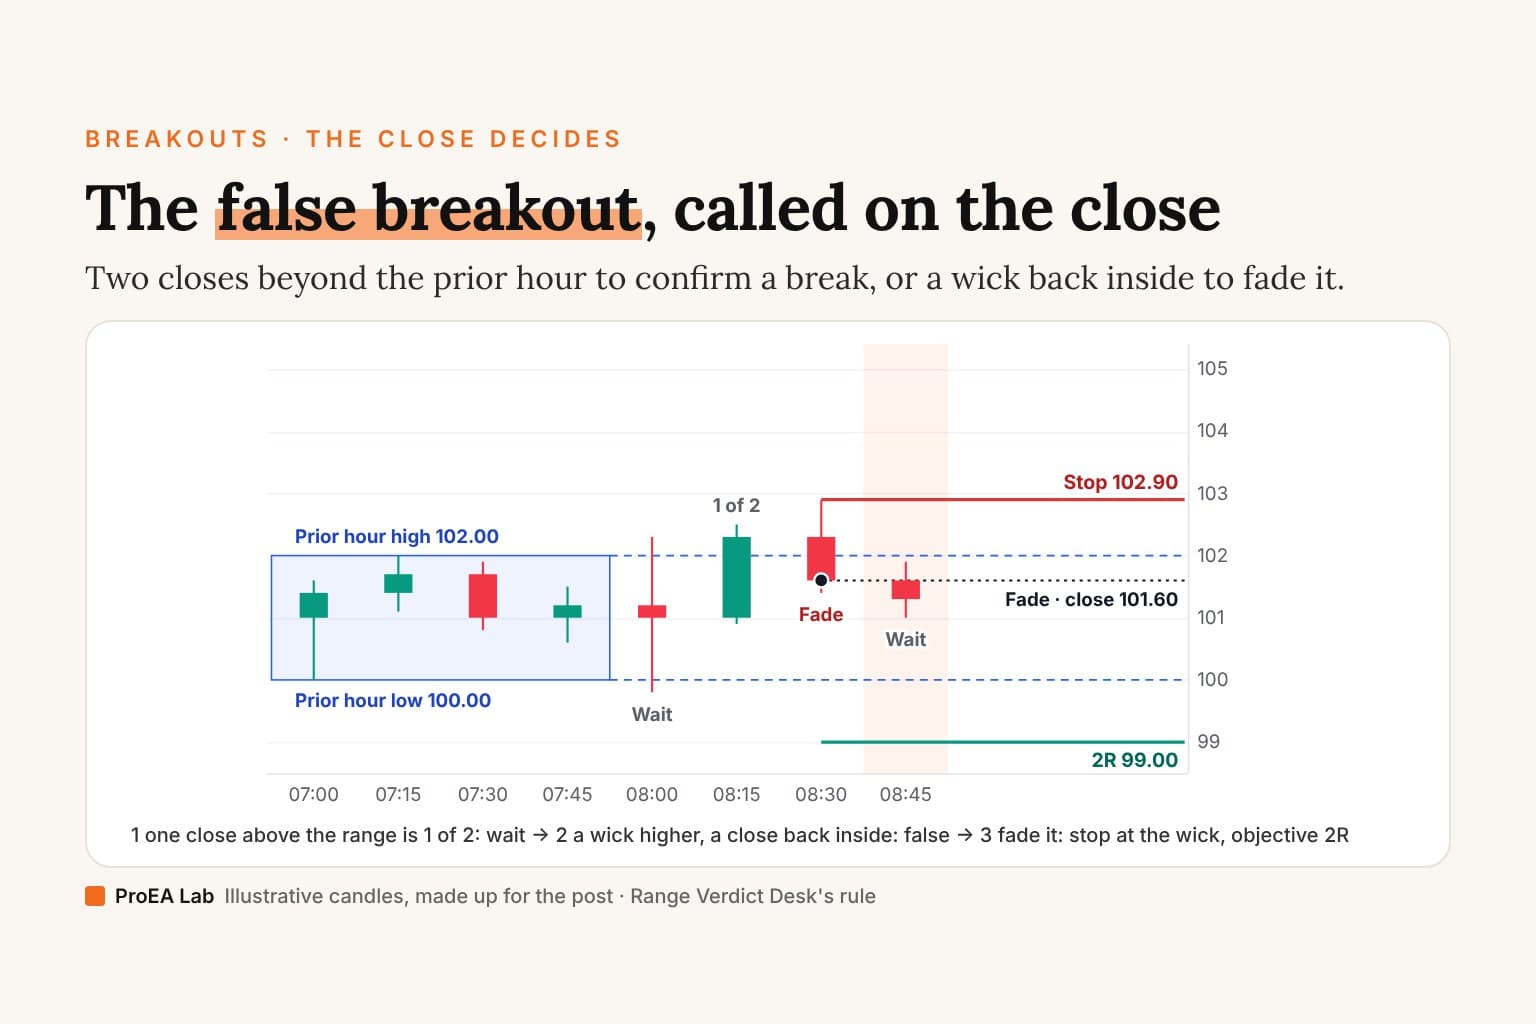
- What counts on the smaller timeframe. Two closes in a row beyond one side (you go with the break), or a wick through one side and a close back inside (you fade it). One close beyond is neither: the break waits for the second.
- The stop and the target. Where the read is wrong, and where you take the trade off.
- When. The hours the rule trades, and how many attempts each hour gets.
Our TradingView indicator Range Verdict Desk writes each of those down, so we use its rule for every example on this page. Its default reading is the first one: two closes in a row beyond the previous complete UTC hour's high or low, read on 15-minute candles. The second, Fade, is one setting away.
Hourly range meaning
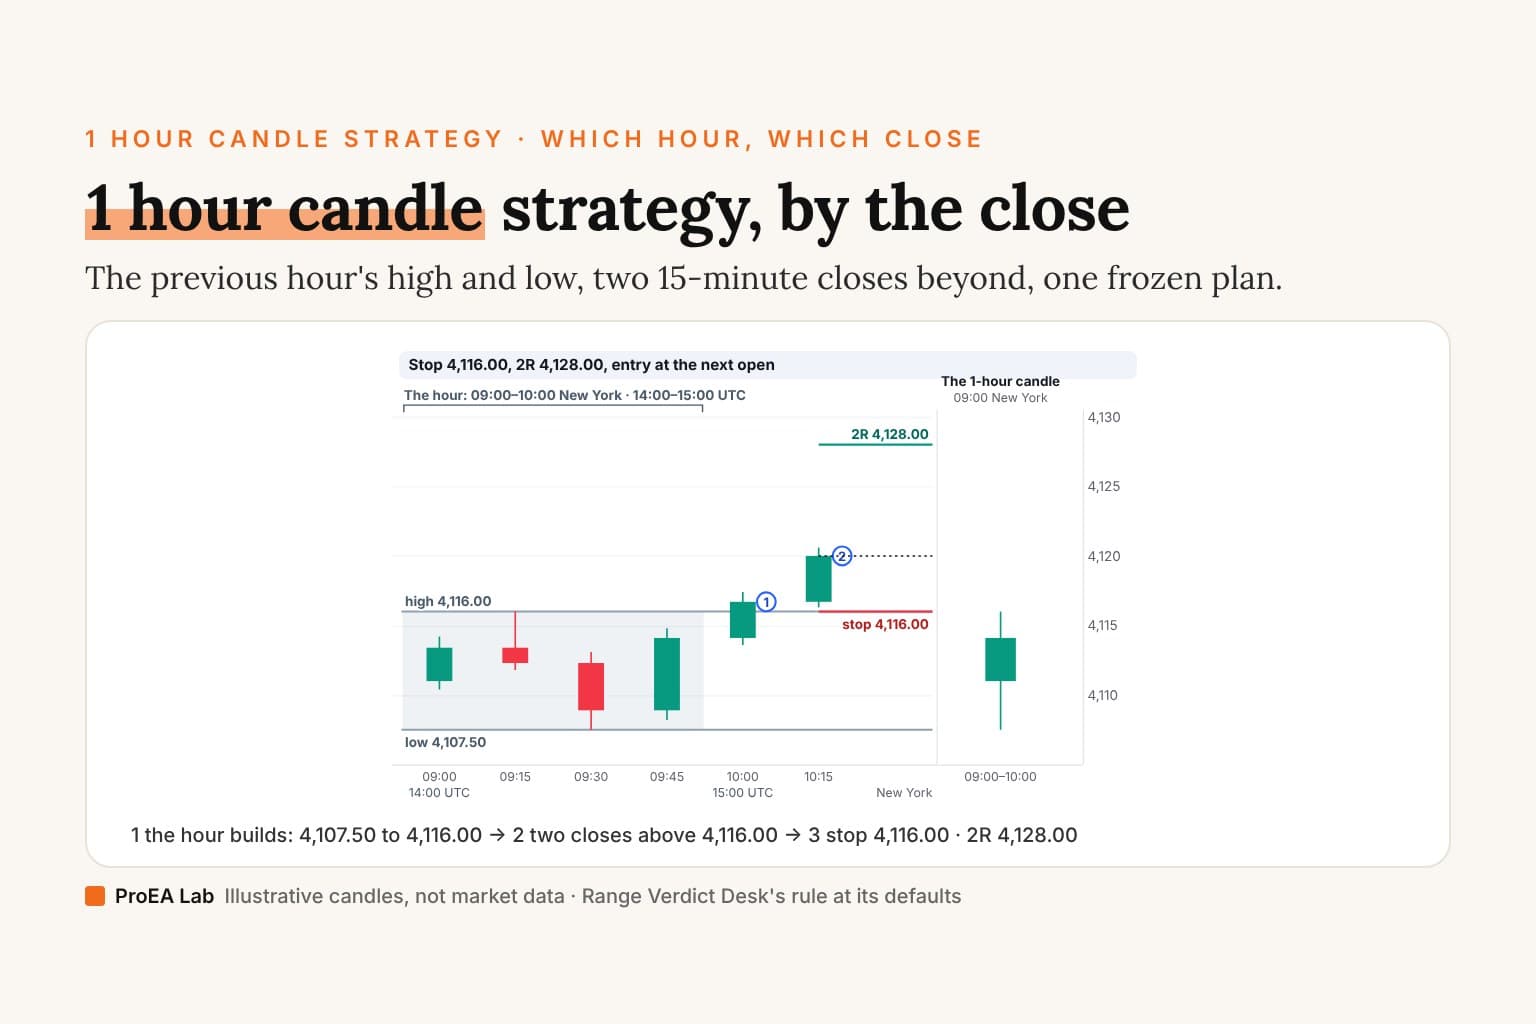
An hour's range is its high and its low, and the distance between them. In this film, four 15-minute candles build the hour, and then the next two closes are read against it by Range Verdict Desk's own engine.
Illustrative candles, made up for this explainer: not market data. The words on the chart are the desk's panel words for each close; the film ends at the plan, before any result.
Read as text
- Illustrative 15-minute candles, made up for this explainer, on the clocks of Monday 2 November 2026, when New York is five hours behind UTC. The hour is 09:00 to 10:00 New York, 14:00 to 15:00 UTC.
- The 09:00 candle opens at 4,111.00. 09:15 makes the hour's high, 4,116.00; 09:30 its low, 4,107.50; 09:45 closes at 4,114.10. Put together, that is the hour's candle: open 4,111.00, high 4,116.00, low 4,107.50, close 4,114.10.
- At 10:00 the hour is complete. Range Verdict Desk reads the next hour's closes against 4,107.50 to 4,116.00, a range 8.50 wide.
- The 10:00 candle closes at 4,116.70, above 4,116.00: one close. The panel reads "Wait for Accept".
- The 10:15 candle closes at 4,120.00, above it again: two closes in a row. The panel reads "Confirmed LONG plan".
- The plan is frozen at that close. The risk is the larger of 1 ATR (3.62) and the distance from the close to the high (4.00): 4.00. The stop is 4,116.00, the 2R objective 4,128.00, and the reference entry is the next open.
How this window was chosen: The six candles are drawn by hand to show one hour and two closes above it, on the clocks of 2 November 2026. Before them come 264 flat candles the film never draws, so the script's 250-candle warm-up is met. Range Verdict Desk's engine reads all of them at its defaults: Accept, the 08:00–12:00 New York window.
The candles are made up for this page, on the clocks of Monday 2 November 2026, when New York is five hours behind UTC:
| New York | UTC | Open | High | Low | Close | |
|---|---|---|---|---|---|---|
| 09:00 | 14:00 | 4,111.00 | 4,114.20 | 4,110.40 | 4,113.40 | the hour |
| 09:15 | 14:15 | 4,113.40 | 4,116.00 | 4,111.80 | 4,112.30 | the hour's high |
| 09:30 | 14:30 | 4,112.30 | 4,113.10 | 4,107.50 | 4,108.90 | the hour's low |
| 09:45 | 14:45 | 4,108.90 | 4,114.80 | 4,108.20 | 4,114.10 | the hour closes at 10:00 |
| 10:00 | 15:00 | 4,114.10 | 4,117.40 | 4,113.60 | 4,116.70 | one close above |
| 10:15 | 15:15 | 4,116.70 | 4,120.60 | 4,116.30 | 4,120.00 | two closes above |
The hour from 09:00 to 10:00 New York has a high of 4,116.00 (the 09:15 candle) and a low of 4,107.50 (the 09:30 candle). Its range is 4,116.00 − 4,107.50 = 8.50.
Put the four candles together and you have the hour's own candle: open 4,111.00, high 4,116.00, low 4,107.50, close 4,114.10. On a chart whose 1-hour candles start on the clock hour, that is TradingView's 09:00 candle. On some charts they don't, which is the next question.
Which hour is the previous hour?
TradingView's candles start at the session's open, not on the clock. Its Help Center's example: "On a 45-minute chart of META, candles start at 9:30, 10:15, 11:00, and so on." The 1-hour candles do the same. TradingView's own symbol data (read 30 October 2026) gives each session's start:
- Spot gold (OANDA:XAUUSD) and an index CFD (OANDA's US Wall St 30, OANDA:US30USD): a session starting at 17:00 New York. Their 1-hour candles start on every whole hour.
- An NYSE stock: a regular session from 09:30 to 16:00 New York. Its 1-hour candles run 09:30–10:30, 10:30–11:30 and on to a last half-hour candle, 15:30–16:00.
- The Nifty 50 (NSE:NIFTY): a session starting at 09:15 India time. Its 1-hour candles run 09:15–10:15, 10:15–11:15 and so on. Where the day's last candle ends depends on the session TradingView sets: NSE's timings page gives the normal market's close as 15:30, but TradingView's own data gives NSE:NIFTY's session as "0915-1530#20260803/0915-1515", which also names a 15:15 close, dated 3 August 2026. Hover over the last candle on your chart to see where its day ends.
Range Verdict Desk doesn't use TradingView's 1-hour candle. Its reference is the previous complete UTC hour: four adjacent 15-minute candles, the first opening on the hour in UTC. The script says so itself, in the message it stops with on any other chart: "Reference frames are UTC H1/H4, not broker H4 candles."
New York sits a whole number of hours from UTC, so a UTC hour is a New York clock hour, 10:00 to 11:00 for example. India sits five and a half hours ahead of UTC, so a UTC hour there runs from half past: 09:30 to 10:30, 10:30 to 11:30.
| New York | UTC | Your time (India) | Closes it reads on NYSE stock |
|---|---|---|---|
| 00:00–04:00 | 04:00–08:00 | 09:30–13:30 | none |
| 04:00–08:00 | 08:00–12:00 | 13:30–17:30 | none |
| 08:00–12:00 (default) | 12:00–16:00 | 17:30–21:30 | 11:15–11:45 New York (3) |
| 12:00–16:00 | 16:00–20:00 | 21:30–01:30 (+1 day) | 12:00–15:45 New York (16) |
Two different hours. TradingView: 09:30–10:30 New York (13:30–14:30 UTC). Range Verdict: 10:00–11:00 New York (14:00–15:00 UTC).
TradingView counts its 1-hour candles from the session's start, 09:30 New York; Range Verdict reads the UTC clock hour before this candle's hour. The panel's Last close row reads "Wait for Accept".
Illustrative candles at each session's times (weekdays, holidays ignored), read by Range Verdict Desk's own engine at its defaults; only the clock matters. Sessions: OANDA's hours and TradingView's symbol data for gold and US Wall St 30, NYSE's core session, NSE's normal market (TradingView's data for NSE:NIFTY also names a 15:15 close, dated 3 August 2026; on such a chart the Nifty's last close is 15:15). The window counts a candle by its close; a close on the window's end is out.
The drill. Pick a market, a day and a candle. The top row is TradingView's previous 1-hour candle; the bottom row is Range Verdict's prior UTC hour, with the desk's panel words for that candle's close. Three things to try:
- Spot gold at 09:15 New York. The same hour: 08:00 to 09:00 New York, which is 12:00 to 13:00 UTC on 30 October and 13:00 to 14:00 UTC on 2 November. The exception is the first hour after the daily break. OANDA lists XAU/USD trading from 18:05 to 16:59 New York, so at 18:00 TradingView's previous 1-hour candle is 16:00 to 17:00, and Range Verdict has no range at all: its panel reads "Incomplete prior UTC frame".
- An NYSE stock at 11:15 New York. Two different hours: TradingView's previous candle is 09:30 to 10:30; Range Verdict's prior UTC hour is 10:00 to 11:00. Before 11:00 there is no complete UTC hour: 09:00 to 10:00 holds only the 09:30 and 09:45 candles.
- The Nifty 50 at 10:30 India. TradingView's previous candle is 09:15 to 10:15; Range Verdict's is 09:30 to 10:30 India (04:00 to 05:00 UTC), the first complete UTC hour of the day.
To check a candle on your own chart, TradingView's Help Center has the tip: "To see when a candle started, move your cursor over it. The date and time appear at the bottom of the chart."
How to trade the 1 hour candle, step by step
Worked by hand on the film's candles, as Range Verdict Desk reads them at its defaults:
- Wait for the hour to close. At 10:00 New York the 09:00 hour is over: its range is 4,107.50 to 4,116.00. Until then its high and low can still move.
- Read 15-minute closes, not wicks. A candle that trades above 4,116.00 and closes under it doesn't count as a break.
- Count the closes. The 10:00 candle closes at 4,116.70, above 4,116.00: one. The panel reads "Wait for Accept". The 10:15 candle closes at 4,120.00, above it again: two in a row. The panel reads "Confirmed LONG plan". A close back inside in between would have started the count again.
- Set the stop from the risk. ATR(14), the average true range over 14 candles with Wilder's smoothing, is 3.62 at that close. The distance from the close back to the high is 4,120.00 − 4,116.00 = 4.00. The risk is the larger of the two, 4.00, so the stop goes 4.00 below the close: 4,120.00 − 4.00 = 4,116.00, back on the high.
- Set the target. 2R is twice the risk above the close: 4,120.00 + 2 × 4.00 = 4,128.00.
- Enter at the next open. The plan is frozen at the 10:15 candle's close; its reference entry is the next candle's open, not the close itself.
- Size it from the stop. With 100 of your account's currency at risk, 100 ÷ 4.00 = 25 units, rounded down to what your broker trades.
- One attempt. That signal spends the hour's attempt. Another two closes later in the same hour wouldn't make a second plan.
The plan ends at its stop or at the 2R objective, whichever a candle reaches first; when one candle reaches both, the desk counts the stop. A plan still held when a candle closes at the window's end, or after 16 held candles, ends at the next open.
The fade: a wick through one side, a close back inside
Take the same range on another day, with no plan open. Say a candle trades up to 4,117.00 and closes at 4,114.00, back inside the range. On the default reading that is nothing. With Fade selected it is a short: the wick through the high is the signal, and the wick's top, 4,117.00, is where the risk is measured from. The distance from the close is 4,117.00 − 4,114.00 = 3.00. Say ATR(14) is 3.62 at that close: the risk is the larger, 3.62, so the stop is 4,114.00 + 3.62 = 4,117.62 and the 2R objective is 4,114.00 − 2 × 3.62 = 4,106.76.
The film's own candles can't show this one. With Fade selected, the 09:15 candle already wicks above the 08:00 hour's high, 4,112.50 (the film doesn't draw that hour), and closes back inside: a short plan with its stop at 4,116.00. A candle like the one above, at 10:00, would reach that stop, and its close would read "Skipped: plan already active".
A candle that wicks through both the high and the low is no signal: it went through both sides, so there's no side to fade. Fading a break of an older high or low is also what turtle soup does, on 20-day levels, and the breakout trading strategy explainer covers where false breaks come from.
Hourly high and low breakout trading strategy: the rules written down
Range Verdict Desk's rule at its defaults, from its source:
1. Chart: standard 15-minute candles. On any other chart the
   script stops.
2. Range: the previous complete UTC hour, four adjacent 15-minute
   candles. After a gap, no range until a whole hour has traded.
3. Accept (default): two closes in a row strictly beyond the same
   side, inside the current hour. Fade: a wick through one side
   and a close strictly back inside; through both sides, nothing.
4. Time: the signal close falls in one New York window: 00:00,
   04:00, 08:00 (default) or 12:00, four hours each. A close on
   the window's end is out.
5. One attempt an hour, after a 250-candle warm-up.
6. Plan, frozen at the close: risk = the larger of 1 ATR(14) and
   the distance to the range's high or low (Fade: to the wick).
   Stop 1 risk behind, objective 2R ahead, entry the next open.
7. End: stop or objective (stop first when one candle touches
   both), or the next open after the window's end or 16 held
   candles.
On the chart the desk names the range's lines "Prior UTC high" and "Prior UTC low", and its panel's Last close row says what the latest close did, from "Incomplete prior UTC frame" to "Wait for Accept" to "Confirmed LONG plan".
Previous candle high low strategy: the same idea on any candle
The previous candle high low strategy is the same rule with the candle left open: the last closed candle's high and low are the levels, on whatever timeframe you pick. A break closes beyond one; a rejection wicks through and closes back inside.
The candle you pick sets how much trading the levels hold. The previous 15-minute candle is fifteen minutes; the previous hour is four of them. And on a 1-hour chart, "the previous candle" is TradingView's previous 1-hour candle, with the session-start difference above: on an NYSE stock it is 09:30 to 10:30, not 10:00 to 11:00.
New York session strategy
NYSE gives its own hours plainly: "Core Trading Session: 9:30 a.m. to 4:00 p.m. ET". For gold and index CFDs, which trade through the night, "the New York session" is a name for part of the day, not an exchange's hours.
Range Verdict Desk doesn't use a session name. It uses four fixed New York windows, counted by the signal candle's close. Its own tooltip: "Four fixed New York windows to choose from. IANA New York time automatically handles DST. Signal closes at the end boundary are excluded."
Because the windows are on New York's clock, they move against UTC when New York's clock changes. NIST: "During 2026, daylight saving time is in effect from March 8 at 2 a.m. (local time) to November 1 at 2 a.m. (local time)." So until 1 November New York is four hours behind UTC, and from 1 November five:
| New York window | UTC until 1 Nov | UTC from 1 Nov | India until 1 Nov | India from 1 Nov |
|---|---|---|---|---|
| 00:00–04:00 | 04:00–08:00 | 05:00–09:00 | 09:30–13:30 | 10:30–14:30 |
| 04:00–08:00 | 08:00–12:00 | 09:00–13:00 | 13:30–17:30 | 14:30–18:30 |
| 08:00–12:00 (default) | 12:00–16:00 | 13:00–17:00 | 17:30–21:30 | 18:30–22:30 |
| 12:00–16:00 | 16:00–20:00 | 17:00–21:00 | 21:30–01:30 | 22:30–02:30 |
India has no daylight saving, so in India, as in UTC, every window starts an hour later from 1 November. The drill above shows them in your own time zone.
Which window fits your market:
- Spot gold and index CFDs trade through all four windows.
- An NYSE stock: in the default window the desk reads only three closes, 11:15, 11:30 and 11:45, because the first complete UTC hour is 10:00 to 11:00. The 12:00–16:00 window reads 16 closes, 12:00 to 15:45.
- The Nifty 50 never trades in the default window: NSE's normal market, 09:15 to 15:30, is overnight in New York. Until 1 November the 00:00–04:00 window reads closes from 10:45 to 13:15 India and 04:00–08:00 from 13:30 to 15:30; from 1 November, 10:45 to 14:15 and 14:30 to 15:30. On a chart whose Nifty session ends at 15:15 (see above), the last close is 15:15, not 15:30.
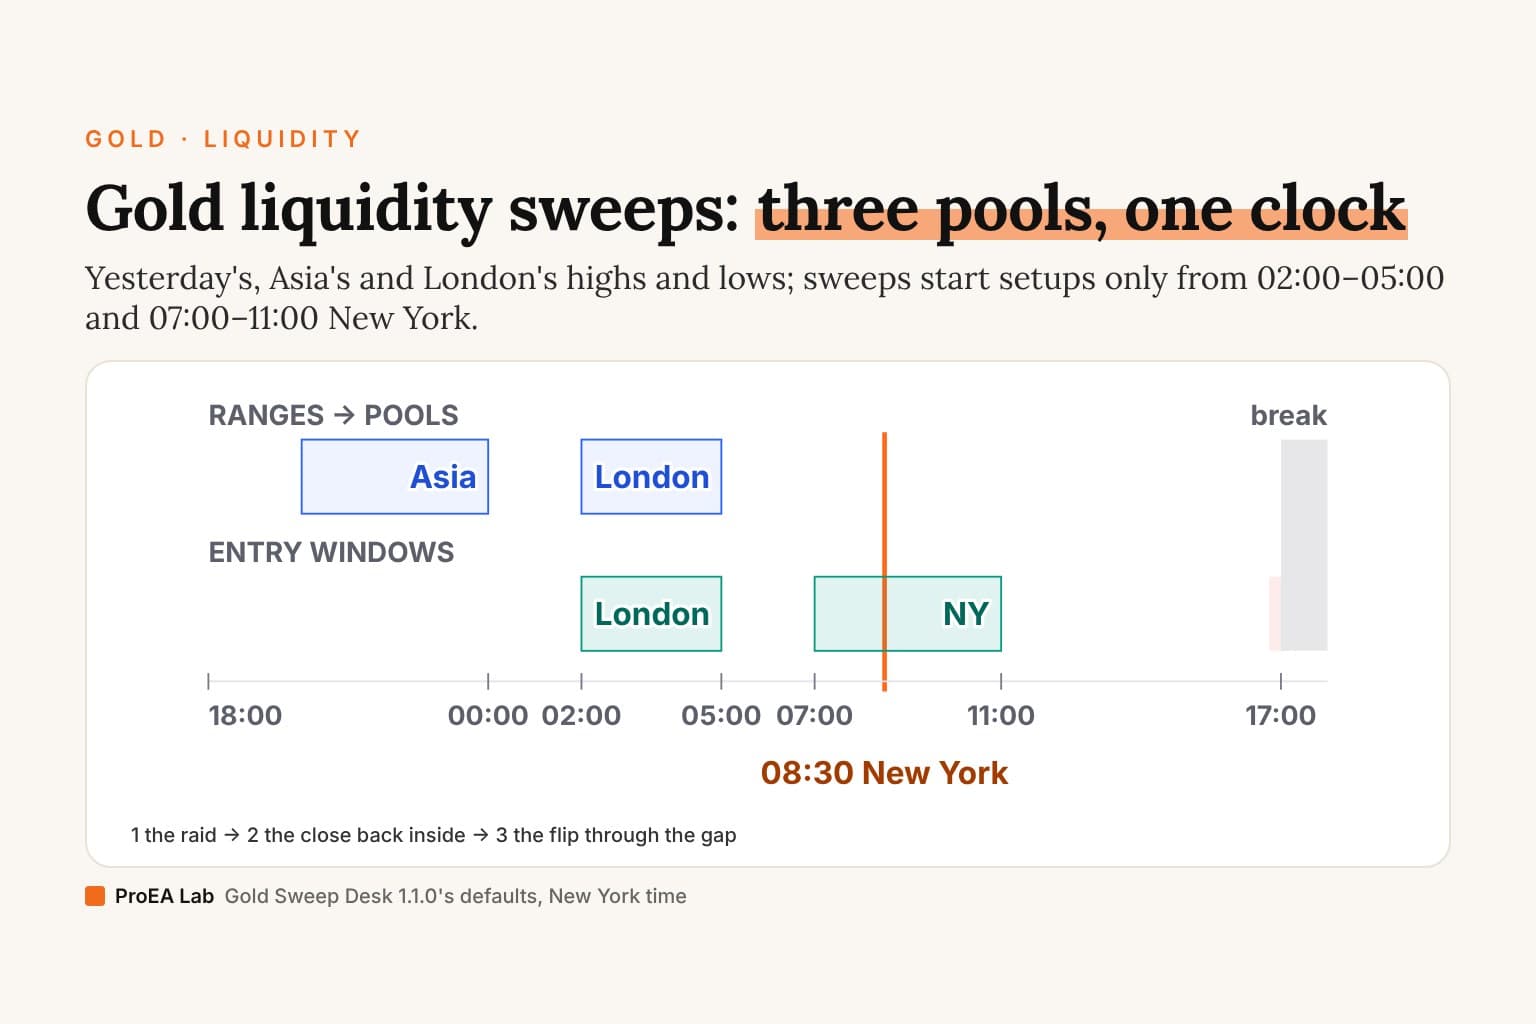
Two of our other desks read New York time for jobs of their own: the gold liquidity sweep strategy explains Gold Sweep Desk's windows for gold, and the opening range breakout strategy explains Opening Range Desk's range after the 9:30 open. For the session times themselves in your zone, the New York session clock shows them live.
The previous hour's high and low on TradingView
- By hand. Switch to the 1-hour chart, draw a horizontal line at the last closed candle's high and another at its low, then go back to 15 minutes. That gives you TradingView's hour, which on an NYSE stock or the Nifty 50 starts at the session's open.
- With Range Verdict Desk. Add it to a 15-minute chart. It draws "Prior UTC high" and "Prior UTC low" over each hour, and the second row of its panel reads "UTC H1 / M15". Pick the window under "NY signal-close window" in its settings. On any other timeframe it stops with the message quoted above.
What this rule leaves out
- One hour, one clock. The desk reads only the previous complete UTC hour. Where a market's session starts off the hour, that isn't the 1-hour candle on your chart, and the first hour after any gap has no range.
- One attempt, one window. One attempt an hour, and only closes inside the chosen New York window.
- A frozen plan. A stop of at least 1 ATR and a 2R objective, fixed at the signal close. Nothing trails.
- Costs. The plan's R is before costs; your spread and fees come out of it.
- Orders. The desk draws reference plans; it places no orders.
Range Verdict Desk
Range Verdict Desk is a TradingView indicator in Pine Pro Library, with its full Pine v6 source, for standard 15-minute candles. It draws the previous complete UTC hour's high and low and reads every closed candle against them, two closes beyond (Accept, the default) or a wick through one side and a close back inside (Fade), in one of four New York windows. A signal freezes one reference plan from the next open, with a stop of at least 1 ATR and a 2R objective, out by the window's end. It places no orders. See Range Verdict Desk.
Range Verdict Pro runs the same engine unchanged, so on the same chart and settings it confirms the same plans. It adds the game plan on your chart before and during the New York window, each plan with its size for your risk, a Radar that reads the same rule on eight markets on one board, and a strategy in which a confirmed plan submits a qty 1 simulated entry in TradingView's Strategy Tester. It places no orders either. It is $49 once, or in the Complete Suite.
Library desk · plan alerts
Prior UTC range visible. Last close: Outside NY 08:00-12:00.
Range Verdict Pro · indicator · Radar · strategy
Both candidate levels drawn and explained, with a configurable heads-up alert.
Starts at 4.00, the risk of the 10:15 plan worked by hand above. A wider stop means a smaller size for the same risk.
07:45 New York: the same plan, more on Pro's screen
Range Verdict Pro at your risk: ≈ 25 units · nominal 100 USD risk at signal close.
What each one shows, in the Pro page's own words (its "Library desk or Pro" comparison of one simulated morning). The same simulated morning on both screens. The plan is the same on both sides. The size line is Pro's own formula, risk ÷ (stop distance × point value), with an example point value of 1 USD. Uses symbol point value. Check broker contract and lot rules. No currency conversion; gaps and costs can change actual risk. Alerts on TradingView need a paid plan: its pricing page (read 29 October 2026) shows no technical alerts on indicators on Basic and 20 or more from Essential up.
Use this animation on your site.
Frequently asked questions
What is the 1 hour candle strategy?
A rule built on one hour's high and low. You mark the previous hour's high and low, then read a smaller timeframe's closes against them, usually 15-minute candles. Two closes in a row beyond one side is a break you go with; a wick through one side and a close back inside is a rejection you fade. A complete rule also says which hour counts, where the stop and target go, and which hours it trades.
How to trade the 1 hour candle?
Wait for the hour to close and mark its high and low. Then watch 15-minute closes, not wicks. In Range Verdict Desk's version, two closes in a row above the high make a long plan; the stop sits one risk below the close, where the risk is the larger of 1 ATR and the distance back to the high, and the objective is 2R. One attempt per hour, inside a New York window.
What does hourly range mean?
One hour's high and low, and the distance between them. In this page's example the hour from 09:00 to 10:00 New York has a high of 4,116.00 and a low of 4,107.50, so its range is 8.50.
Is TradingView's previous 1-hour candle the same as the previous UTC hour?
Only where the session starts on the hour. TradingView starts its candles at the session's open. On spot gold, whose session starts at 17:00 New York, the hours match. On an NYSE stock opening at 9:30, TradingView's 1-hour candles run 09:30 to 10:30 and so on, while a UTC hour runs 10:00 to 11:00 New York; on the Nifty 50 they run 09:15 to 10:15, while a UTC hour runs 09:30 to 10:30 India.
What is the previous candle high low strategy?
The same idea on any timeframe: the last closed candle's high and low are the levels, and the next candles either close beyond one of them, a break, or wick through it and close back inside, a rejection. On a 1-hour chart the previous candle is the previous hour; read on 15-minute candles, a break needs a close beyond the level, not a wick.
What time is the New York window after 1 November?
New York leaves daylight saving at 2:00 a.m. on 1 November 2026, so it goes from four to five hours behind UTC. Range Verdict Desk's default window, 08:00 to 12:00 New York, is 12:00 to 16:00 UTC until then and 13:00 to 17:00 UTC from then; in India, 17:30 to 21:30 becomes 18:30 to 22:30.
Can you use Range Verdict Desk on the Nifty 50?
On 15-minute candles, yes, but not in its default window. NSE's normal market runs from 09:15 to 15:30 India time, overnight in New York, so the 08:00 to 12:00 New York window reads no Nifty candle. Its first complete UTC hour each day is 09:30 to 10:30 India. Pick the 00:00 to 04:00 New York window, whose closes start at 10:45 India, or 04:00 to 08:00, which runs to the session's close.