Short answer: the opening range breakout (ORB) marks the high and low of the first minutes after the open, then trades the side price closes beyond, with the stop on the other side of the range. Below are the rules as one indicator writes them, a drill on two real days, and what the default rule did in our written-first backtest: about zero before costs, below zero after them.
Most ORB explanations stop at "buy the break of the high". The details decide the result: how long the range is, what counts as a break, where the stop goes, where the target is, and when the day ends.
So this article uses one rule that writes all of them down: Opening Range Desk, a TradingView indicator whose full Pine v6 source is in Pine Pro Library. Every number in its defaults is below.
The rules, step by step
- The range. The high and low of the 09:30–09:45 New York candles. A candle belongs to the window when it opens inside it. The range is final on the first candle after 09:45.
- The break. A close above the range's high (long) or below its low (short). A wick through that closes back inside doesn't count.
- The entry. The second close in a row beyond the range: a close back inside resets the count. That close is the entry price.
- The stop. The other side of the range, plus 0.1 × ATR(14). The distance from the entry to the stop is 1R.
- The targets. TP1 at 1R moves the stop to the entry. TP2 at 2R ends the trade.
- The day. One trade a day. Entries from 09:45 to 15:55, and anything still open is closed at the end of the window: at 15:55 on 5-minute candles, at 16:00 on 15-minute candles (the close of the 15:45 candle).
- Inside one candle. When a candle reaches both the stop and TP2, the stop counts first.
The indicator decides on closed candles, so a plan never appears on a forming candle and then vanishes.
The same rules fit on one printable page, with a ten-step checklist and the backtest's result: the opening range breakout checklist (PDF).
An opening range breakout example
Try it on two real gold days, with a 5, 15 or 30-minute range:
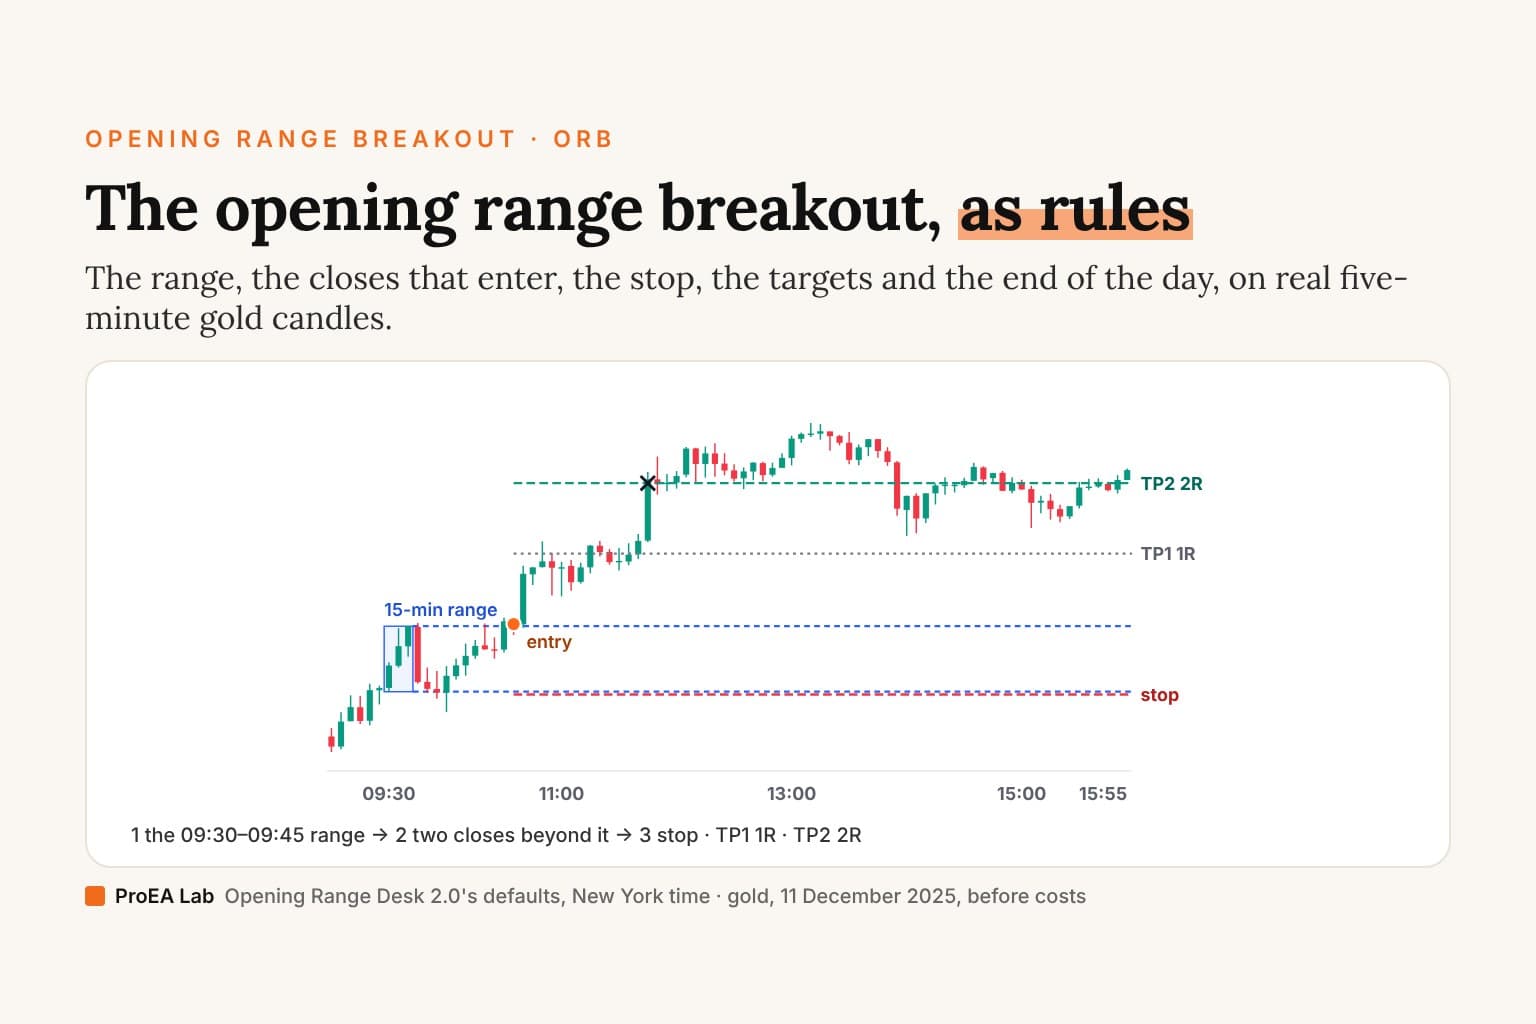
15-minute range, 11 Dec 2025: long on the 10:35 candle's close, +2.00R before costs.
The range ran 4,230.15–4,243.69 and was final at 09:45. The second close above it entered at 4,244.13, with the stop at 4,229.57, TP1 at 4,258.69 and TP2 at 4,273.25. The trade reached TP2 in the 11:45 candle.
Real gold candles (Dukascopy XAUUSD, 5-minute, New York time). The levels are Opening Range Desk 2.0's reference engine at its defaults, before costs. These two days were picked because the three ranges end differently on them: they show the mechanics, not which range is better. The study ran the 15-minute default on 15-minute candles, where the two closes are 15-minute closes: on these two days it ended at +0.76R and −1.00R before costs, and over eight months at −0.24R after costs.
5, 15 or 30 minutes?
This is the question traders ask most after "does it work". The trade-off is mechanical:
- A shorter range sets earlier, so the entry comes earlier, and the range is usually narrower, so the stop is closer. A closer stop makes the same spread and commission a bigger share of 1R.
- A longer range waits for more of the open's noise to finish, enters later, and puts the stop further away.
In our backtest's descriptive runs on gold, 1 October 2025 to 29 May 2026, after costs:
| Range | Trades | Won | After costs |
|---|---|---|---|
| 5 minutes | 170 | 34.7% | −6.00R |
| 15 minutes (the default) | 167 | 40.1% | −0.24R |
| 30 minutes | 160 | 39.4% | +1.61R |
The candle size changed too: the 5-minute range ran on 5-minute candles, the 15- and 30-minute ranges on 15-minute candles, so the two closes that entered were 5-minute closes in the first row and 15-minute closes in the others.
That is one market over eight months, with no verdict attached. It shows how much the choice moves the result, not which one works.
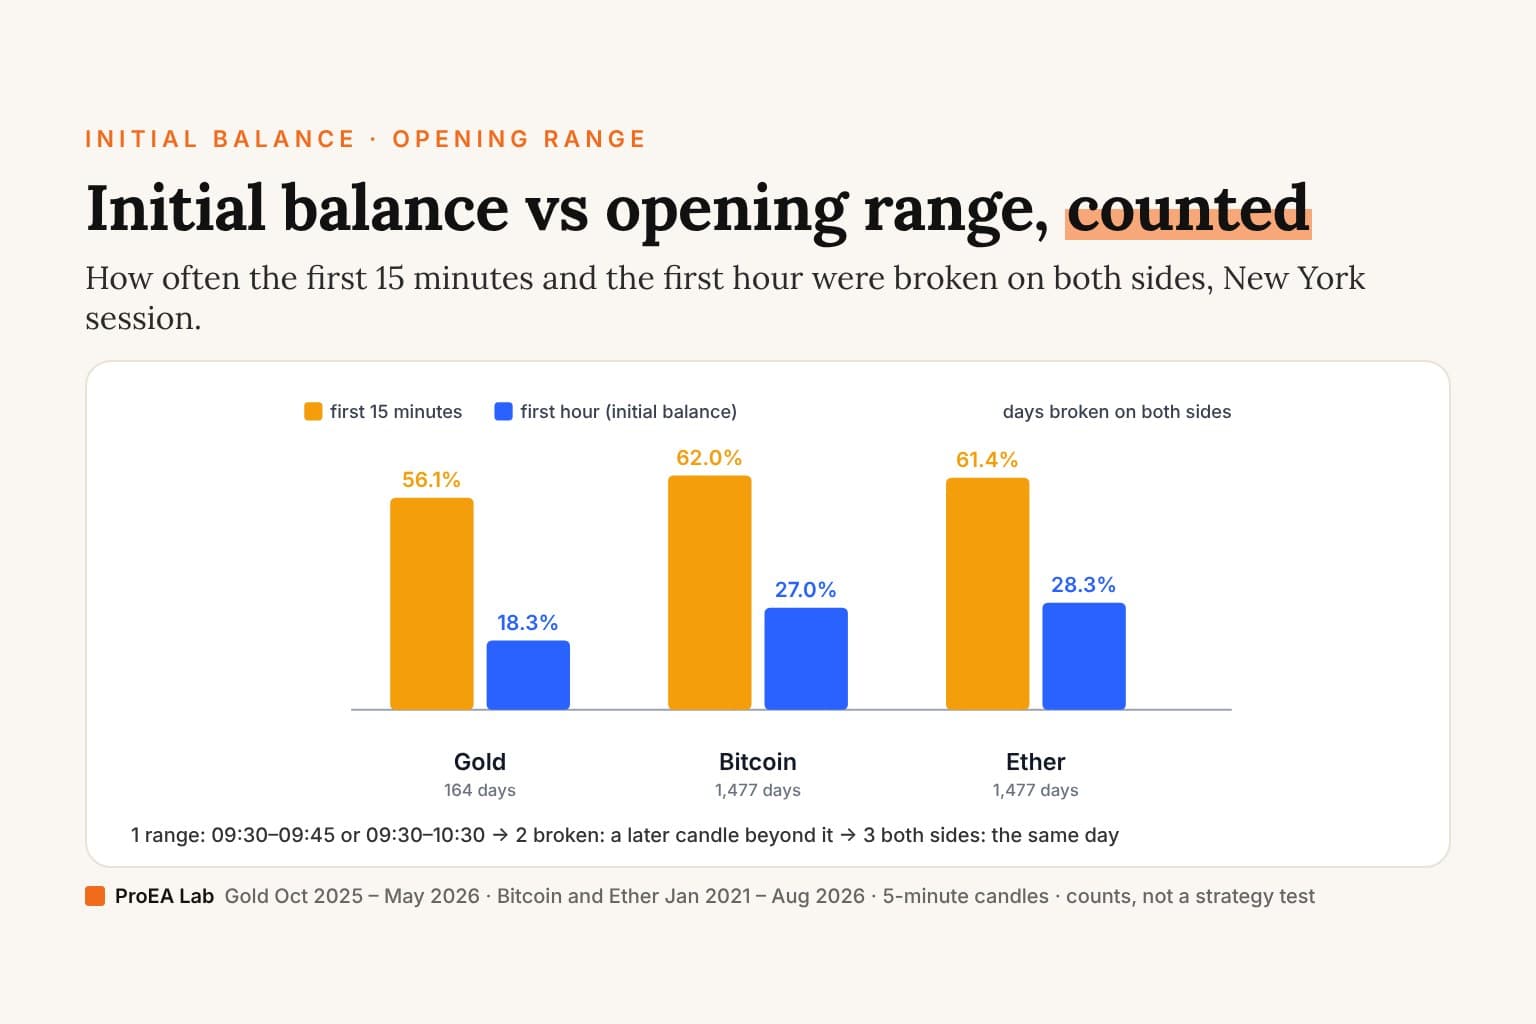
A 60-minute range is the initial balance. Initial balance vs opening range counts how often each was broken, on which side and how far, on gold, Bitcoin and Ether.
On Opening Range Desk, the window is one input: 0930-0935 is a 5-minute range, 0930-0945 15 minutes and 0930-1000 30 minutes. The chart's candles must divide the window, so a 5-minute range needs 1- or 5-minute candles. Otherwise the desk reads UNAVAILABLE instead of building the range from a bigger candle.
The first candle strategy
The first candle strategy is the opening range on one candle: the high and low of the first 5-minute or 15-minute candle from 09:30 New York, traded on a close beyond them. On a 15-minute chart, Opening Range Desk's default range, 09:30–09:45, is exactly the first candle.
Our backtest ran it that way on gold, October 2025 to May 2026, with the desk's default stop and targets: the 15-minute default on 15-minute candles, and the 5-minute range on 5-minute candles. After costs, the first 15-minute candle ended at −6.14R entering on the first close (169 trades) and −0.24R waiting for two closes (167); the first 5-minute candle, with two closes, at −6.00R (170). The 5-minute run is a description, not a judged test.
Confirmation: one close or two?
The classic ORB enters on the first close beyond the range. Opening Range Desk 2.0 waits for a second close in a row by default.
In our backtest the second close lost less than the first in all seven cells we ran: on gold −0.24R against −6.14R, and on Bitcoin's 2026 holdout −47.82R against −71.66R.
Losing less is not making money. Neither version ended above zero anywhere, and the full tables are in the study.
Breakout or retest?
Some traders wait for price to come back to the range's edge after the break and hold it: the break and retest.
Opening Range Desk has it as an entry mode. The confirming close arms a retest instead of entering. A later candle that comes within 0.25 × ATR of the edge and closes beyond it again is the entry. The retest expires after 12 candles, and fails if a candle closes back beyond the tolerance.
Our backtest didn't test the retest mode, so we have no numbers for it.
Where the stop and the targets go
- The other side of the range (the default): the classic stop. A wide range makes a wide stop.
- The range's midpoint: half a range closer, so a target in R sits closer too, and more trades stop out.
- A fixed distance: 1.5 × ATR(14) from the entry.
Every stop sits 0.1 × ATR(14) beyond its level by default, so a trade isn't stopped by the exact tick of the range's edge.
The targets can be counted in R or in range heights. Taking them in range heights ties the target to the open's size instead of to the stop.
Failed breakouts: the opening range reversal
A break that closes back inside the range is a failed breakout. Opening Range Desk marks the fake-outs on the chart with ✕: candles that poked through the range but closed inside it.
Two switches act on a failed break:
- Exit when a candle closes back inside the range, instead of waiting for the far-side stop.
- Trade the failure: after closes beyond an edge are followed by a close back inside, enter the other way at that close, with the stop beyond the furthest point of the failed break. This is what traders call the opening range reversal.
Neither switch was part of our backtest.
The same failure against the previous hour's range, read on 15-minute closes, is the subject of the false breakout explainer.
The filters traders add: VWAP, EMA, volume and gap
The common additions, each an input on the desk and each off by default:
- VWAP: longs only above VWAP, shorts only below it.
- EMA trend: longs above an EMA (200 by default, optionally from a higher timeframe), shorts below it.
- Volume: the breakout candle's volume at least 1.2 × its 20-candle average.
- Gap: longs only after a gap up from yesterday's close, shorts only after a gap down.
- Range size: skip days whose range is smaller or larger than a multiple of the daily ATR.
We haven't measured any of them. A filter that improves one sample of a few hundred trades can fail to improve the next one, so test it on data you didn't choose it on.
Which markets and sessions?
The opening range is clearest where a market really opens: US stocks and index ETFs at 09:30 New York, and the index futures that move with them.
Nasdaq (NQ), the S&P 500 (ES) and SPY
SPY and QQQ open with their stocks at 09:30 New York, so the default range is their open. The E-mini futures (ES, NQ) trade nearly around the clock (futures market hours), so on their charts the 09:30 range sits inside the session: it marks when the stocks under them start trading.
The release's check on 25 September 2026 ran the indicator on TradingView against the reference engine our backtest uses: 60 of 60 trades identical on SPY 5-minute candles. Our backtest of the Nasdaq 100 and the S&P 500 is still pending.
Futures
The same rule fits any futures chart whose candles divide the window, on the clock you set. Check each contract's session and early closes in the futures market hours before you backtest across holidays.
Gold
Gold trades nearly around the clock too. A 09:30 range on gold is a range at the New York stock open. Traders who want gold's own US session use an earlier window: one script in our ORB indicator roundup offers 08:20–17:00 New York as its "Gold U.S. Open" preset.
In our backtest, the 09:30 New York default on gold ended at −0.24R after costs over eight months.
Forex: the London and Asian sessions
Forex has no single open. Set the timezone to Europe/London for a London-open range or Asia/Tokyo for a Tokyo one, and the window to the minutes you trade (for example 0800-0815). The desk reads any IANA timezone. We haven't backtested a forex pair.
Crypto
Crypto never closes, so the 09:30 New York range is an anchor you choose, not an exchange open. In our backtest the default lost after costs in every period on Bitcoin and Ether, 2021 to August 2026: fees and funding took 0.11R to 0.24R a trade.
Stocks
US stocks open at 09:30 New York, the default. One of Opening Range Desk Pro's three grade checks, "in play", compares the opening range's volume with its own 20-session average. Its Radar lists up to eight markets by how busy their open is. Neither was part of our backtest.
Holiday early closes
On a day the market closes before 15:55, the end-of-day exit never comes, and the trade ends on the next candle the chart shows. Check the futures market hours for early closes before you trust a backtest across holidays.
Does it work?
We tested the default rule the written-first way, with the indicator's own engine, after costs: Opening Range Desk: what we measured.
- Gold, 167 trades from October 2025 to May 2026: +2.22R before costs, −0.24R after them. Rejected under the plan's rule.
- Bitcoin and Ether perpetuals, 2021 to August 2026: below zero after costs in every period, and rejected on the 2026 holdout, the period the plan judges.
- Nasdaq 100 and S&P 500: still pending.
So the default rule is a starting point to test on your own market and costs, not a strategy with a proven edge.
More questions traders ask
What time frame is best for the ORB?
The chart's candles must divide the range: for the 15-minute default, 1, 3, 5 or 15-minute candles (seconds and tick charts work too). On a minute chart whose candles don't divide it, such as 2, 10 or 30 minutes, Opening Range Desk reads UNAVAILABLE instead of building the range from a bigger candle. The candle size changes the result too, because two closes on 5-minute candles come sooner than two on 15-minute candles. We haven't tested one range on several candle sizes, so we can't say which is best.
Can you use the ORB strategy for options?
The levels come from the underlying's chart: draw the range on SPY or QQQ, and take the option trade on its breakout. An option's price also moves with time and volatility, not only with the underlying, and our backtest didn't test options, so it has no numbers for them.
Is there an opening range breakout Pine Script?
Yes. Opening Range Desk's full Pine v6 source is in Pine Pro Library. On TradingView, 143 of the 187 scripts its search returned for seven opening range and initial balance terms on 27 October 2026 were open source; the ten most-boosted ORB scripts are code-read in our roundup.
Is there an ORB scanner?
Opening Range Desk Pro's Radar runs the desk's rule on up to eight markets at once on TradingView and lists them by how busy their open is. It isn't a stock screener that searches the whole market.
Is there an ORB strategy PDF?
Yes: the opening range breakout checklist (PDF), one page with the rules at the desk's defaults, a ten-step checklist and the backtest's result. No sign-up.
What it takes by hand, every open
The rules above fit on a page. Trading them means the same jobs at every open, on every market you watch:
- The range. Work out when the window opens on your clock, then mark the range's high and low.
- The break. Watch for the first close beyond the range, then the close that confirms it.
- The setup. Judge the open: real volume behind it? A normal-size range? An early break?
- The room. Mark yesterday's high, low and close, the overnight range and last week's high and low, then measure to the next one.
- The size. Risk ÷ the stop's distance, rounded to what you can trade, for every entry.
- TP1. Close half, move the stop to the entry and keep watching the rest.
- Your markets. Keep several charts open and work out which one has volume behind it.
- The plan. Write the entry, stop, both targets, size and grade down before you click.
Opening Range Desk Pro does these on the chart and in its alerts: the range drawn for your window, a heads-up on the first close beyond it, a grade of A, B or C, the seven levels with the room in R, the size for your risk, a TP1 alert, a Radar on up to eight markets, and the whole plan in the entry alert. You place the orders.
Run it on TradingView
Opening Range Desk draws everything in this article on the chart: the range, the closes, the plan and its result. Its Strategy Lab runs the same rule in TradingView's Strategy Tester with your costs. Both files are in Pine Pro Library with their full source.
Opening Range Desk Pro runs the same engine and adds a setup grade (A, B or C, from whether the open is in play, the range's size and how early the break comes), key levels with the room to the next one in R, half off at TP1, and a Radar for up to eight markets. None of those extras was part of the backtest.
If you'd rather start with a free script, the ten most-boosted open-source ORB indicators on TradingView are code-read here. If you're weighing a paid one, we compared Big Daddy Max's MOT Advanced ORB and edgeful with ours, prices and refund terms dated.
Sources
- Toby Crabel, Day Trading With Short Term Price Patterns and Opening Range Breakout, Traders Press, 1990 (ISBN 0-934380-17-1). Cited by title: we haven't read it.
- Opening Range Desk 2.0's engine contract (
docs/engine-contract.mdin the release), the source of every rule above. - Opening Range Desk: what we measured, 27 October 2026.
Disclosure
We, ProEA Lab, build Opening Range Desk and Opening Range Desk Pro, and sell them in Pine Pro Library and the Premium Vault. The code is AI-assisted. The drill's candles are real gold prices; its levels come from the indicator's reference engine before costs. Nothing here is a forecast. Trading involves risk.
Frequently asked questions
What is the opening range breakout strategy?
You mark the high and low of the first minutes after a market opens (the opening range), then trade in the direction price closes beyond it: long above the high, short below the low, with the stop on the other side of the range. Opening Range Desk's default range is 09:30–09:45 New York.
What are the ORB strategy rules?
As Opening Range Desk writes them: the range is the 09:30–09:45 New York high and low; two consecutive closes beyond it enter; the stop is the other side of the range plus 0.1 × ATR(14); TP1 at 1R moves the stop to the entry and TP2 at 2R ends the trade; one trade a day, and anything open is closed at the end of the window, 15:55 on 5-minute candles.
Is the 5-minute or the 15-minute opening range better?
Neither proved better. A shorter range gives a smaller stop and an earlier entry, so costs take a bigger share of every trade. On eight months of gold, the 5-minute range (on 5-minute candles) ended at −6.00R after costs, the 15-minute default at −0.24R and the 30-minute range at +1.61R (both on 15-minute candles): one market, reported as a description, not a test.
Should you wait for a candle close to enter an ORB?
A close, yes: a wick through the range that closes back inside is a fake-out, not a breakout. Waiting for two closes lost less than entering on the first in all seven cells of our backtest, on gold −0.24R against −6.14R, but neither version ended above zero anywhere.
Where do you put the stop on an opening range breakout?
The classic stop is the other side of the range. Opening Range Desk adds 0.1 × ATR(14) beyond it by default, and offers the range's midpoint or a stop 1.5 × ATR from the entry instead. A midpoint stop is half a range closer, so a target in R sits closer too.
Does the opening range breakout work on gold or Bitcoin?
Not after costs, in our written-first backtest of the default rule. On gold it took 167 trades from October 2025 to May 2026 and ended at −0.24R; on Bitcoin and Ether perpetuals it lost in every period from 2021 to August 2026.
What is the first candle strategy?
The opening range on one candle: the high and low of the first 5-minute or 15-minute candle from 09:30 New York, traded on a close beyond them. On gold, October 2025 to May 2026, with Opening Range Desk's default stop and targets, the first 15-minute candle ended at −6.14R after costs entering on the first close (169 trades) and −0.24R waiting for two (167); the first 5-minute candle, with two closes, at −6.00R (170), a description rather than a judged test.
Who invented the opening range breakout?
The phrase is in the title of Toby Crabel's 1990 book, Day Trading With Short Term Price Patterns and Opening Range Breakout (Traders Press). We cite the book by its title only: we haven't read it, so this article doesn't say what it teaches.