Short answer: there is no best setting for UT Bot Alerts, only trade-offs. The original, UT Bot Alerts by QuantNomad (61,303 boosts), has three inputs. Key Value (default 1) times the Average True Range over ATR Period candles (default 10) is how far its trailing line sits from the close; Signals from Heikin Ashi Candles (off) swaps the close for the average of each candle's open, high, low and close. A bigger Key Value sits further away and flips less often, and later; a smaller one flips on smaller moves. ATR Period mostly sets how quickly that distance follows the size of the candles. Whatever you set, its Buy and Sell are judged on the live candle, so set its alerts to Once per bar close.
Most settings guides give you numbers.
This one reads the code.
What we read
We searched TradingView's scripts for "ut bot" and "ut bot alerts" on 31 October 2026, which returned 40 scripts with UT Bot in the name: 32 open source, 4 protected and 4 invite-only. The original, QuantNomad's UT Bot Alerts, is the most boosted by far, with 61,303; the next, Yo_adriiiiaan's UT Bot, has 14,635. We read the original line by line: it's a short script in Pine version 4, an indicator (study()), with no licence line. We also read the settings, and when each decides, of the ten other open-source scripts above 1,700 boosts, down to UT Bot Alerts [2026 Elite Edition] at 1,732. Every number below is from that code, or from the drill's simulated candles, which are labelled as such.
UT Bot Alerts is Pine Script, so it runs only on TradingView. An MT4 or MT5 "UT Bot" is someone else's rewrite in MQL, a different program, and nothing here describes one.
The three inputs
| Input, as its settings box shows it | Default | In the code | What it changes |
|---|---|---|---|
| Key Vaule. 'This changes the sensitivity' | 1 | a = input(1, …), then nLoss = a * xATR | The multiple of ATR between the source and the line. A whole number: the default has no decimal point, and Pine version 4 takes an input's type from its default |
| ATR Period | 10 | c = input(10, …), then xATR = atr(c) | How many candles the Average True Range is averaged over. ATR(1) is just the current candle's true range |
| Signals from Heikin Ashi Candles | Off | h = input(false, …), then src = h ? security(heikinashi(syminfo.tickerid), timeframe.period, close, lookahead = false) : close | The source: the close, or the Heikin Ashi close, (open + high + low + close) ÷ 4. The ATR stays on the chart's own candles either way |
So the distance is nLoss = Key Value × ATR(ATR Period), and everything else is one rule for the line and one for the labels.
The line ratchets. Each candle, the script compares the source with where the line was (below, "close" means the Heikin Ashi close when that's on):
- While this close and the last are both above the line, the line is the higher of where it was and close − Key Value × ATR. It only rises.
- While both are below it, the line is the lower of where it was and close + Key Value × ATR. It only falls.
- When a close crosses it, it jumps to the other side: close − Key Value × ATR after a close above it, close + Key Value × ATR after one below.
In the code that's one nested iff(), with nz(xATRTrailingStop[1], 0) standing for the line's last value.
Buy and Sell are the crossing. buy = src > xATRTrailingStop and above, where above = crossover(ema, xATRTrailingStop) and ema = ema(src, 1), a one-candle average, which is the source itself. So a Buy is the close crossing above the line and a Sell the close crossing below it: a flip. The script then colours candles green while the source is above the line and red while it's below (barcolor).
It draws no line. Its only drawings are the Buy and Sell labels and the candle colours; the line is computed, and a colour for it too, but never plotted. The line you see on other versions (Yo_adriiiiaan's UT Bot plots it, and so do UT Bot v2 and the 2026 Elite Edition) and in the drill below is the one this code computes.
Move them yourself
The drill runs the original's rule on 24 hours of simulated 15-minute candles. Move Key Value and ATR Period, switch the source, and count the flips.
The original's Key Value box takes whole numbers; the half steps are for the variants whose Key Value takes decimals.
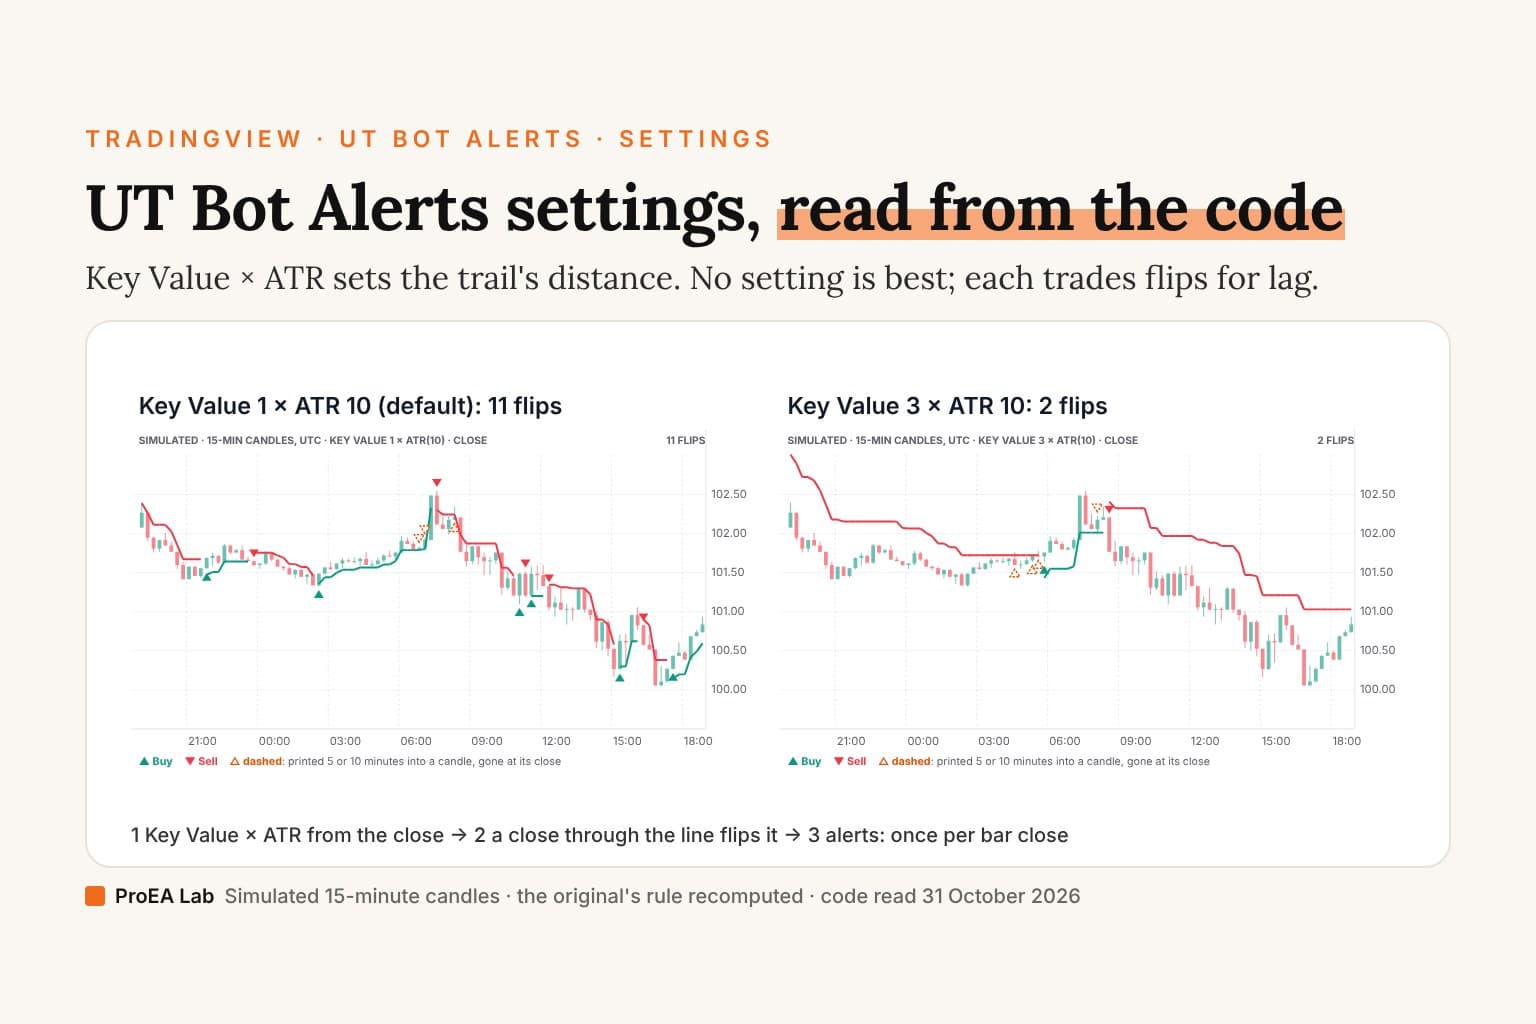
Key Value 1 × ATR(10), close: 11 flips in 24 simulated hours.
The line sat a median 0.18 from the close, on prices near 100. 3 more labels printed 5 or 10 minutes into a candle and were gone at its close (dashed). The same candles at Key Value 1: 11, 2: 5, 3: 2 (ATR 10, the close).
Simulated 15-minute candles, not market data: a window of the seeded market our structure films use. The first 156 back-to-back 15-minute candles of the simulated market (60 to warm the ATR up, 96 shown) whose shown candles span no more than 14 times their median high-to-low range, so each candle shows at the chart's scale, and in which, at the original's defaults (Key Value 1, ATR Period 10, the close), the shown candles carry 4 to 14 flips and at least one Buy or Sell that printed 5 or 10 minutes into a candle and was gone at its close; Key Value 2 gives fewer flips than 1 and Key Value 3 fewer than 2, but at least one; and ATR Period 1 and the Heikin Ashi close each give a different count from the defaults'. The line, the flips and the dashed marks are the original's own code recomputed here (Key Value × ATR, the ratchet, Buy and Sell on the cross); the original draws no line, only the labels and the candle colours. Live readings are taken 5 and 10 minutes into each candle, not on every price update, so a real chart can show more. The flip count shows the mechanics, not which setting is better: no trades and no costs are counted.
Read as text: the flips at Key Value 1 × ATR(10), close
- Buy at the 21:45 candle's close: the close, 101.680, crossed the line's last value, 101.664.
- Sell at the 23:45 candle's close: the close, 101.590, crossed the line's last value, 101.636.
- Buy at the 02:30 candle's close: the close, 101.480, crossed the line's last value, 101.459.
- A Sell printed 5 minutes into the 06:45 candle and was gone at its close (dashed).
- A Sell printed 5 minutes into the 07:00 candle and was gone at its close (dashed).
- Sell at the 07:30 candle's close: the close, 102.110, crossed the line's last value, 102.322.
- A Buy printed 5 minutes into the 08:15 candle and was gone at its close (dashed).
- Buy at the 11:00 candle's close: the close, 101.480, crossed the line's last value, 101.454.
- Sell at the 11:15 candle's close: the close, 101.200, crossed the line's last value, 101.211.
- Buy at the 11:30 candle's close: the close, 101.480, crossed the line's last value, 101.475.
- Sell at the 12:15 candle's close: the close, 101.050, crossed the line's last value, 101.196.
- Buy at the 15:15 candle's close: the close, 100.620, crossed the line's last value, 100.575.
- Sell at the 16:15 candle's close: the close, 100.570, crossed the line's last value, 100.616.
- Buy at the 17:30 candle's close: the close, 100.430, crossed the line's last value, 100.374.
At the original's defaults the line flips 11 times on these candles. Key Value 2 cuts that to 5 and Key Value 3 to 2: each step puts the line further from the close, so a flip needs a bigger move and comes later, after the price has gone further against the old direction. ATR Period doesn't work that way. At Key Value 1, ATR Period 1 gives 13 flips and ATR Period 50 gives 15: a longer ATR is a slower one, not a wider one. How far the line sits is mostly Key Value's doing; ATR Period decides how quickly that distance reacts when candles grow or shrink. The Heikin Ashi close gives 7 flips at the defaults: it averages each candle, so here it crosses the line less often.
When it decides: the live candle and the alerts
The original never waits for a candle to close. There's no barstate.isconfirmed in it and no close-only alert setting. On the live candle the close is the current price, so the line, the label and the candle colour are recomputed on every price update. A Buy can print mid-candle and be gone when the candle closes, and after a reload the chart's history doesn't show it (how to tell if an indicator repaints). In the drill the dashed marks are those labels: at the defaults, 3 printed 5 or 10 minutes into a candle and were gone at its close.
Its two alerts leave the timing to you. They are alertcondition(buy, "UT Long", "UT Long") and alertcondition(sell, "UT Short", "UT Short"). With an alertcondition, the alert's Trigger decides: Once per bar fires as soon as a Buy appears on the live candle, even one that vanishes; Once per bar close fires only if it's still there when the candle closes (the difference, with a film). For UT Bot Alerts, choose Once per bar close, and read a label only once its candle has closed.
Some versions wait for the close. QuantNomad's UT Bot Strategy and UT Bot Strategy with Backtesting Range are the same rule as strategy() scripts without calc_on_every_tick, so they decide at the candle's close and fill at the next open. If you want the same trail decided on closed candles, for its labels and its alerts both, QuantNomad's own UT Bot v2, also open source, waits for barstate.isconfirmed and sends its alerts once per bar close (its row in our ATR trailing stop roundup). PDK1977's version waits for the close for its alerts, not for its labels. The 2026 Elite Edition sends its alert() messages once per bar close, while its labels and its two alertconditions are judged live. boanerg73's alert messages say "Confirmed", but nothing in its code waits for the close. StrategiesForEveryone's strategy sets calc_on_every_tick = true, so in real time it decides on every price update. SeaSide420's UT Bot v5 reads the candle's open by default, a price that doesn't change while the candle trades (its input is titled "Price Source (recommended OPEN to avoid repainting)"), and as a strategy without calc_on_every_tick it decides at the close.
What the popular settings change
The variants' defaults are where most "best settings" come from. Boosts as TradingView's search showed them on 31 October 2026.
| Script | Boosts | Key Value | ATR Period | Source | What else it changes |
|---|---|---|---|---|---|
| UT Bot Alerts (QuantNomad), the original | 61,303 | 1 | 10 | The close; Heikin Ashi optional | Nothing: this is the rule |
| UT Bot (Yo_adriiiiaan) | 14,635 | 3 (step 0.5 in its code) | 10 | The close | Draws the line; colours every candle |
| UT Bot Strategy (QuantNomad) | 9,044 | 1 | 10 | The close; Heikin Ashi optional | A strategy: long on Buy, short on Sell |
| UT Bot + LinReg Candles (Dual Sensitivity) (PDK1977) | 7,482 | 2 for Buy, 2 for Sell | 1 and 1 | The close | Separate Buy and Sell trails (their lines hidden by default); linear regression candles |
| UT Bot Strategy with Backtesting Range (QuantNomad) | 6,413 | 1 | 10 | The close; Heikin Ashi optional | The strategy, with a date range |
| Strategy for UT Bot Alerts indicator (StrategiesForEveryone) | 4,234 | 3 | 1 | The close; Heikin Ashi optional | Buys only above a 200-period EMA and sells only below it; its own stop and take-profit |
| UT Bot v5 (SeaSide420) | 3,457 | 1, in steps of 0.1 | 11 | The open; Heikin Ashi optional | A 2-period Hull average of the source crosses the line; long only by default |
| UT Bot Alerts – Time Filtered with Exits (boanerg73) | 3,362 | 2 | 7 | The close; Heikin Ashi optional | A cross must clear the line by 0.2 ATR, with the source rising (or falling); exit signals |
| UT Bot Stochastic RSI (Rajjariorr) | 1,749 | 2 | 3 | The close | Alerts on whichever of its signal versions made the most on the chart's own history; Buy and Sell labels off by default |
| UT Bot Alerts [2026 Elite Edition] (jahigginsenterprises) | 1,732 | 2 for Buy, 2 for Sell | 300 for Buy, 1 for Sell | The close; Heikin Ashi optional | The Buy pair sets the line in a downtrend, the Sell pair in an uptrend |
The one of the ten left out of this table, QuantNomad's UT Bot v2 (2,588 boosts), is the same trail rewritten in Pine version 6, with a multiplier that takes decimals (1 × ATR(10) by default) and a row in our ATR trailing stop roundup. Four kinds of advice come out of these defaults, and each is a trade-off:
- A bigger Key Value, 2 or 3. Fewer flips, later. On the drill's candles 2 × ATR(10) flips 5 times and 3 × ATR(10) twice, against 11 at the default. What the wider line costs is the distance: when the trend does turn, the price has to travel further back before it flips.
- ATR Period 1. The distance becomes Key Value times the current candle's own true range. On a quiet candle the line ratchets right up to the price; on a big one it may not move at all. PDK1977's 2 × ATR(1) flips 7 times on the drill's candles and StrategiesForEveryone's 3 × ATR(1) 5 times.
- One setting for each side. The 2026 Elite Edition's line uses 2 × ATR(300) in a downtrend, the line a Buy must cross, and 2 × ATR(1) in an uptrend, the line a Sell must cross. An ATR over 300 candles barely moves within a session, while ATR(1) follows every candle. That's a different rule from the original's, not a setting of it, so the drill can't show it.
- Heikin Ashi on. On the drill's candles it gives 7 flips at the defaults instead of 11, and the drill's 5- and 10-minute readings caught no vanishing label at that setting, though it reads the live candle the same way. The Heikin Ashi close isn't a price that traded: a Buy can print while the real close is still below the line.
Scalping advice usually means smaller or faster: a lower Key Value, ATR Period 1, a 1- or 5-minute chart. Each does the same thing: more flips, each on a smaller move, and more labels printed and lost on the live candle. A Key Value of 0.5, which only the variants with decimals allow, flips 27 times on the drill's candles. Every flip you act on is a trade that pays the spread and commission, and on short candles those are a bigger share of each move.
UT Bot Stochastic RSI goes a step further: it backtests several versions of its signal on the chart's own history and alerts on the one that made the most (or won most often: Profit is the default, Winrate the other choice). That choice is made on the same candles it's judged on, so it can't tell you how that version does on candles it hasn't seen.
Check one yourself
- Fix the settings first. Pick three before you look: the default 1 × ATR(10) and two you'd really use.
- Pick on one stretch, check on another. On an early stretch of your market's history, count each setting's flips and how far price went against the line before each one; pick one. Then run it on a later stretch it never saw, with your spread and commission on every flip.
- Read the type of Key Value.
input(1in Pine version 4 with no decimal step, orinput.int(, takes whole numbers;input.float(takes decimals. - Find when it decides. Look for
barstate.isconfirmedaround the signal,alert.freq_once_per_bar_closeon analert(), or astrategy(call withoutcalc_on_every_tick. Without one of them, a label you see live may not be there when the candle closes. - Find the source.
closeis the default;heikinashi(swaps in the Heikin Ashi close; an input set toopenreads the candle's open.
Ours
Drift Desk isn't on TradingView's search: its full Pine v6 source, under MIT, comes in Pine Pro Library, $49 once. It's an ATR trailing stop that flips on a close, like UT Bot, but built the SuperTrend way, and shifted by candle pressure. Its band rule next to UT Bot's, from its source (version 1.5.0):
| UT Bot Alerts | Drift Desk | |
|---|---|---|
| Measured from | The close, or the Heikin Ashi close | The candle's average of high, low and close (hlc3), shifted by up to 1.5 ATRs toward the candle pressure |
| Distance | Key Value × ATR(10), Key Value 1 by default | 2 × ATR(14) |
| Lines | One, which jumps to the other side on a flip | Two bands, upper and lower, both tracked on every candle; the trail is the lower in an uptrend, the upper in a downtrend |
| Ratchet | While this close and the last stay on its side | While the last close stays on its side |
| After a flip | A new line, Key Value × ATR from the close that flipped it | The other band, as it had already ratcheted |
| Flips on | A close through the line's last value | A close through the band's last value |
| Decides on | The live candle | Closed candles (barstate.isconfirmed) |
| Heikin Ashi | An option | None |
| Alerts | UT Long, UT Short | Trail flip, long or short plan, 1R, plan resolved; a JSON plan once per bar close |
The pressure is read from where each close sits in its candle's range (60%) and the body's share of the range (40%), weighted by relative volume capped at 3; an 8- and a 21-period EMA of it, their spread divided by its 50-candle standard deviation, give a drift score between −3 and +3. The centre is hlc3 + drift × ATR × 0.5. So buying pressure lifts both bands and selling pressure lowers them: in an uptrend the trail ratchets up faster while buyers press, and more slowly, or not at all, while sellers press, since it loosens only after a close below it. UT Bot has no such lean: its line hangs from the close alone. Neither rule is shown here to be the better one.
A Drift flip is a candidate, not an order: it becomes a paper plan only when its checks pass, with a stop set once beyond the low or high of the 10 candles before it, plus 0.25 ATR, and a target at 2R. We tested Drift's band, as its version 1.3.1 drew it, the written-first way on 20 Binance coins at 4 hours. In the study's own words, the rule "failed its gate": after costs the both-ways rule lost on 20 coins, and on the untouched coins holding long made more than the long-only version. The whole test is in Drift Desk: what we measured. That's Drift's rule, not UT Bot's: we haven't tested UT Bot.
Drift Desk Premium, $49 once, does the work around each flip on the chart: it reads the bigger trend, waits for the pullback, sizes the plan to your lot step with the fees in R, manages the stop (break-even and half off at 1R, then the Drift trail) and scans a 20-symbol watchlist with one alert. Premium is a toolset: its signals are not proven to earn more. Test them on your own market.
Limits
One code read, on 31 October 2026, of the versions TradingView served that day. Scripts change, and boosts measure popularity, not quality. We read every line of the original and of the variants' settings and signal timing, not every line of what they add. The drill's candles are simulated, and its flip counts show how the settings move the line, not results: no trades and no costs are counted. Its live readings are taken 5 and 10 minutes into each candle, so a real chart can print and lose more labels than it shows. Pine runs only on TradingView. We build and sell Drift Desk and Drift Desk Premium, and we have no relationship with any author named here. Nothing here is financial advice.
Frequently asked questions
What are the best settings for UT Bot Alerts?
There is no best setting, only trade-offs. The original's defaults are Key Value 1, ATR Period 10 and Heikin Ashi off. A bigger Key Value puts the trailing line further from the close, so it flips less often and later: on our simulated candles, Key Value 1, 2 and 3 gave 11, 5 and 2 flips. ATR Period sets how quickly that distance follows the size of the candles. To choose, fix a few settings in advance, pick one on an early stretch of your market and check it on a later stretch it never saw, after costs.
What are the best UT Bot Alerts settings for scalping?
There's no best one. Scalping advice usually means a smaller Key Value, ATR Period 1 or a short timeframe, and each does the same thing: more flips, each on a smaller move, and more Buy and Sell labels that print on the live candle and are gone at the close. On our simulated candles, ATR Period 1 gave 13 flips against the default's 11, and a Key Value of 0.5, which only the variants with decimals allow, gave 27. Every flip you act on is a trade that pays the spread and commission.
What does Key Value mean in UT Bot Alerts?
It's the multiple of ATR between the close and the trailing line. The line sits Key Value × ATR below the close in an uptrend and above it in a downtrend, only tightens until a close crosses it, then jumps to the other side. In the original it's a whole number, 1 by default, and its settings box spells it Key Vaule.
How do I set up UT Bot Alerts on TradingView?
Add it to the chart from the Indicators search, then create an alert on its condition, UT Long or UT Short, with the trigger set to Once per bar close. The script judges Buy and Sell on the live candle, so with Once per bar an alert can fire on a label that is gone by the close: on our simulated candles, 3 labels at the defaults printed mid-candle and vanished.
Is UT Bot Alerts free?
Yes. QuantNomad's UT Bot Alerts is open source on TradingView: free to add, with its code public and no licence line. It had 61,303 boosts on 31 October 2026, the most of the 40 scripts with UT Bot in the name.
Is there UT Bot Alerts for MT5?
Not this script: it's written in Pine Script, which runs only on TradingView. An MT5 version is someone else's rewrite in MQL5, a different program, so read its code before you assume it does what the original does.
Which ProEA indicator works like UT Bot?
Drift Desk, in Pine Pro Library, $49 once with its full Pine v6 source. It's an ATR trailing stop that flips on a close too, but SuperTrend-style: two bands 2 × ATR(14) either side of the candle's average price, shifted by candle pressure, decided on closed candles only. Drift Desk Premium, $49 once, adds the bigger trend, a wait for the pullback, size and fees, managed stops and a 20-symbol scanner. Premium is a toolset: its signals are not proven to earn more.