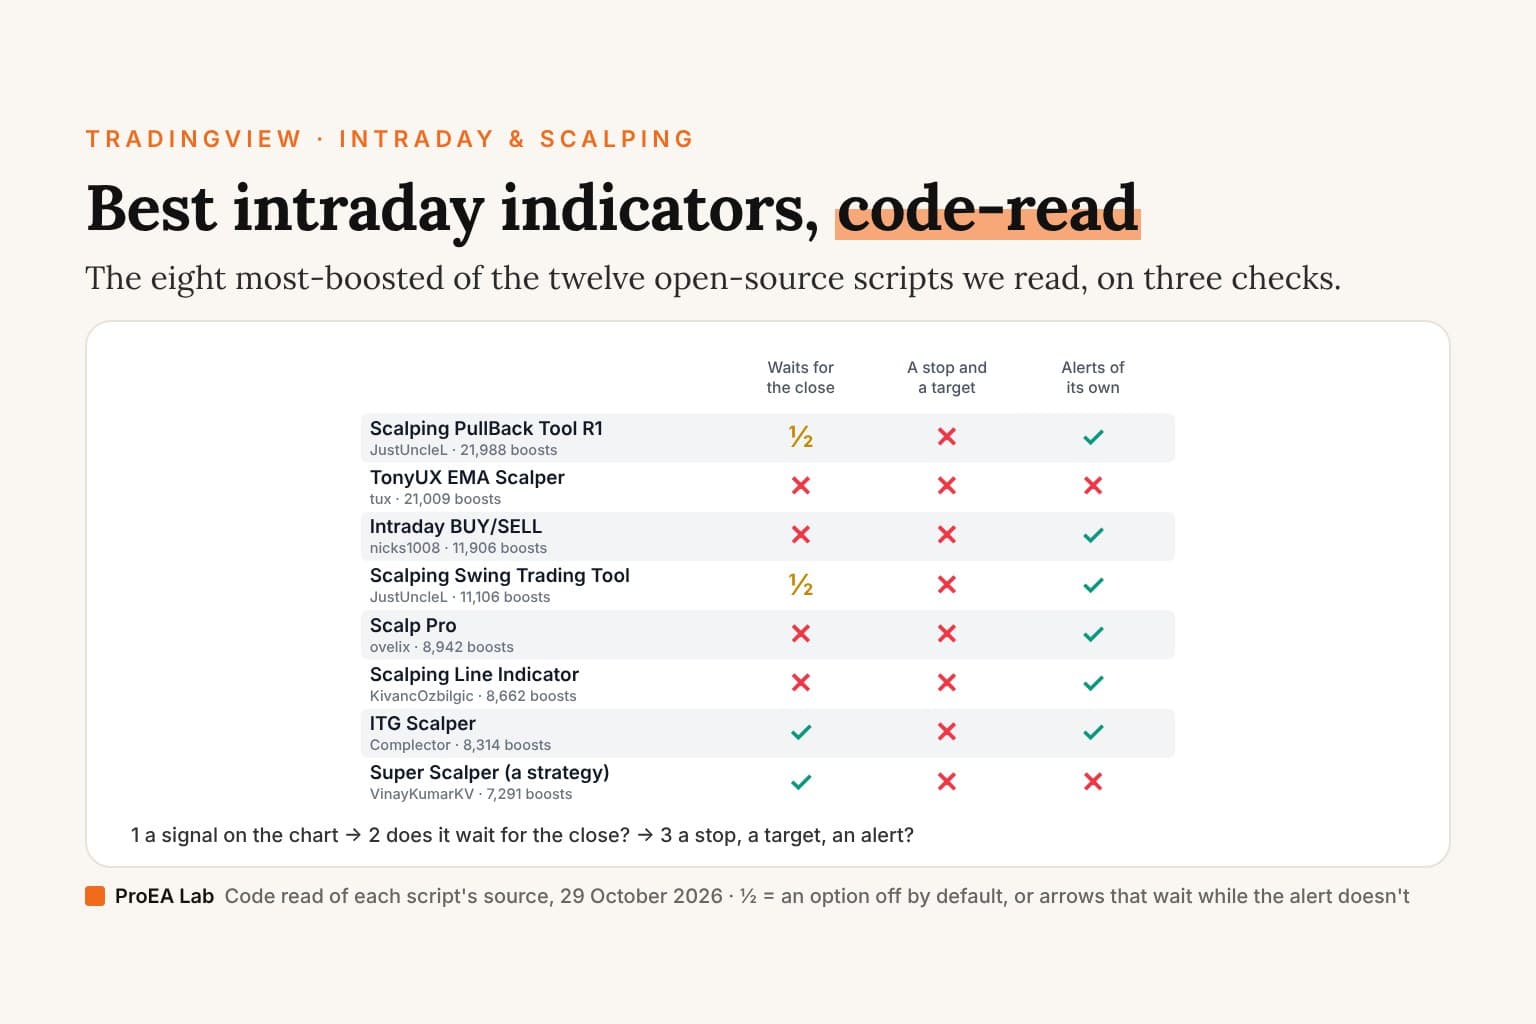
Short answer: none of the 12 most-boosted open-source intraday and scalping scripts on TradingView gives a stop and a target with its signal. The two at the top, JustUncleL's Scalping PullBack Tool (21,988 boosts) and tux's TonyUX EMA Scalper (21,009), decide on the live candle. Complector's ITG Scalper (8,314) is the only one whose signals wait for a closed candle in its own code, with an alert for each; it has no stop, so that part is yours. For intraday levels, start with what TradingView builds in, its VWAP on the Session anchor, and an opening range that starts at NSE's 09:15. And before any scalp: on Zerodha's charges page, one Nifty option lot bought and sold at the same ₹100 costs ₹62.61, about 0.19R on a 5-point stop.
Most lists name intraday indicators.
This one reads them.
What we checked
We searched TradingView's scripts for 22 terms on 29 October 2026, among them "intraday indicator", "scalping indicator", "nifty intraday", "nifty scalping", "vwap" and "opening range", which returned 561 scripts. 313 have intraday or scalp in their name, and 187 of those are open source. We took the 12 most-boosted of the 187, down to 6,131 boosts, with none skipped, and read every line that decides a signal, a level, a stop, a target or an alert. Five questions:
- The close: is a signal decided on a closed candle, or on the live one?
- Repainting: does it read another timeframe or a future candle, or draw something back in time?
- The plan: does a signal come with a stop and a target?
- Strategies: does it have one, and with what costs?
- Alerts: what can it send you?
The most-boosted script in the whole search is closed: profitprotrading's Pro Scalper (27,088 boosts) is invite-only. serkany88's Agressive Scalper Strategy (7,050) is protected. We can't read either.
For the session, we also read the five most-boosted open-source scripts with VWAP in their name and the four most-boosted with "opening range" in theirs, for one question each: where does the day start?
The table
Boosts as TradingView's search showed them on 29 October 2026.
| Script | Boosts | The signal, by default | Stop and target | Decides on | Alerts |
|---|---|---|---|---|---|
| Scalping PullBack Tool R1 by JustUncleL | 21,988 | A Heikin Ashi candle closing back out of a 34-candle EMA channel after a pullback into it, with the trend | None | The live candle; closed-candle arrows are an option, off | Buy, Sell |
| TonyUX EMA Scalper - Buy / Sell (tux) | 21,009 | A close across the 20-candle EMA | None | The live candle | None |
| Intraday BUY/SELL (nicks1008) | 11,906 | A candle closing across the 70-candle SMA, then a candle that extends it | None | The live candle | Buy, Sell, either, and three for its RSI marks |
| Scalping Swing Trading Tool R1-4 by JustUncleL | 11,106 | Swing arrows, off by default: a green candle closing above a 10-candle EMA channel | None | Alerts on the live candle; arrows a candle later | Swing up, swing down |
| Scalp Pro (ovelix) | 8,942 | In its own pane: a cross of two smoothed lines of the close | None | The live candle | Buy, Sell |
| Scalping Line Indicator (KivancOzbilgic) | 8,662 | In its own pane: a line crossing zero, with no mark on the chart | None | The live candle | Buy, Sell |
| ITG Scalper (Complector) | 8,314 | A 14-candle triple EMA turning, with a MACD filter; buys and sells alternate | None | Closed candles | Buy, Sell |
| Super Scalper - 5 Min 15 Min (VinayKumarKV) | 7,291 | A strategy: a candle whose body is bigger than its average true range, with RSI(25) on its side of RSI(100) | Worked out, never used | Each close (a strategy) | None of its own |
| CCI Stochastic and a quick lesson on Scalping & Trading Systems (Daveatt) | 6,798 | In its own pane: a stochastic of CCI(28) crossing 20 and 80 | None | The live candle | Six, two of them off |
| _CM_High_Low_Open_Close_Weekly-Intraday (ChrisMoody) | 6,699 | None: today's open, high, low and close | None | — | None |
| 10x Bull Vs. Bear VP Intraday Sessions [Kioseff Trading] (KioseffTrading) | 6,367 | None: volume profiles for four 6-hour ranges in UTC | None | — | None |
| Intraday Volume Swings (rumpypumpydumpy) | 6,131 | None: zones from yesterday's volume swings | None | Alerts on the last closed candle | Four |
| Pro Scalper (profitprotrading) | 27,088 | Invite-only: we can't read it | — | — | — |
| Agressive Scalper Strategy (serkany88) | 7,050 | Protected: we can't read it | — | — | — |
One of the 12 is a strategy, and its costs are whatever its strategy( line sets:
| Strategy | Trades | Size, by default | Commission | Slippage | Stop and target |
|---|---|---|---|---|---|
| Super Scalper | Long and short, each entry reversing the last | Not set | None | None | Worked out and never used |
None of the 12 gives a stop and a target with its signals. Eight send an alert of their own, and only ITG Scalper decides every signal on a closed candle in its own code.
What the code says
JustUncleL's Scalping PullBack Tool calculates on Heikin Ashi candles. Its code calls it "Scalping PullBack Tool R1.1 by JustUncleL". Its price action channel is the 34-candle EMA of the high, the low and the close. The trend is up when the 89-candle EMA is above the 200 and so is the channel's low; a 600-candle EMA is drawn too, hidden by default. A Buy needs that uptrend and a candle that opens below the channel's top and closes above it, having closed below the channel's middle within the last 3 candles; a Sell mirrors it. "Use Heikin Ashi Candles in Algo Calculations" is on by default, and its own comment says Heikin Ashi candles "will show a cleaner/smoother looking candle trend but not show true prices". The arrows are decided on the live candle unless you switch on "Show Alert Arrows Only on Closed Candles", which is off. Its fractal triangles are drawn two candles back, on the high or low they mark. Two alerts, Buy Condition and Sell Condition. No stop and no target. Pine v4, no licence line.
tux's TonyUX EMA Scalper is a close across a 20-candle EMA. As we found in the buy/sell roundup: "Buy" when the close crosses above the 20-candle EMA of the close, "Sell" when it crosses below, and lines at the highest and lowest close of the last 8 candles that no signal uses. Decided on the live candle. No stop, no target, no alerts and no licence line. Pine v1 (it has no version line).
nicks1008's Intraday BUY/SELL is a crude oil script. Its code calls it "CRUDE OIL BUY/SELL", short title "CRUDE Scalp |3 Min". "B" prints when the previous candle was green and closed above the 70-candle simple average after the one before it closed at or below, and the live candle is green with a higher high; "S" mirrors it on a red candle whose low crossed under the average. Yellow "!" marks print when RSI(14) crosses back under 80, or back over 20 on a green candle. Six alerts. No stop and no target. Decided on the live candle. Pine v5, MPL 2.0.
JustUncleL's Scalping Swing Trading Tool is built for a 15-minute and a 1-minute pane. Its code calls it "Scalping Swing Trading Tool R1-6 by JustUncleL", and its comment says it is "designed for a two pane TradingView chart layout", with "the first pane set to 15min Time Frame" and "the second pane set to 1min Time Frame(TF)". It draws a channel of the 5- and 11-candle EMAs, a ribbon from the 12-candle EMA to the 36, and slow EMAs of 89, 200 and 633 candles, swapped for shorter ones on a 1-minute chart. Its pivots are on by default and drawn 3 candles back, on the swing, with the candles around it numbered. Its swing arrows ("Show PAC Swing Alerts") are off, but its two alerts, "SCAPSWING alert Up" and "SCAPSWING alert Down", are always there: a green candle closing above the top of a 10-candle EMA channel after the last close was below it, with the channel's middle above the 200-candle EMA ("Filter PAC Alerts with 200ema", on). The alert is decided on the live candle; the arrow, when on, appears a candle later. Its security calls are commented out ("Removed security calls for sources, problematic"). No stop and no target. Pine v3, no licence line.
ovelix's Scalp Pro crosses two smoothed lines in its own pane. It runs two smoothing filters on the close, 8 and 10 candles long, multiplies their difference by 10,000,000, and smooths that over 8 candles. "Buy" prints in its pane where the difference crosses above its smoothed line, "Sell" where it crosses below. Its two alerts are titled in Turkish, "Alış!" and "Satış". A strategy( line sits in it, commented out. No stop and no target. Decided on the live candle. Pine v2, no licence line.
KivancOzbilgic's Scalping Line alerts but marks nothing. In its own pane, the line is the 7-candle simple average of the close minus a main average: a 51-candle average of a 50-candle average, replaced by the close itself whenever the two are within 1% of each other. So inside that 1% band, the line is the 7-candle average minus the close, and its "BUY ALARM!" fires when the close dips under its own 7-candle average. Two alerts, "BUY ALARM!" and "SELL ALARM!", on the line crossing zero; nothing is drawn on the price chart. Decided on the live candle. No stop and no target. Pine v4, MPL 2.0.
Complector's ITG Scalper waits for the close. Its code calls it "ITG Scalper Buy/Sell [Complector]". It takes a 14-candle triple EMA of the chart's real close: it rebuilds the ticker so a Heikin Ashi chart doesn't change the price that average reads ("Get real close price"). A buy needs the triple EMA turning up and the MACD (12 and 26) at or above its 9-candle simple average; a sell needs it turning down with the MACD below. Buys and sells alternate, and every signal requires barstate.isconfirmed, so it is decided on the closed candle. The sell label is red when it sells above the last buy price and yellow when it doesn't, a comparison with no costs. Two alerts, "Buy alert" and "Sell alert". Its MACD can be read from another timeframe instead (60 minutes, off by default), and then it follows that timeframe's forming candle. No stop and no target. Pine v4, MPL 2.0.
VinayKumarKV's Super Scalper works out a stop and a target, then never uses them. It is a strategy. Its bands are the close plus and minus the 14-candle weighted average of the true range, so its "Buy" label marks a candle that closes more than that average above its open, and "Sell" the reverse. On a Buy candle it enters long if RSI(25) is above RSI(100); on a Sell candle, short if it's below. It computes stopLoss = low - atr * 2 and takeProfit = high + atr * 5, but passes neither to an exit order, so a trade lasts until the opposite entry reverses it. "Golden Crossover" labels mark crosses of the 21- and 65-candle EMAs and enter nothing. Its strategy( line sets no size, no commission and no slippage, and nothing in its code limits it to the 5 or 15 minutes in its name. Pine v5, no licence line.
Daveatt's CCI Stochastic arrows the extremes. Its code calls it "CCI Stochastic". In its own pane it runs a 28-candle stochastic on CCI(28), smoothed over 3 and 3. "Trend Enter Buy" marks the line crossing down under 20 and "Trend Enter Sell" crossing up over 80; "Trend Exit" arrows mark it coming back. Six alert conditions, two of them for 50-line arrows that are off by default. No stop and no target. Decided on the live candle. Pine v4, no licence line.
ChrisMoody's High Low Open Close shows each past day's final levels from its first candle. It has no version line, so it is Pine v1 ("Created By ChrisMoody on 6-14-2014 -- Updated 1-29-2015"). By default it plots today's open, high, low and close from security(tickerid, 'D', high) and the same call for the others; yesterday's levels and the weekly, 4-hour, 2-hour and 1-hour ones are off. TradingView's own migration guide uses that call as its example of looking into the future: "At the first bar of every session an indicator plots the high price of the entire day." The same guide says barmerge.lookahead_on was "the default for Pine Script version 2", and "Pine Script version 2 is fully backwards compatible with version 1." So on past days, the high, low and close lines sit at that day's final values from its first candle; on today's chart they follow the market. Its 2-hour and 1-hour lines are titled "4-Hour" in its code. No signals, no alerts, no licence line.
KioseffTrading's Bull Vs. Bear VP cuts the day by UTC, not by the exchange. Its code calls it "Bull Vs. Bear Market Intraday Sessions [Kioseff Trading]". Four ranges are on by default, "0000-0600", "0600-1200", "1200-1800" and "1800-0000", read in UTC, and five more are off. When a range ends, it draws its volume profile: each candle's volume spread over its high-to-low rows and counted as bull when the candle closed up and bear when it closed down, a candle that closed where it opened counting in neither. A "Live" profile follows the current day. NSE's 09:15 to 15:30 is 03:45 to 10:00 UTC, so by default the session's profile breaks at 06:00 UTC, which is 11:30 in India. No signals, no alerts. Pine v5, MPL 2.0.
rumpypumpydumpy's Intraday Volume Swings shades yesterday's swings. A swing low is at least three candles in a row, each with more volume than the last and a lower low; it ends on the first candle that breaks the run, and its zone is those candles' range. The script keeps each day's lowest swing low and highest swing high, shades yesterday's on today's chart, and labels "Higher Swing High" or "Lower Swing Low" when yesterday's went past the day before's. The day is the exchange's. It needs an intraday chart with volume, and elsewhere prints "Warning!!! Intraday Timeframes with Volume Only"; its comment names an index as a chart without volume ("eg non index"). Four alerts, sent through alert(), when price pushes into yesterday's or today's swing zones; with "Must close in region to trigger alert?" on, as it is by default, they check the last closed candle. The swing triangles are decided on the live candle. No stop and no target. Pine v4, MPL 2.0.
Session anchoring: VWAP, the opening range and NSE's 09:15
An intraday level is only as good as its idea of when the day starts. NSE's own timings page, read on 29 October 2026, lists the equity "Pre-open session (Regular)" from 09:00 to 09:08 and the "Normal / Odd lot market" from 09:15 to 15:30; its equity derivatives row reads 09:15 to 15:40. Signal Desk's tooltip gives that clock its IANA name, the kind Pine's timezone inputs take: "NSE = Asia/Kolkata". IANA's time zone database gives Asia/Kolkata a fixed offset of 5:30 from UTC with no daylight saving, so 09:15 in India is 03:45 UTC all year.
A script can find the day three ways: from the exchange's session (the first candle of the day the chart shows), from a named timezone, or from a fixed UTC offset. The second and third land wherever their numbers say, so on NSE you want 09:15 at Asia/Kolkata, or 03:45 at UTC+0.
VWAP. TradingView's own VWAP has an input for exactly this. Its help page: "This setting specifies the Anchor, i.e. how frequently the VWAP calculation will be reset." The choices start with Session, Week and Month, and the page adds: "This is useful with the 'Session' Anchor Period, because VWAP makes sense only when the Anchor Period is higher than the chart timeframe." The five most-boosted open-source scripts with VWAP in their name anchor it in five different ways:
| Script | Boosts | Where its VWAP starts |
|---|---|---|
| Volume Profile Free Ultra SLI (100 Levels Value Area VWAP) - RRB (RagingRocketBull) | 20,986 | A volume profile; VWAP is a mode, off by default, built on Pine's own vwap() with bands of 2 standard deviations of the last 100 candles |
| Dynamic Swing Anchored VWAP (Zeiierman) | 15,978 | At the latest 50-candle swing, never at the session; an exponentially weighted VWAP with a 20-candle half-life, redrawn from the swing when the direction flips |
| VWAP Stdev Bands v2 Mod (TheYangGuizi) | 14,352 | At each new daily candle, on the midpoint of each candle, with three standard-deviation bands on each side (two more are off) |
| Volume Profile Free Pro (25 Levels Value Area VWAP) by RRB (RagingRocketBull) | 7,446 | The same as Ultra SLI, in Pine v3 |
| VWAP Volume Profile [BigBeluga] | 7,027 | Pine's own ta.vwap on the close, drawn over the last 250 candles beside a profile of the volume at its levels |
Zeiierman's is a swing tool rather than a session VWAP; its code calls the weighting a "half-life -> EWMA alpha". TheYangGuizi's daily reset and TradingView's Session anchor both start again with the day's first candle; on NSE the normal market opens at 09:15.
The opening range. We read ten ORB scripts' clocks in our ORB roundup on 27 October; on an NSE chart, the four most-boosted open-source scripts with "opening range" in their name start like this:
- LuxAlgo's Opening Range with Breakouts & Targets (21,136 boosts): at the first candle of the session the chart shows. Its optional custom window offers "UTC+5:30".
- zzzcrypto123's ORB - Opening Range Breakout (11,893): "0915-0920" in the exchange's time, by default. Of the four, it's the only one with NSE's 09:15 typed in as its default.
- LuxAlgo's Ultimate Opening Range Breakout (10,231): "0930-1000" at "UTC-5", which is 20:00 in India, after NSE has closed. Its timezone menu jumps from "UTC+5" to "UTC+6" with no +5:30, so for 09:15 to 09:45 in India you'd type 08:45 to 09:15 at UTC+5.
- ChrisMoody's Opening Range Breakout with 2 Profit Targets (10,140): presets for US, forex, gold, oil and European sessions, the default "0930-1600", on the chart's exchange clock. None is NSE's.
Signal Desk's clock. Its entry window is an input on a named timezone, Asia/Kolkata by default: entries from 09:30 to 14:45, square-off from 15:00 to 15:15. Its source says why it starts at 09:30: "The default skips the first 15 minutes — the opening spike is where most chase entries come from."
Repainting on 1-minute and 5-minute charts
TradingView's Pine manual defines repainting as "script behavior causing historical vs realtime calculations or plots to behave differently". A lower timeframe doesn't change the code; it multiplies the moments where the two can differ. NSE's 09:15 to 15:30 session is 375 one-minute candles, each with a stretch where it isn't finished. What moves in the 12:
- The live candle. The PullBack Tool's arrows and alerts, the Swing Tool's alerts, tux's, nicks1008's, ovelix's, KivancOzbilgic's and Daveatt's marks and alerts, and rumpypumpydumpy's swing triangles are decided as the candle forms, so a signal can print and vanish before the close. ITG Scalper's signals wait for
barstate.isconfirmed; Super Scalper is a strategy and doesn't setcalc_on_every_tick, so it decides at each close. - Marks drawn into the past. The PullBack Tool's fractals are plotted 2 candles back and the Swing Tool's pivots 3, so on a past chart they sit on the swing, before anyone could have known it. TradingView's manual counts "most scripts based on pivots" as potentially misleading, along with "Scripts that plot values into the past, calculate results on realtime bars that one cannot replicate on historical bars, or relocate past events". Zeiierman's VWAP is redrawn from its swing whenever the direction flips.
- The future, on history. ChrisMoody's daily levels, as above. The manual's word for "Scripts that leak future information into the past" is "Unacceptable".
- Heikin Ashi prices. The PullBack Tool decides on Heikin Ashi candles by default, which its own comment says don't "show true prices". ITG Scalper goes the other way and rebuilds the real close for its triple EMA.
- Another timeframe. ITG Scalper's MACD, if you move it to 60 minutes, follows the forming 60-minute candle. TradingView's alerts page says a condition can change during the live bar with "any request.security() call using a higher timeframe than the chart's, when the higher timeframe's current bar has not closed yet".
For alerts, TradingView's answer is the same on every timeframe: "Alerts only trigger in the realtime bar." and "The simplest way to avoid this type of repainting is to configure the triggering frequency of alerts so they only trigger on the close of the realtime bar." Alerts on indicators need a paid plan: TradingView's pricing page, read on 29 October 2026, lists "Active technical alerts on indicators, strategies, and drawings" as ✗ on Basic, 20 on Essential, 100 on Plus, 400 on Premium and 1,000 on Ultimate.
More on telling them apart in how to tell if an indicator repaints.
Costs per trade, and why scalping magnifies them
No script among the 12 charges anything: eleven are indicators, and the one strategy sets no commission or slippage. A real round trip does cost something, and a broker's own page says how much. From Zerodha's charges page, read on 29 October 2026, the "F&O - Options" column, worked by hand for one NIFTY lot of 65 (NSE's lot file) bought and sold at the same ₹100 premium, so ₹6,500 of premium each way:
| Charge | Zerodha's rate | On this trade |
|---|---|---|
| Brokerage | "Flat Rs. 20 per executed order", two orders | ₹40.00 |
| STT | "0.15% on sell side (on premium)", on ₹6,500 | ₹9.75 |
| Transaction charges | "NSE: 0.03553% (on premium)", on ₹13,000 | ₹4.62 |
| SEBI charges | "₹10 / crore", on ₹13,000 | ₹0.01 |
| GST | "18% on (brokerage + SEBI charges + transaction charges)" | ₹8.03 |
| Stamp charges | "0.003% or ₹300 / crore on buy side", on ₹6,500 | ₹0.20 |
| Total | ₹62.61 |
That's ₹0.96 per unit, a little under one point of premium, lost before the price moves at all. The ₹100 premium is only an example, and NSE's investor protection charge ("₹0.01 per crore") is under a paisa here, so it's left out. Slippage and the bid-ask spread aren't on the page and come on top.
Scalping magnifies this because the cost is set per order and per rupee of premium, not per point of your stop. What a trade risks is its stop: 1R. Halve the stop and the same ₹62.61 is twice as much of it:
| Stop, in premium points | 1R for one lot of 65 | Round-trip cost | Cost in R |
|---|---|---|---|
| 5 | ₹325 | ₹62.61 | 0.19R |
| 10 | ₹650 | ₹62.61 | 0.10R |
| 20 | ₹1,300 | ₹62.61 | 0.05R |
| 40 | ₹2,600 | ₹62.61 | 0.02R |
On a 5-point stop, a trade that reaches 1R in your favour keeps about 0.8R of it, and a stopped-out trade loses about 1.2R. Then the count multiplies it: ten round trips a day cost ten times one. Zerodha's own page puts it plainly: "When trading at Zerodha, STT/CTT can be a lot more than the brokerage we charge."
SEBI measured the total. "On an average, individual traders spent ₹26,000 per person on F&O transaction costs in FY24." And for the two years since: "Individual traders incurred transaction costs of about ₹25,000 crore in each of FY25 and FY26." The trading expectancy calculator shows what your average win and loss leave once the cost comes off.
Which intraday scripts give a stop and a target?
None of the 12. Super Scalper comes closest and still doesn't: it computes a stop 2 ATR beyond the signal candle and a target 5 ATR beyond it, then never sends either to an exit order. The other eleven give a signal, a level or a profile, and leave the plan to you.
Free scripts that do give both are elsewhere in TradingView's search, and we've read four of them:
- kelfry98's Buy Sell Signal, from the buy/sell roundup: a stop half an ATR beyond the signal candle and a final target at 3R, decided on the live candle.
- gokulchhabra's NIFTY 5-STAR Buy/Sell Indicator, from the Nifty option roundup: one signal a day from 9:31 to 15:00, decided on a closed candle by default, with a stop and a target 1R away.
- The ORB scripts: two of the ten in the ORB roundup, ORB Algo and Luxy's Dynamic ORB, decide on closed candles and set a stop with the entry, and both draw targets.
A stop and a target are half a plan. The size is the other half, and on a lower timeframe the costs above are part of both.
Nifty scalping strategy
Of the scripts in our search with Nifty and scalping in their name, the two that are open source, DanSib's Bank Nifty Scalping (877 boosts) and OptionsScalper123's Options Scalping Nifty (628), draw levels and a table with no buy or sell signal, as our Nifty roundup found. The rest are protected or invite-only. So there's no open Nifty scalping strategy to read, and none we could test.
What any Nifty scalp has to clear is in this page's other sections. The session runs from 09:15 to 15:30, 375 one-minute candles. The lot is 65, so a 5-point stop on one lot risks ₹325. The costs above are 0.19R of that before price moves. And SEBI's study of FY25 and FY26, which sorts traders into these groups using "a random sample of 5,050 individual traders drawn from the 1.23 crore unique individuals who traded in the EDS during FY25–FY26", describes the market a Nifty option scalp is part of: "In FY26, 93% of traders were classified as ‘Only Options Buyers’", "90% of ‘Only Options Buyers’" incurred losses, and "High trading intensity relative to available capital was consistently associated with poorer trading outcomes." That last line is an association across traders, not a test of any rule, and it tells you nothing about the next trade.
Which indicator is best for scalping?
Of the 12 we read, Complector's ITG Scalper. It's the only one whose signals wait for a closed candle in its own code, it alerts on each buy and sell, and its triple EMA reads the real close even on a Heikin Ashi chart. Know its limits:
- Its buys and sells simply alternate: after a buy, the next signal can only be a sell. Nothing marks a stop.
- It has no target. The red or yellow sell label compares prices with no costs.
- It's an indicator, so nothing is tested in the Strategy Tester.
The two most-boosted, JustUncleL's PullBack Tool and tux's EMA Scalper, are popular, and both decide on the live candle; the PullBack Tool also decides on Heikin Ashi prices unless you turn that off.
What are the best indicators for intraday trading?
For the day's levels, start with what's built in: TradingView's own VWAP with its anchor on Session, which its help page says "begins calculating at the open and stops calculating at the close", and an opening range that starts at NSE's 09:15. Of the four most-boosted ORB scripts, zzzcrypto123's ORB has 09:15 as its default. For a signal with a plan on Nifty, gokulchhabra's NIFTY 5-STAR gives one a day, on a closed candle, with a stop and a target. For a scalping signal that waits for the close, ITG Scalper, with a stop you set. All of them are free to add on TradingView, and we tested none of them.
Is there a most accurate scalping indicator?
No code read can tell you how often a signal will be right, and none of the 12 states an accuracy figure in its code. TradingView's own script publishing rules set the bar for any author who does: "Do not make unrealistic or unsubstantiated claims about your script's performance, whether on TradingView or elsewhere. If you make any claims about trading performance, signal accuracy, statistical reliability, etc., substantiate those claims clearly in your description. If you cannot substantiate a claim, it does not belong in your publication."
So no honest indicator can claim to be the most accurate. And on a 1-minute chart, the costs above come off every trade, right or wrong.
What Signal Desk is, and isn't, for intraday
We build two tools for this, and neither is free.
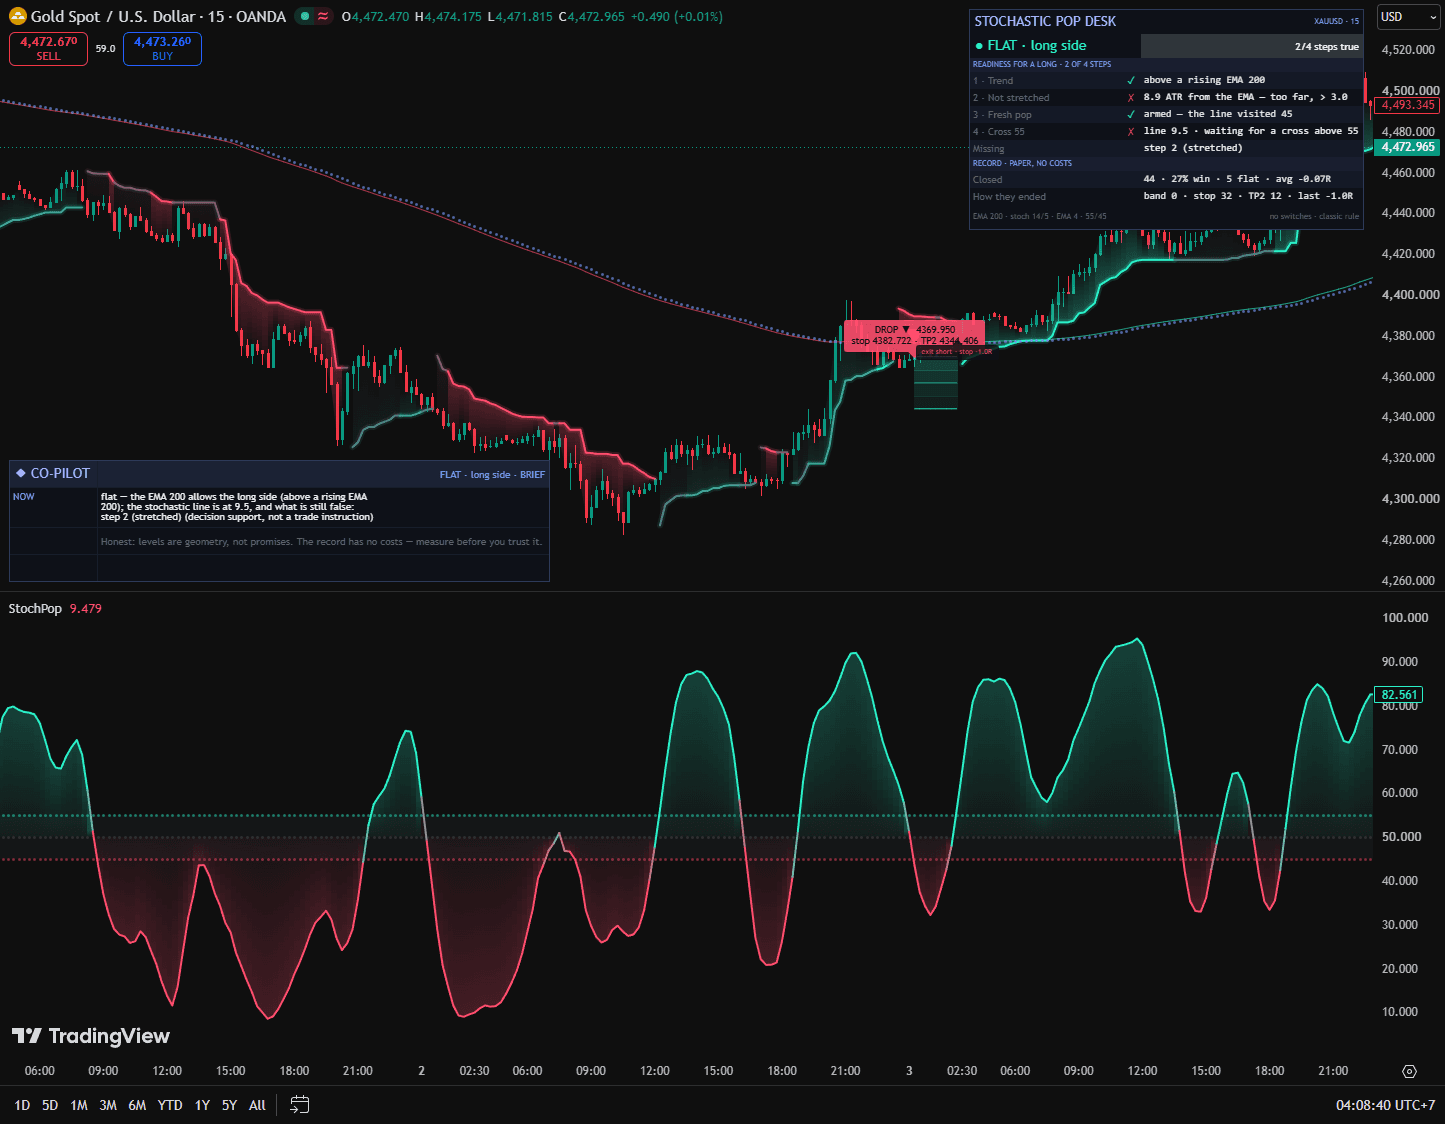
Signal Desk is an entry checklist indicator in Pine Pro Library ($49 once, every library desk with its Pine source). It reads closed candles: "Entries commit on confirmed candles." It grades five checks, trend, momentum, structure, location and candle, on a pullback or breakout trigger, and its chase vetoes block an entry when "candle high–low range above 2.5 ATR; directional stretch from fast EMA above 2 ATR; or range of the last three closes above 3 ATR". Its higher-timeframe context reads the last closed 15-minute candle. Its "Max entries per day" input defaults to 2 and can be set from 1 to 20; its own tooltip calls it "The 'one or two calls a day' rule — counted per exchange day, both directions together." After each exit it waits 6 candles. Its page: "Default entry times are 09:30 inclusive to 14:45 exclusive, Asia/Kolkata, based on candle opening times." Each entry gets a structure stop and targets at 1R, 2R and 3R, and when a candle reaches both the stop and a target, it counts the stop.
It isn't a scalper. Even at 20 a day, every entry still needs a graded pullback or break, outside the vetoes, inside the window, with "one position at a time and normally a six-candle cooldown after exit". If you want a trade from every small move, it isn't built for that. Why a cap is a rule you can keep, and what it doesn't do, is in how many trades per day; stopping for the day at a loss is in daily loss limit.
Signal Desk Premium, $49 once, keeps those entries and adds the work around them: a GET READY heads-up once per pullback, before the signal; a trade ticket that sizes from your risk ("Risk ÷ (stop distance × money per point), rounded down.") and puts your costs on it ("Your commission and slippage on every order: the entry, each partial, the exit. On the ticket and in every record."); scale-outs ("Half at TP1 by default, then the stop moves to entry. The rest runs to TP3, trailing after TP2."); a daily lock ("By default the day locks at −2R net", and a second lock after 3 losses in a row); and a Radar of 20 markets with one alert, with an NSE India list among its ready lists. Its Auto preset: "no entries in the first 15 minutes or the last 30, square-off in the last 15." Its page says: "Premium uses the same entries as the library desk. It does not promise better results; it makes the same signals easier to prepare for, size, manage, filter and act on." Its scripts never place orders, and its alerts, like every alert above, need Essential or above.
What the desk's graded signals did on one NSE:NIFTY 5-minute chart, with costs on, is written up in full, failures included: we graded the signals, then tested the grade. It tells you about that test, not about the next trade.
Check one yourself
- The close: look for
barstate.isconfirmedoralert.freq_once_per_bar_close. Without either, an indicator decides on the live candle. A strategy decides at the close unless itsstrategy(line sayscalc_on_every_tick = true. - The future: search for
lookaheadandsecurity(. A script with no//@versionline, or version 2, reads another timeframe with lookahead on. In a later version,lookahead_onwithout[1]on the value does the same. - The past: search for
offset = -oroffset=-. A negative offset draws a value before it was known. - The clock: find the session input and its timezone. On NSE you want 09:15 on Asia/Kolkata, the exchange's own session, or a fixed offset of +5:30.
- The costs: look for
commission_valueandslippageon thestrategy(line. When they're missing, the Strategy Tester charges nothing unless you enter them in its properties.
None of these runs on MT5 or MT4: they are written in Pine Script, TradingView's own language.
Limits
One code read, on 29 October 2026, of the versions TradingView served that day. Scripts change, and boosts measure popularity, not quality. We tested none of the 12. The costs are one broker's page on one day, for one example premium, without slippage. We build and sell Signal Desk and Signal Desk Premium, and we have no relationship with any author named here. Nothing here is financial advice. Trading involves risk.
Frequently asked questions
Which indicator best for intraday?
No single script does the whole job, and none of the 12 most-boosted open-source intraday and scalping scripts on TradingView gives a stop and a target with its signal. For levels, use TradingView's own VWAP on its Session anchor and an opening range drawn from NSE's 09:15 open. For a signal, ITG Scalper is the one of the 12 that waits for a closed candle in its own code. We tested none of them.
Which indicator is best for scalping?
Of the 12 we read, Complector's ITG Scalper (8,314 boosts): a triple EMA turning with a MACD filter, decided on closed candles, with a buy and a sell alert. It has no stop and no target, and its buys and sells simply alternate, so the stop is yours to set. The two most-boosted, JustUncleL's Scalping PullBack Tool (21,988 boosts) and tux's TonyUX EMA Scalper (21,009), decide on the live candle.
What is the best Nifty scalping strategy?
No open script in our search is a Nifty scalping strategy with a stop and a target: the two open ones with Nifty and scalping in their name draw levels and a table, with no signal. Whatever the rule, a scalp has to clear its costs first: on Zerodha's charges page, one Nifty option lot of 65 bought and sold at ₹100 costs ₹62.61 in charges before price moves, about 0.19R on a 5-point stop.
What is the most accurate scalping indicator?
No honest indicator can claim to be the most accurate. TradingView's publishing rules say any claim about signal accuracy must be substantiated in the script's description, and a claim that can't be substantiated does not belong in the publication. None of the 12 scripts we read states an accuracy figure in its code.
Do scalping indicators repaint on 1-minute charts?
Most of the 12 decide on the live candle, so a mark can print and vanish before the close, and a 1-minute chart of NSE's session has 375 of those candles. Two draw swing marks 2 or 3 candles back in time, and one, ChrisMoody's daily levels in Pine v1, shows each past day's final high, low and close from that day's first candle.
How much does an intraday option trade cost in India?
On Zerodha's charges page, read on 29 October 2026: ₹20 per executed order, STT of 0.15% of the premium on the sell side, NSE's 0.03553% transaction charge, SEBI's ₹10 per crore, stamp duty on the buy side and 18% GST. For one Nifty lot of 65 bought and sold at ₹100, that is ₹62.61, before slippage.
Do intraday indicator alerts work on TradingView's free plan?
No. TradingView's pricing page, read on 29 October 2026, shows no technical alerts on indicators, strategies or drawings on Basic, 20 on Essential, 100 on Plus, 400 on Premium and 1,000 on Ultimate. The scripts themselves run on any plan.
Is Signal Desk a scalping indicator?
No. It reads closed candles, grades five checks and vetoes chasing entries, and its Max entries per day input defaults to 2 and can be set from 1 to 20. Even at 20, each entry needs a graded pullback or break inside the 09:30 to 14:45 window, one position at a time, with a 6-candle cooldown after each exit.