Short answer: confluence in trading means several independent conditions agreeing on the same candle. The word that does the work is independent. RSI, MACD and stochastic are all momentum, computed from the same recent prices, so when they agree you have one check, not three. Count kinds instead: trend, momentum, structure, location and candle, one check each, equal weight. Then add vetoes that refuse a trade whatever the count, because the moment everything agrees is often the moment price has already run. And read the count for what it is: a description of the setup, not the odds of a win.
This post defines confluence, shows from the code and from 27,000 simulated candles why more indicators isn't more evidence, and gives a checklist that counts honestly. Then you tick a seven-line confluence list on one simulated close and count it twice. After that: what our multi-timeframe confluence backtest found, what our Signal Desk study found about counting, and a code read of the open-source confluence indicators on TradingView.
What is confluence in trading?
Confluence is a word for agreement. A trader says a setup has confluence when several things point the same way at once: the trend is up, momentum is up, price has just broken a swing high, the close sits near its moving average, and the candle is a strong one. Each of those is a condition you can check on the closed candle. The more of them agree, the more confluence.
That much is in every definition. What most leave out is the word that makes the idea mean anything: independent. Five conditions agreeing is worth something only if they could have disagreed. Five readings of the same thing will agree because they're the same thing.
Our own multi-timeframe study put it in one line about a matrix of eleven trend indicators across five timeframes: "They agree for the same reason five thermometers in one room agree: correlation, not confirmation."
Confluence means the same thing in forex, stocks, futures or crypto. A confluence zone is the same idea on the price axis: a Fibonacci level, a prior swing and a moving average sitting close together. A confluence filter is one more condition a signal must meet. The counting rule below applies to all three.
Why more indicators isn't more confluence
RSI, MACD and stochastic are the three oscillators most confluence lists stack. Here is what each one is made of:
- RSI (14) compares the average of recent up-closes with the average of recent down-closes. Closes only.
- MACD (12, 26, 9) is the 12-candle EMA of the close minus the 26-candle EMA, and its signal line is a 9-candle EMA of that difference. Closes only.
- Stochastic %K (14) is where the close sits in the last 14 candles' high–low range, from 0 to 100.
All three ask one question, "has price been pushing up lately?", of the same recent candles. Above 50 or above the signal line, they say yes together and no together most of the time. Tick all three and your list says three; the chart has said one thing.
One script in TradingView's confluence search shows it in its own code. pawehu's EMA + MACD + RSI Confluence Signal (1,837 boosts) shades a ribbon by how many of six conditions agree: EMA 9 above EMA 20, the MACD line above its signal, RSI above its own 14-candle EMA, RSI above 50, that EMA above 50, and the MACD histogram above zero. All six are computed from the close. Two of them are the same condition, because the histogram is the MACD line minus its signal line: "MACD above signal" and "histogram above zero" can never disagree. Its buy needs only the first three to line up, yet its alert message reads "6/6 Bull confluence".
How often two checks agree
You can measure redundancy instead of arguing about it: count how often two checks give the same answer. We did that on the drill's own simulated market: 27,000 five-minute candles, from 300 seeded two-session runs after a 60-candle warm-up, each check read for a long. The second column is how often the two agreed. The third is what two unrelated checks with the same pass rates would give by chance.
| Two checks | Same answer | If unrelated |
|---|---|---|
| RSI above 50 and stochastic above 50 | 87% | 50% |
| MACD above its signal and stochastic above 50 | 79% | 50% |
| RSI above 50 and MACD above its signal | 68% | 50% |
| Trend and RSI above 50 | 82% | 49% |
| Trend and structure | 83% | 49% |
| RSI above 50 and location | 57% | 48% |
| RSI above 50 and candle | 58% | 48% |
| Location and candle | 56% | 57% |
All three oscillators gave the same answer on 67% of the candles. Trend here is Signal Desk's check (Supertrend (10, 3) up and the 20 EMA above the 50 EMA), structure is "the last swing a close broke was a swing high", location is "the close within 0.5 ATR below to 1 ATR above the 20 EMA", and candle is "a strong green candle that isn't oversized". The candles are simulated, so your market's numbers will differ; the method won't.
Two things stand out. The oscillators agree far more than chance, which is the point above. But so do trend, RSI and structure, three different kinds of check: all three ask whether price has been going up, and over the same stretch of candles they usually answer alike. The two that agree with the rest at about chance are location and candle. They're the checks that ask something else: not "which way?" but "where, and how?".
Confluence checklist: how to count it honestly
A confluence checklist is only as good as its counting. Five rules:
- One check per kind. Write one check each for trend, momentum, structure, location and candle, each answerable yes or no from the closed candle. If your list has RSI, MACD and stochastic, keep one and delete two. Each kind asks a different question: is the slower move with you, is the push still there, has price broken the last swing your way, are you entering near the average or far from it, and is this candle strong without being oversized.
- Count kinds, not ticks. Three of five kinds is three, however many indicators you used to get there.
- Expect the directional three to agree. Trend, momentum and structure lean together, as the table shows. A count of three that is those three often just says "price has been rising". Location and candle are where a count earns its keep.
- Weigh them the same. A plain count holds up better than it sounds. Dawes's 1979 paper on "improper linear models" found "unit (i.e., equal) weighting is quite robust for making such predictions." That is about combining predictors in general, not trades, so it supports the method, not a promise.
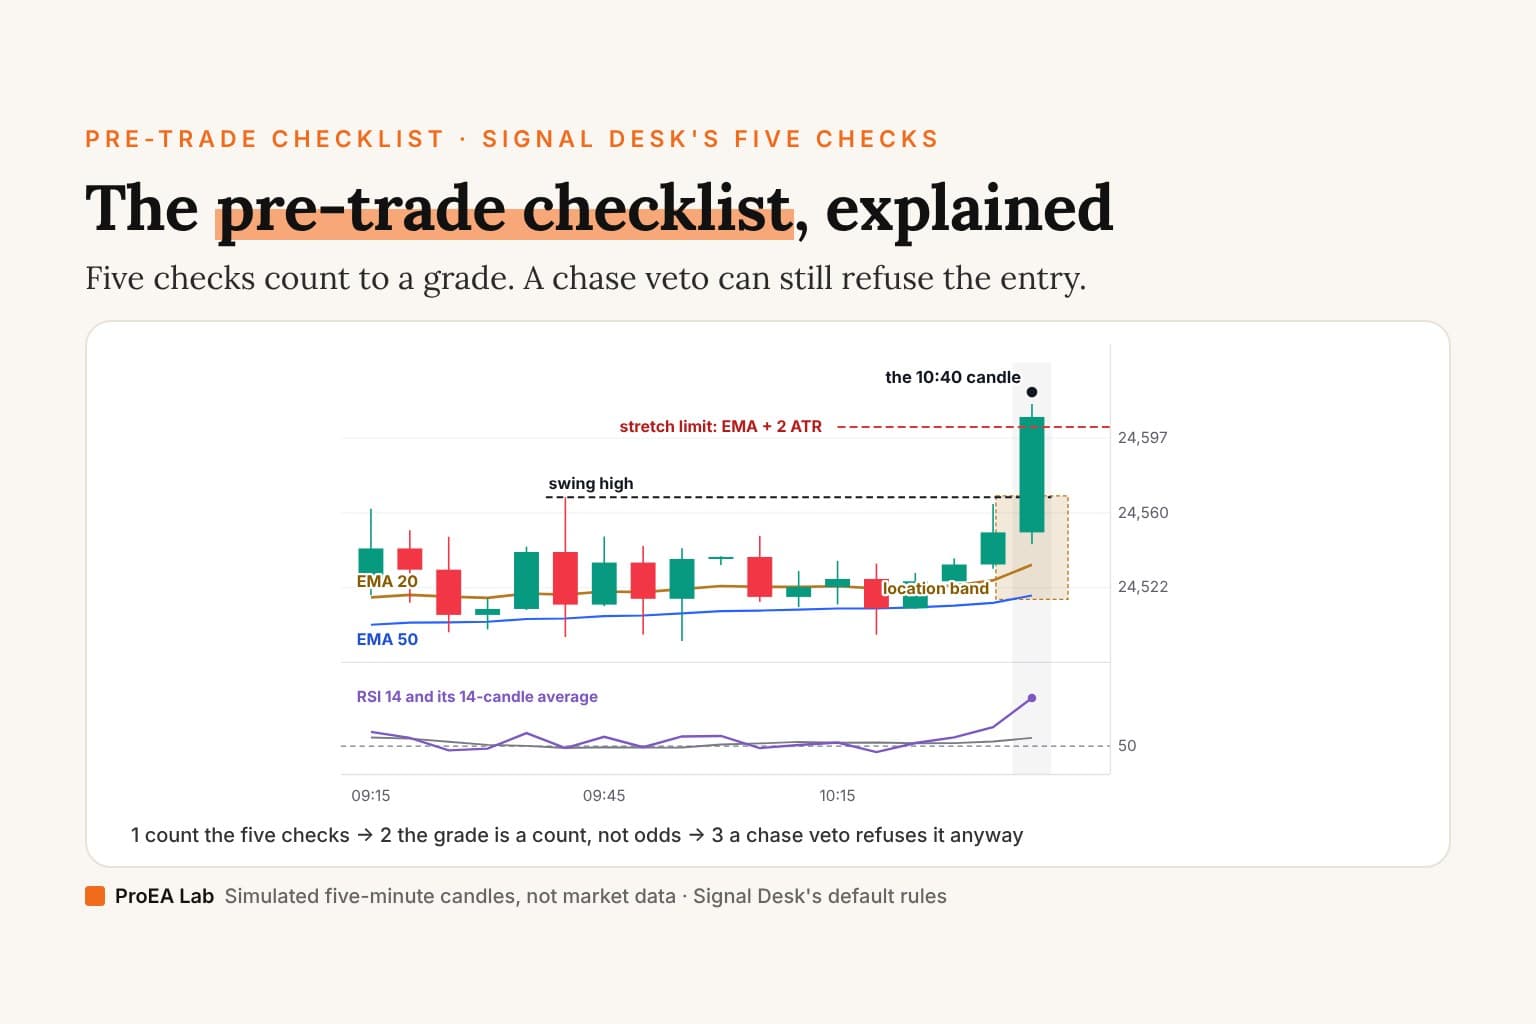
- Add vetoes that ignore the count. The moment everything agrees is often the moment price has already run, and the oscillators read highest right after a run. So write limits that refuse the entry whatever the count. Signal Desk's three, at its defaults: no candle whose range is over 2.5 ATR, no close more than 2 ATR beyond the 20 EMA, and no entry after the last three closes span more than 3 ATR. Add a cap on entries a day and a cooldown after an exit.
Then read the count as a count. A trade where all five kinds agree is a trade where five conditions were present on the close. It is not the odds of a win.
The whole list, with the vetoes and the day's limits, is in the pre-trade checklist and on a one-page PDF.
Tick it yourself: seven checks, one close
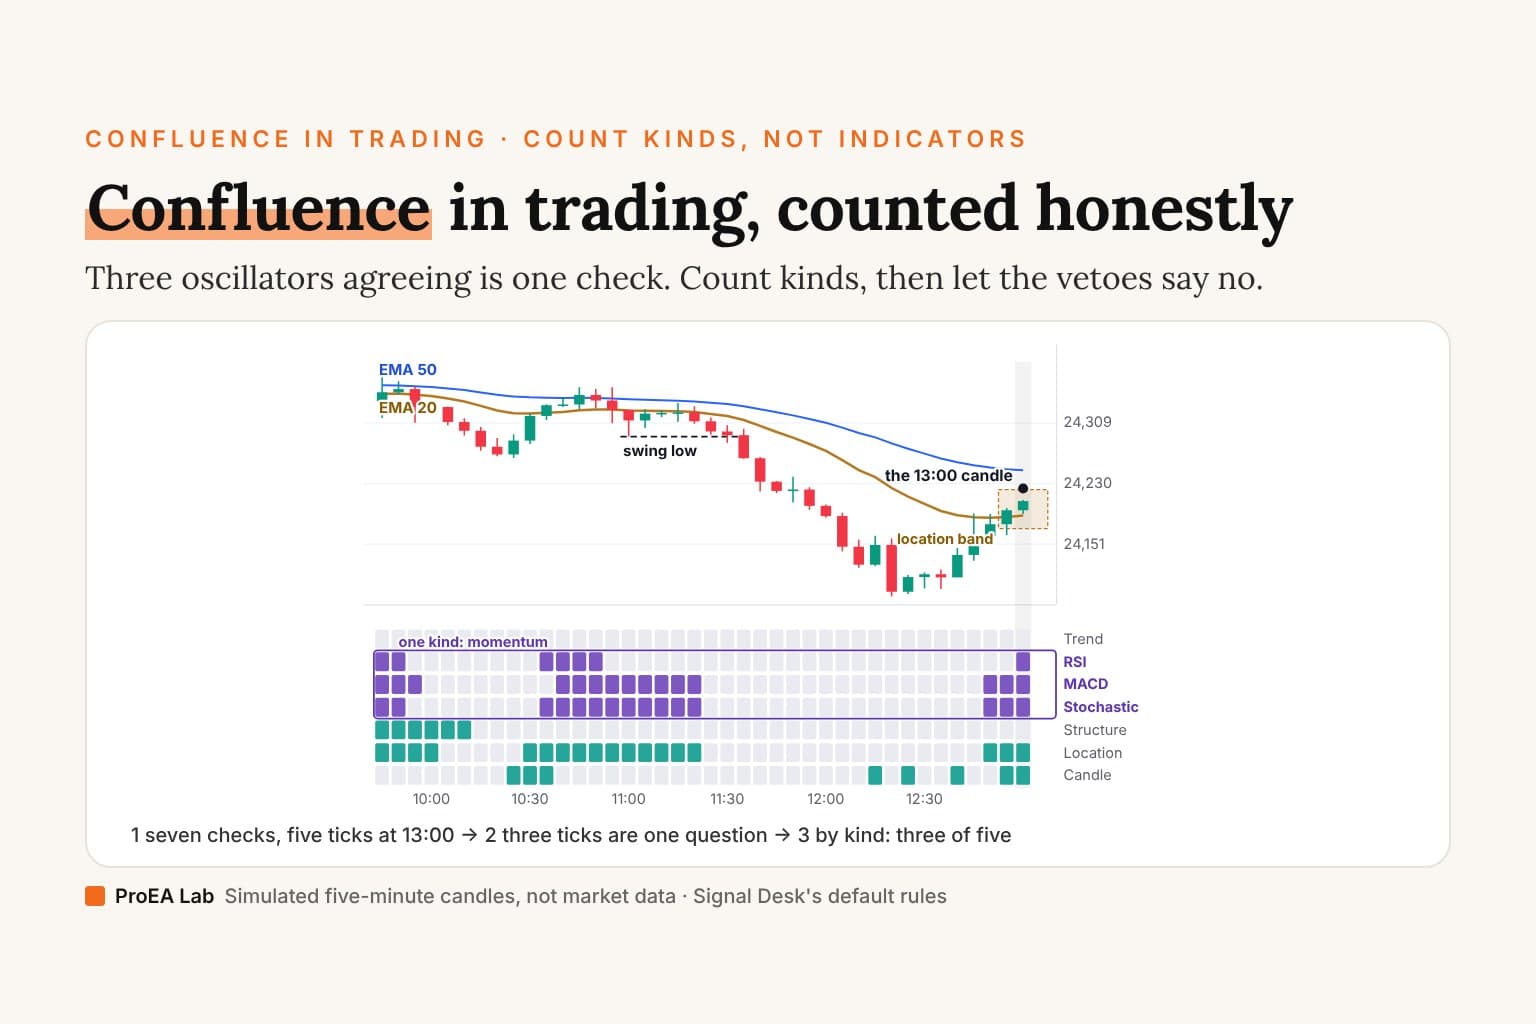
The chart below is one simulated five-minute index session. Price drifts through the morning, breaks a swing low at 11:35, falls until 12:20, then bounces. The marked candle opens at 13:00. Under the candles, one strip per check shows whether it passed on each candle. Tick the seven checks the 13:00 close passes, using the readings beside each rule, then count them twice.
Your ticks: 0 of 7.
Tick each check the marked close passes, from the readings beside its rule. Then see what the list counts.
Simulated five-minute index candles, not market data and not a result. Long side. Trend, structure, location and candle use Signal Desk's defaults (pivots 5 candles each side; location 0.5 ATR below to 1 ATR above the 20 EMA). EMAs start from the first candle; RSI and ATR are Wilder's. Under the candles, a filled cell is a pass.
| Reading on the 13:00 candle's close | Value |
|---|---|
| Open, high, low, close | 24,194.3, 24,207.8, 24,189.3, 24,206.2 |
| 20 EMA and 50 EMA | 24,187.3 and 24,246.3 |
| Supertrend (10, 3) | up |
| RSI (14) | 50.5 |
| MACD line and signal line | −31.7 and −42.5 |
| Stochastic %K (14) | 87.3 |
| ATR (14) | 34.0 |
| Last swing a close broke | the swing low at 24,290.4, by the 11:35 close |
The answer, step by step
- Trend: fails. Supertrend (10, 3) has turned up, but the 20 EMA (24,187.3) is still below the 50 EMA (24,246.3). The check needs both.
- RSI: passes. 50.5, above 50.
- MACD: passes. The MACD line, −31.7, is above its signal line, −42.5, though both are still below zero.
- Stochastic: passes. %K is 87.3.
- Structure: fails. The last swing a close broke was the swing low at 24,290.4, by the 11:35 close, and no swing high has broken since.
- Location: passes. The close is 18.9 above the 20 EMA, 0.56 ATR. The band runs from 24,170.4 to 24,221.3.
- Candle: passes. A green candle with a body 65% of its range, a top wick of 8% and a range of 0.55 ATR.
The list's count: 5 of 7. On a typical confluence list that reads as strong agreement. But three of the five are RSI, MACD and stochastic, and they turned up together: MACD and stochastic at 12:50, RSI at 13:00.
By kind: 3 of 5. Momentum, location and candle pass. Trend and structure, the two checks that say which way the market has been going, both still say down. On Signal Desk's own five, where momentum is one check (RSI above its 14-candle average and above 50), this close is a C, below the desk's default minimum of B. Five ticks out of seven, and the honest count is a bounce in a falling session.
Does more confluence mean a better trade? What our backtest found
We tested the folklore on our own tool: our multi-timeframe confluence backtest. The tool reads a trend bias on five timeframes (15 minutes, 1 hour, 4 hours, daily and weekly), each from eleven classic indicators, and reduces them to a percent aligned. We read it once an hour across 50 sessions of gold futures, 1,131 readings, and asked whether price sat on the side of the bias one hour later. That share is the study's hit rate.
What it found, in its own numbers:
- Full agreement was common. "The stack reached 100% alignment in 28.6% of all hourly readings: 323 of 1,131."
- More alignment didn't separate the next hour. The most-aligned third of readings hit 47.5%, the least-aligned third 47.1%. Following the bias for an hour hit 48.2% across all directional readings.
- The alert for full agreement did no better. The FULL STACK alert fired on 67 readings and hit 44.8% over the next hour, below the 48.2% baseline.
- The uncertainty was wide. "The session-cluster bootstrap puts the hit-rate difference at a 95% CI of [−5.2, +10.0] points."
Its conclusion: confluence "is a state, not a forecast." And its limits, in its words: "One symbol (gold futures), one 50-session observation window, two horizons." It tested agreement among indicators that all follow trend, which is the redundancy this post is about, on one market. It did not test a count of different kinds.
Our Signal Desk study did test a count of different kinds, on one Nifty chart with costs on, and asked a second question: does a cleverer gate beat the plain count? Signal Desk's own page sums up the answer without a figure: "We measured one index chart with real costs on. Counting all eight factors, using learned strength as the gate and a stricter momentum exit made that sample worse. The five-factor setup count remained the default." The study prints its numbers, its sample and its limits; read it there.
So the honest position is narrow. Counting different kinds, with equal weights, is a sound way to describe a setup and to keep you from buying a stack of look-alike signals. Neither of our studies showed that a higher count picks better trades.
Confluence indicator on TradingView: the open-source scripts, code-read
TradingView's script search, run for 21 terms on 29 October 2026, "confluence" among them, returned 504 scripts. 46 have confluence in their name: 43 open source, 2 protected and 1 invite-only. We read the code of the eight most-boosted open-source ones, down to 2,576 boosts, none skipped, and of two more that autocomplete names, "quant confluence engine indicator" and "volume trend confluence oscillator indicator". No protected or invite-only confluence script ranks above the eighth. For each: what it combines, whether it counts, whether a signal comes with a plan, what candle it decides on, and what it alerts.
Boosts as TradingView's search showed them on 29 October 2026.
| Script | Boosts | What it combines | Counts? | Stop and target | Decides on | Alerts |
|---|---|---|---|---|---|---|
| Fibonacci Confluence Toolkit [LuxAlgo] (LuxAlgo) | 14,921 | A change of character, Fibonacci retracements of the new swing, engulfing candles after it | No: it draws them | None | The live candle | None |
| Market Structure Confluence [AlgoAlpha] (AlgoAlpha) | 5,518 | A break of a 10-candle swing, and a touch of a volatility band around the 100-candle WMA | Both, for an arrow | None | The live candle; alerts wait for the close | 12 |
| TUE ADX/MACD Confluence V1.0 (TradersUltimateEdge) | 5,034 | +DI above −DI, and the MACD line above its signal | Both | None | The live candle | 2 |
| SuperTrend Confluence Signals [AlgoAlpha] (AlgoAlpha) | 3,598 | Supertrend (10, 3), arrows near its band, high-volume marks, and a table of other symbols' Supertrends | No: it draws them | None | The live candle | 7 |
| Confluence Suite (lucymatos) | 3,189 | An adaptive Supertrend flip, labelled Strong to Weak by six fixed-weight scores | A label | None by default | The live candle | None |
| Buy-Sell with Liquidity Breakout PRO using Volume Confluence (InvestyourAsset) | 3,013 | A close beyond the last 20-candle swing, and volume over 1.3 times its average | Both | A stop below the previous candle; three targets, drawn, not tracked | The closed candle | 2 |
| Viprasol Sniper Confluence Entry/Exit (viprasol) | 2,921 | An EMA 9 and 21 cross, with at least 4 of 7 factors | 4 of 7 | A 1.5 ATR stop and five targets; the targets tracked, the stop not | The closed candle | 5 |
| Triple Supertrend Confluence [MarkitTick] (MarkitTick) | 2,576 | Three Supertrends of the same price, and ADX (14) at 20 or more | 2 of 3 | A 1.5 ATR stop and targets at 1R, 2R and 3R, both tracked | The closed candle | Entries, exits and targets; none for the stop |
| Quant Confluence Engine [JOAT] (officialjackofalltrades) | 1,082 | Six weighted votes: EMAs, RSI, MACD, ADX, volume and range position | A score of 45 with 4 of 6 votes | A 1.5 ATR stop and targets at 1R, 2R and 3R | The live candle | 3 |
| Volume & Trend Confluence Oscillator (Finntech1) | 632 | 14-candle momentum, scaled by unusual volume and the 34 EMA's slope | No: one line | None | The live candle | 4 |
None of the ten is a strategy, so none has a backtest with costs. Three wait for the closed candle before a signal: InvestyourAsset's, Viprasol's and MarkitTick's.
What the code says
LuxAlgo's Fibonacci Confluence Toolkit draws, and leaves the counting to you. It tracks swings on three tiers and, after a change of character on the longest, shades an "area of interest" and draws Fibonacci retracements of the new swing at 0, 0.382, 0.5, 0.618, 0.786 and 1 by default (0.236 and 0.65 are off). Its "Engulfing Candle Patterns" setting is "Structure Based" by default, so it marks engulfing candles only after a change of character. No score, no stop, no target and no alerts. The change of character is read on the live candle's close. Pine v5, CC BY-NC-SA 4.0.
AlgoAlpha's Market Structure Confluence pairs a swing break with a band. Swings need 10 candles each side ("Time-Horizon"), and a break counts on a close ("BOS Confirmation", "Candle Close"). The band is the 100-candle WMA of the close, plus and minus twice the 21-candle average of ATR (14). A ▲ prints when the last break was up and the candle's range crosses the lower band: two different kinds, structure and location. Its HH, HL, LH and LL labels appear 10 candles after each swing, drawn back on it. Twelve alerts, and its "Wait for Bar Close (alerts)" setting is on by default; the arrows on the chart are decided on the live candle. No stop or target. Pine v6, no licence line.
TradersUltimateEdge's ADX/MACD Confluence uses no ADX. BUY prints when +DI is above −DI (length 14, smoothing 10) and the MACD line (12, 26, 9) is above its signal, on the first candle both agree after they last agreed the other way. The ADX line it calculates is never used. Two alerts, LONG and SHORT. No stop, no target, decided on the live candle. Pine v5, MPL 2.0, and its header asks that it not be resold.
AlgoAlpha's SuperTrend Confluence Signals draws four things beside each other. Supertrend (10, 3) with an offset band; ▲ "retracement" arrows when the candle's midpoint comes near that band ("Retracement Sensitivity", 0.5); ◆ marks when volume reaches 3 times its 200-candle standard deviation ("Volume TP", 3.0, a volume mark, not a price target); and a table of the Supertrend's direction for AAPL, MSFT, GOOGL, TSLA and NVDA on five timeframes, from 5 minutes to a day. Nothing counts them. The table's request.security calls read each timeframe's forming candle on a live chart. Seven alerts. Pine v6, no licence line.
Confluence Suite's "AI Signal Classifier" learns nothing. Its signals are flips of an adaptive Supertrend whose factor is picked by clustering factors from 1 to 5 by recent performance. Each signal is labelled Strong, Good, Moderate or Weak from six scores (a DEMA momentum line, two ALMAs of the close, support and resistance from 10-candle swings, 20-candle structure, an ADX regime and a volume split) passed through weights the code writes out by hand; its comment says they were "tuned so varied inputs produce varied outputs". It runs the clustering only on the chart's last 2,500 candles (last_bar_index - bar_index <= maxData), so on a longer chart the earlier candles get no signal at all. No alerts, and its trailing stop line is off by default. Decided on the live candle. The header credits notprofessorgreen. Pine v5, MPL 2.0.
InvestyourAsset's Liquidity Breakout PRO waits for the close and draws a plan. A buy needs the first close above the last confirmed swing high (20 candles each side) plus 0.15 ATR (14), on a candle whose volume is over 1.3 times its 20-candle average, and only once the candle has closed (barstate.isconfirmed): two kinds, structure and volume. The stop, by default ("Previous Candle + ATR Buffer"), sits 0.2 ATR below the previous candle's low. The targets are 1, 1.618 and 2.618 times the range between the last swing high and low, measured from the entry; its code notes "Targets are independent from stop loss." They are drawn, not tracked. Two alerts. Pine v6, MPL 2.0.
Viprasol's Sniper Confluence counts seven factors, and two of them are given. The trigger is EMA 9 crossing EMA 21 on a closed candle ("Bar-Close Confirmation", on). It fires only if at least 4 of 7 factors agree ("Minimum Score (out of 7)", 4): close above VWAP, RSI (14) above 50, MACD above its signal, EMA 9 above EMA 21, ADX (14) above 25 with the close above EMA 9, volume above its 20-candle average on a green candle, and RSI (14) above 50 on a second timeframe, "5" minutes by default. The EMA vote is always true when its own cross triggers, and on a 5-minute chart the second RSI is the same RSI. The stop is 1.5 ATR (14) away, with five targets at 1R to 5R and the stop line moved to the entry at TP1. It marks targets HIT but never checks the stop, so a trade that would have been stopped out can still show a target hit later. Five alerts. Pine v6, MPL 2.0.
MarkitTick's Triple Supertrend Confluence counts one indicator three times. Three Supertrends on the same candle midpoints: the main one (ATR 10, its factor adapting from 1.5 to 4.5 with ATR's rank over 100 candles), a fast one (7, 2.0) and a slow one (14, 4.0). The main one counts itself, so "2 of 3" means one of the other two agrees. ADX (14) must be 20 or more; its higher-timeframe, volume and cooldown filters are off by default (the higher-timeframe one, when on, reads the last closed candle: f_htfDirection()[1], lookahead = barmerge.lookahead_on). Signals print on the closed candle where the main Supertrend flips. The stop is 1.5 ATR (10) away with targets at 1R, 2R and 3R, and both are tracked on the labels; it sends JSON alerts for entries, exits and each target, and none when the stop is hit. Pine v6, CC BY-NC-SA 4.0.
JOAT's Quant Confluence Engine weighs six votes, and three of them read the close. Trend (EMA 21 and 55, weight 1.5), momentum (RSI 14 around 50, weight 1.0), MACD's histogram (1.0), ADX (14) of 18 or more with the DI lines (1.0), relative volume of 1.2 or more with the candle's colour (0.8), and location in the last 20 candles' range (0.7), which votes long only in the bottom 35%. A buy needs the score, smoothed over 2 candles, at 45 or more and at least 4 of 6 votes long. Trend, momentum and MACD carry 3.5 of the 6.0 weight between them. The stop is 1.5 ATR (14) away with targets at 1R, 2R and 3R, and its dashboard prints a "Win (TP1)" share: TP1 against the stop, no costs, the target checked first when one candle reaches both, and an opposite signal counted as a loss. Three alerts, decided on the live candle. Pine v6, MPL 2.0.
Finntech1's Volume & Trend Confluence Oscillator is one line, not a count. It takes the 14-candle rate of change of the close, multiplies it by the volume z-score when that is 2 or more in size (by 1 otherwise), halves it when it disagrees with the slope of the 34 EMA, and smooths it over 20 candles. BUY prints when the line crosses above zero within 2 candles of being below −0.2, with the 34 EMA not falling. One quirk: an unusually quiet candle, a z-score of −2 or lower, multiplies momentum by a negative number and flips its sign. Four alerts, in its own pane, decided on the live candle. Pine v5, no licence line.
Confluence indicator, no repaint
None of the ten reads a future candle on history. Only MarkitTick's uses lookahead_on, and it pairs it with [1], the standard way to read the last closed higher-timeframe candle. What still moves:
- The live candle. Seven of the ten decide their marks as the candle forms, so a signal can print and vanish before the close. Set their alerts to once per bar close.
- One hidden line. Confluence Suite's Chikou line is drawn a candle back (
offset = -cloud_offset + 1), but it is hidden (display.none). - Swings. Labels drawn back on a swing appear only once the swing is confirmed: 10 candles later in AlgoAlpha's Market Structure Confluence, 20 in InvestyourAsset's.
- Another timeframe. AlgoAlpha's SuperTrend table and Viprasol's second RSI follow the forming candle of their timeframe on a live chart.
More on telling them apart in how to tell if an indicator repaints.
Which confluence indicator is best?
By the counting rule above, none of the ten counts independent kinds, waits for the closed candle and tracks a full plan. The closest on honesty is InvestyourAsset's Liquidity Breakout PRO with Volume Confluence: two different kinds (a swing break and volume), decided on the closed candle, with a stop and three targets. Know that the targets are drawn, not tracked, and that two conditions are a short list. If you want a longer count, Viprasol's has a closed-candle trigger and a full plan; read its seven factors as five on a 5-minute chart, and check the stop yourself. The most-boosted, LuxAlgo's, is a drawing toolkit that counts nothing. MarkitTick's three Supertrends are one kind of check three times. All ten are Pine Script and run only on TradingView, not MT4 or MT5.
Two smaller ones sit lower in the census: pawehu's six-condition ribbon, above, and AlgoTrader90's Confluence Checklist (168 boosts), a table of eight criteria you type in yourself, each with a ✅ beside it that is on by default: a note on the chart, not a reading of it.
Signal Desk: one check per kind, and limits that can say no
Signal Desk is our entry checklist indicator, in Pine Pro Library. It does on every closed candle what this post recommends: five checks, one of each kind, counted with equal weight, then limits that can refuse the entry whatever the count. Its five, in its manual's words:
- Trend: "Supertrend and fast/slow EMA direction agree."
- Momentum: "RSI is on the trade’s side of its average and 50."
- Structure: "the last confirmed swing break agrees."
- Location: "close is near the fast EMA; long range is half an ATR below to one ATR above. Shorts mirror it."
- Candle: "a strong directional body, close near its extreme, and no oversized range."
Momentum is one check: one RSI rule, not a stack of oscillators. The grade is the plain count: "Default grades: A = five, B = four, C = three. Minimum B. Raising the minimum reduces qualifying setups; it does not establish better outcomes." Its extra readings stay out of the count: "VWAP side, higher-timeframe direction and proximity to the day’s high/low are three context factors. They and learned strength are information by default, not extra entry gates."
Then the vetoes: "Any one blocks it: candle high–low range above 2.5 ATR; directional stretch from fast EMA above 2 ATR; or range of the last three closes above 3 ATR, with the close beyond the close three candles ago in the entry direction. Exact equality passes." By default it allows 2 entries a day and waits 6 candles after an exit. Its Pine source sets the rest: Supertrend (10, 3), the 20 and 50 EMAs, RSI (14) with its 14-candle average, swings 5 candles each side and ATR (14). Its full source is in the library.
Signal Desk Premium, $49 once, uses the same entries and the same grades, and adds the work around them: a GET READY heads-up before the signal, a trade ticket sized from your risk, scale-outs, a daily loss lock and a 20-market Radar with one alert on a paid TradingView plan, plus a relay to Telegram and Discord. Its page on the grade: "Conditions, not odds. A means all five setup factors were there, B four, C three; a grade says nothing about how likely a trade is to work." And on what it adds: "Premium uses the same entries as the library desk. It does not promise better results; it makes the same signals easier to prepare for, size, manage, filter and act on." It never places orders. Its alerts, like any indicator alert, need a paid TradingView plan: TradingView's pricing page, read 29 October 2026, lists "Active technical alerts on indicators, strategies, and drawings" as ✗ on Basic and 20 on Essential.
Limits
The drill's candles and the agreement table are simulated: they show how these checks relate on one simulated market, not on yours, and they are not a result. Our multi-timeframe backtest covers one market, one window and two horizons, and tested agreement among trend indicators, not a count of different kinds. Our Signal Desk study is in-sample, on one symbol. The code read covers the versions TradingView served on 29 October 2026; scripts change, and boosts measure popularity, not quality. We tested none of the ten.
Sources
- Our studies: the multi-timeframe confluence backtest and the Signal Desk study, quoted from the posts.
- Signal Desk's manual, /en/pine-library/signal-desk (Signal Desk 1.2.0), and its Pine source for the defaults; Signal Desk Premium's page for the grade answer and the honesty line, both read 29 October 2026.
- TradingView's script search for "confluence", 29 October 2026, and the open-source code of the scripts above, read the same day; TradingView's pricing page, read 29 October 2026.
- Dawes, "The robust beauty of improper linear models in decision making", American Psychologist 34(7):571–582, 1979, doi:10.1037/0003-066X.34.7.571; read 29 October 2026.
- The drill and the agreement table:
src/components/blog/confluence/confluence-example.ts, simulated five-minute candles from the market Signal Desk's page films use.
Disclosure
We, ProEA Lab, build and sell Signal Desk (in Pine Pro Library) and Signal Desk Premium (in the Premium Vault), and the multi-timeframe matrix our backtest tested. We have no relationship with any author named here. The code is AI-assisted. The drill's candles are simulated: not a market, and not a result. A count of checks is a description, not a forecast. Nothing here is financial advice. Trading involves risk.
Frequently asked questions
What is confluence in trading?
Several independent conditions agreeing on the same candle: the trend is up, momentum is up, price has broken a swing high, the close is near its average and the candle is strong. What matters is the count. Conditions that read the same prices the same way, like RSI, MACD and stochastic, are one condition asked three times, so they add one to the count, not three.
What does confluence mean in forex?
The same as in any market: several separate conditions agreeing on one candle before you enter. Nothing about it is specific to currencies. The checks in this post are written in candles and ATR, so they read the same on a currency pair, an index, a stock or gold.
What is a confluence zone in trading?
A price area where several levels sit together, such as a Fibonacci retracement, a prior swing and a moving average. The counting rule still applies: levels drawn from the same swing are one piece of evidence, not several. A zone says where to look, not what will happen there.
What should be on a confluence checklist?
One check of each kind, each answerable yes or no from the chart: trend, momentum, structure, location and candle. Then limits that refuse the trade whatever the count: no candle over 2.5 ATR, no close more than 2 ATR from the 20 EMA, no entry after a three-close run over 3 ATR, and a cap on entries a day. Count the checks with equal weight, and read the count as a description of the setup, not odds.
What is a confluence filter in trading?
A condition a signal must also meet before it counts, such as a trend filter that allows longs only while the 20 EMA is above the 50 EMA. A filter is one more check, so the same rule applies: if it reads the same prices the same way as a check already on your list, it adds nothing new.
What is the best confluence indicator on TradingView?
None of the ten open-source confluence scripts we read counts independent kinds, waits for the closed candle and tracks a full plan. The closest is InvestyourAsset's Liquidity Breakout PRO with Volume Confluence: a close beyond the last swing plus above-average volume, decided on the closed candle, with a stop and three targets it draws but doesn't track. The most-boosted, LuxAlgo's Fibonacci Confluence Toolkit at 14,921 boosts, draws structure and Fibonacci levels and counts nothing. Boosts measure popularity, not results.
Does more confluence mean a better trade?
Not by itself. In our multi-timeframe backtest of 1,131 hourly gold-futures readings, all five timeframes agreed 28.6% of the time, and the most-aligned third of readings hit 47.5% over the next hour against 47.1% for the least-aligned third. A count describes the setup on the close. It is not the odds of a win.