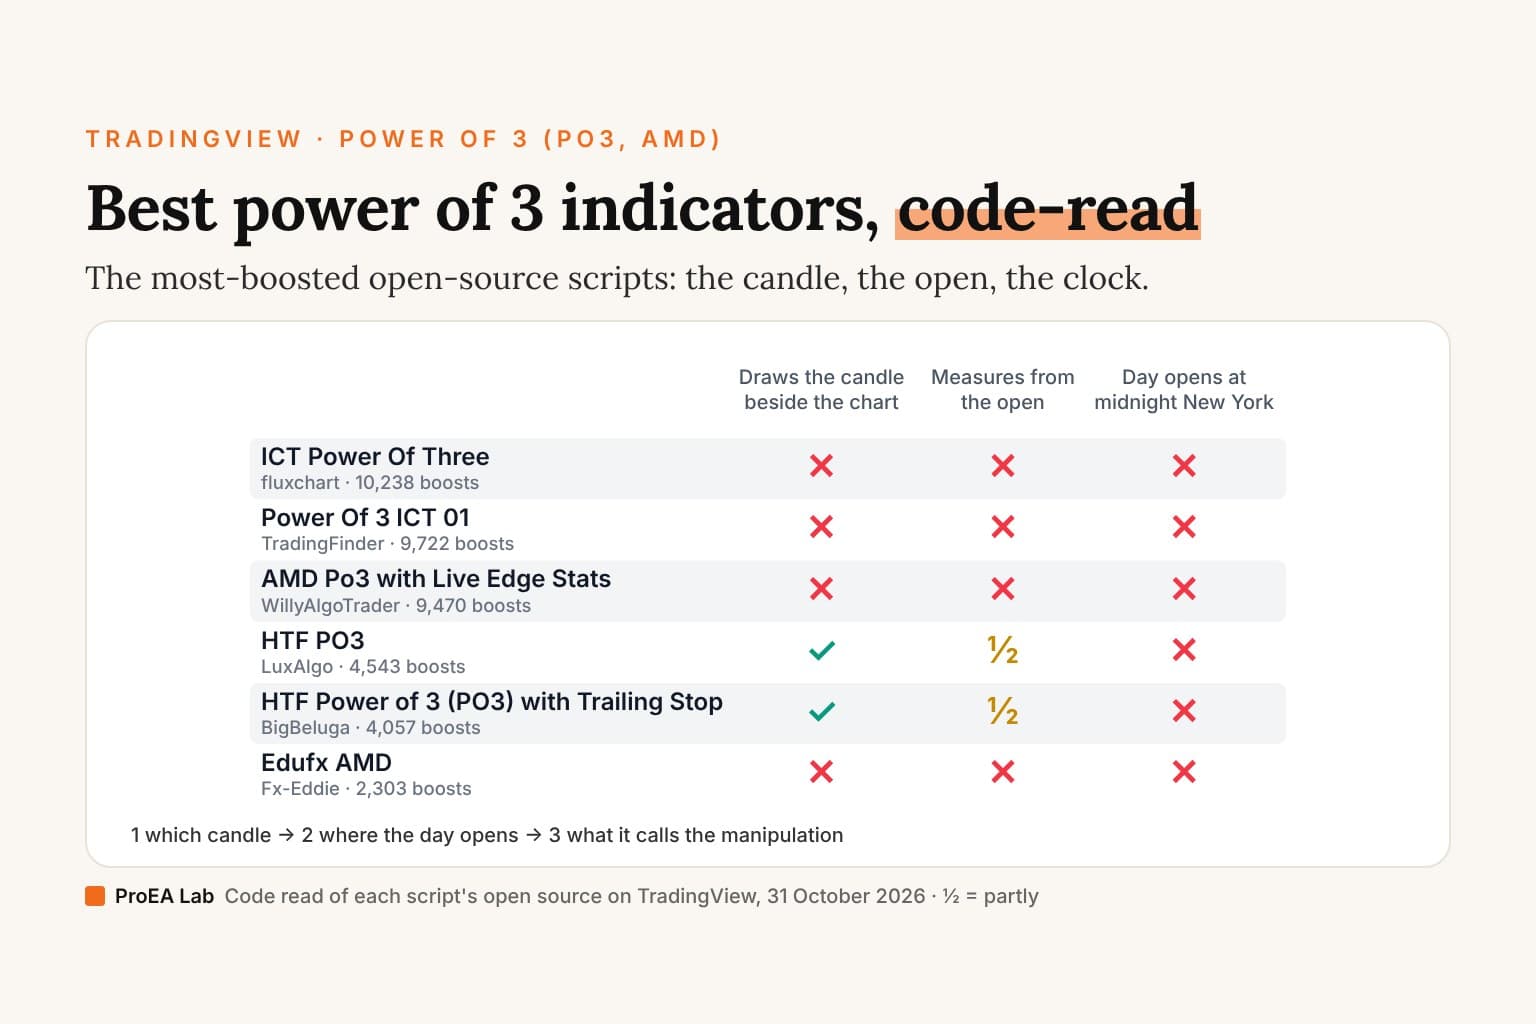
Short answer: the most-boosted power of 3 script on TradingView, HTF Power of Three° by toodegrees (26,700 boosts), is protected, so we couldn't read it. Of the open-source ones, the most boosted, ICT Power Of Three by Flux Charts (10,238 boosts), has no open and no higher-timeframe candle: it trades a break of a quiet range on your chart's own candles. For the power of 3 candle itself, drawn beside your chart, HTF PO3 by LuxAlgo (4,543) is the most-boosted open one. Set it to D, since it draws a 1-hour candle by default, and know that its day is TradingView's daily candle, which opens at 18:00 New York on CME futures, not at midnight. Of the 15 we read, only AMD Range+ by arleay (765) opens the day at midnight New York, the open ICT's guides mark; one more says it does and doesn't.
Most lists name power of 3 indicators.
This one reads them.
What we checked
Power of 3, or AMD (accumulation, manipulation, distribution), is ICT's reading of one candle, most often the day's, in three parts: price ranges near the open, makes a fake move to one side of it, then runs the other way. innercircletrader.net's power of 3 page (last updated 6 May 2026) puts the bullish day in one line: "The bullish day prints a wick below the open (the manipulation low), runs to the high of the day to clear external liquidity, and closes near the high of the daily range." The same page: "Mark the daily opening price at midnight New York time."
So a power of 3 indicator has two jobs: show the candle, and put the open where the trader means it. A third is harder: say what happened in what order, which one candle can't show.
We searched TradingView's scripts for five terms on 31 October 2026 ("power of 3", "power of three", "po3", "amd" and "accumulation manipulation distribution") and kept the titles with "power of", "PO3", "accumulation manipulation" or "AMD" as a word. That leaves out five quarterly-theory scripts named AMDX or XAMD, which split time into four parts, among them TradingFinder's XAMD/AMDX ICT 01 (3,883 boosts), which boxes the same three New York windows as its Power Of 3 ICT 01 plus a fourth, 13:00 to 19:00. That returned 109 scripts. None was about AMD the chipmaker's stock; one, The Power of 3 [Multi-RSI] by hotchkiss27, uses the name for three RSIs, so we dropped it. That leaves 108: 60 open source, 35 protected (free to add, with the code hidden) and 13 invite-only. We read the 15 most-boosted open-source scripts that draw some part of power of 3: every line that decides what is drawn. Three more boosted ones carry the name without the concept; they're under the table.
The questions:
- The candle: which higher-timeframe candle it profiles (the day, 4 hours, or one you choose), and whether it draws that candle beside your chart.
- The open and the manipulation: where it puts the open, and what it calls the manipulation leg.
- The clock: when its day starts: TradingView's daily candle, midnight New York, or a clock of its own.
- The request: if it asks for higher-timeframe data with
request.security(), whether lookahead can leak. - When it decides: on a closed candle, or on the live one.
- Alerts, and the licence line.
Boosts as TradingView's search showed them on 31 October 2026. "TradingView's candle" in the table means the script takes the candle TradingView itself draws for that timeframe, whose day follows the symbol's session.
The table
| Script | Boosts | The candle | The open and the manipulation | The clock | The request | Decides | Alerts | Licence |
|---|---|---|---|---|---|---|---|---|
| ICT Power Of Three (fluxchart) | 10,238 | None: ranges on your chart's own candles | No open. A box round the last 40 candles if they span no more than 5 ATR, widened by 0.5 ATR; "manipulation" is a wick 0.6 ATR beyond it, either side | None | None | Closed candles; it enters the other way at that candle's own close | Buy, Sell, take profit, stop loss | MPL 2.0 |
| Power Of 3 ICT 01 [TradingFinder] AMD ICT & SMC Accumulations (TradingFinder) | 9,722 | None: three boxes, on charts of an hour or less | No open. The 01:00 to 07:00 box is "Manipulation", whatever price does in it | New York: 19:00 to 01:00, 01:00 to 07:00, 07:00 to 13:00 | None | Live: the boxes grow with the candle | None | MPL 2.0 |
| AMD Po3 with Live Edge Stats [WillyAlgoTrader] (WillyAlgoTrader) | 9,470 | None: a quiet range on your chart's own candles | No open. A wick more than a tenth of the range's width beyond it, then a close back inside within 6 candles: "M", and its "D" reference trade opens at that close | None by default; its killzone filter (off) reads UTC | Its bias filter (off): [1] with lookahead on | Closed candles; the range's sides from pivots confirmed 3 candles late | Sweep, distribution, outcome | None |
| HTF PO3 [LuxAlgo] (LuxAlgo) | 4,543 | You choose, 1 hour by default; one candle (up to 10) drawn 15 candles right of price | Dashed lines from the chart candles that made the open, high and low to the drawn candle; no part named | TradingView's candle | None: built from chart candles | Live: the drawn candle is the forming one | None | CC BY-NC-SA 4.0 |
| HTF Power of 3 (PO3) with Trailing Stop (BigBeluga) | 4,057 | Picked from your chart (15 minutes: 2 days; 1 hour: a week), or D with Auto off; the forming candle beside price | An open line. "Manipulation" at the first close outside the high and low of the 10 chart candles after the period's first; "Distribution" when a 3 × ATR trailing stop is crossed | TradingView's candle | None | "Manipulation" on a closed candle; "Distribution" on the live close | None | CC BY-NC-SA 4.0 |
| Edufx AMD~Accumulation, Manipulation, Distribution (Fx-Eddie) | 2,303 | None: boxes for each day and week | No open. 20:00 to 05:00 is accumulation, 05:00 to 11:00 manipulation, 11:00 to 20:00 distribution | Its Timezone setting, New York, on the exchange's calendar date | None | Live: the boxes grow | None | None |
| Session HL + Candles + AMD (Nephew_Sam_) (nephew_sam_) | 1,740 | Four session candles beside price: Asian, London, NY AM, NY PM; no daily candle | Each session's own open; the three parts aren't named | A fixed GMT-4: New York in summer, an hour early from 1 November | None | Live | None | None |
| $ - HTF Sweeps & PO3 (wintonbanks) | 1,531 | Three 1-hour and two 4-hour candles beside price by default (15 minutes to monthly) | No open line. A sweep line where a candle's wick takes the previous candle's high or low and its body stays inside | TradingView's candle | None | Sweeps drawn as the candle forms, dropped if its body closes through | Previous candle's high or low reached (on), sweep formed (off); 02:00 to 05:00 New York by default | MPL 2.0 |
| Custom Opening Price Levels (PO3) (NarcotikT) | 1,036 | You choose, D by default; no candle drawn | Lines at the last three opens, "D Open 1" the current; no manipulation | TradingView's candle | Lookahead on for the open, which is safe: an open is set when its candle starts | The open is fixed at the candle's first trade | None | None |
| The Distilled HTF PO3 (DistilledTrades) | 815 | Picked from your chart (15 minutes: 4 hours; 1 hour: 7 hours); 5 candles beside price | When each candle closes, a box from its open to the wick against its close; after a sweep and reclaim, from the swept level to the sweep's tip | TradingView's candle | None: built from chart candles | Closed candles | 3, on a sweep-and-reclaim candle's close | None |
| PO3 Matrix+ (M1D) (mayb1dayy) | 792 | Picked from your chart (15 minutes: 4 hours; 1 hour: the day), or set; 15 candles beside price | No open line or leg; a dashboard row names the phase by the clock | Candles: TradingView's. Phase row: New York, 18:00 to 01:00, 02:00 to 06:00, 09:30 to 16:15 | Closed candles: [1] with lookahead on; the forming one from chart candles | Its sweeps and structure shifts on closed candles | Sweeps and structure shifts | MPL 2.0 |
| AMD Range+ (arleay) | 765 | Daily by default (30 minutes to weekly); no candle drawn | A dotted line at the open, "Daily O". Manipulation: a sweep out of a range on your chart's candles, closed back inside within 30 minutes; it must pass the open only if you switch that on | New York: the day from 00:00, 4 hours from 18:00, though midnight cuts the 22:00 one in two | None | Closed candles, on charts up to 15 minutes | Long and short entries | MPL 2.0 |
| AMD [TakingProphets] (TakingProphets) | 745 | You choose, 15 minutes by default; the forming candle beside price | Dotted lines from its open and close to the drawn candle; no part named | TradingView's candle | The forming candle, lookahead off: right live | Live | None | None |
| Goldbach + PO3 Grid [GBB] (GoodBadBitcoin) | 609 | A daily cycle by default (weekly, monthly or a session); no candle drawn | The period's first open. Manipulation when a close gets 0.5 ATR from it; distribution when a close crosses back 1 ATR beyond it, with a fair value gap | Labelled "Daily NY Midnight", but it fires when TradingView's daily candle opens | None for the cycle | The live close: no closed-candle check | 9, among them manipulation started and distribution confirmed | TradingView's free open-source licence |
| AMD Structure Map [AxeAlgo] (AxeAlgo) | 595 | None: ranges on your chart's own candles | No open. A wick 0.42 ATR beyond a quiet range on 1.4 times the range's average volume, closed back inside within 5 candles | None | Its bias, shown only: lookahead off | Closed candles | 7: a new range, the direction call, distribution, failure, expiry | None |
Named power of 3, without it
Three of the most boosted carry the name and draw no part of it:
- MMXM ICT [TradingFinder] Market Maker Model PO3 CHoCH/CSID + FVG (TradingFinder, 4,878 boosts) draws a market maker model: swing levels from a 1-hour timeframe by default, SMT divergence against XAUUSD by default, structure shifts and fair value gaps. No open, no accumulation, no manipulation.
- CRT AMD indicator (thesyndicate_forex, 4,138) marks a candle that trades above the previous candle's high, keeps its low above the previous low and closes back below the previous high, and the mirror, on your chart's own candles, with two alerts. It's in our CRT code read.
- AMD Liquidity Sweep with Alerts (OOCONNOR454, 1,203) draws the nearest "intermediate" swing beyond a range of the candles from 00:00 to 06:59 on the exchange's clock, and alerts on a close through it.
The other 35 with closed code are protected: free to add, with the code hidden. The most boosted of all, HTF Power of Three° by toodegrees (26,700 boosts), and [TTM] HTF Candle Overlay (Power of 3) by TheTickMagnet (8,864) are among them; we can't say what their code does. Thirteen are invite-only, among them toodegrees' HTF Power of Three° [Pro+] (4,097).
What the code says
Five have no open to measure from. Flux Charts', TradingFinder's, WillyAlgoTrader's, Edufx's and AxeAlgo's read AMD on your chart's own candles or on the clock: no higher-timeframe candle, no open. Flux Charts' "manipulation" is a break: a wick (by default) 0.6 times the 50-candle ATR beyond a box drawn round the last 40 candles, if those spanned no more than 5 ATR. It then enters the other way at that candle's own close, with no close back inside asked for. WillyAlgoTrader's does ask for one: a wick more than a tenth of the range's width beyond it, then a close back inside within 6 candles, and its "D" reference trade opens at that close. AxeAlgo's, on its default Strict setting, wants a wick 0.42 ATR beyond a range on 1.4 times the range's average volume, closed back inside within 5 candles. TradingFinder's and Edufx's are clocks. TradingFinder's boxes 19:00 to 01:00 as accumulation, 01:00 to 07:00 as manipulation and 07:00 to 13:00 as distribution; Edufx's 20:00 to 05:00, 05:00 to 11:00 and 11:00 to 20:00, New York time. Each box is the window's high and low, whatever price did in it.
Seven draw a higher-timeframe candle beside your chart, and most don't default to the day. LuxAlgo's draws one 1-hour candle by default, TakingProphets' a 15-minute one, wintonbanks' three 1-hour and two 4-hour candles, and Nephew_Sam_'s four session candles. BigBeluga's, DistilledTrades' and mayb1dayy's pick from your chart: on a 15-minute chart, a 2-day, a 4-hour and a 4-hour candle; on a 1-hour chart, a weekly, a 7-hour and a daily one. For the day's candle, set the timeframe yourself: D on LuxAlgo's, "1 DAY" on TakingProphets'.
Where the open is, and what gets called the manipulation. LuxAlgo's ties the drawn candle's open, high and low to the chart candles that made them with dashed lines and names no part. TakingProphets' carries the open and the close across to its candle. BigBeluga's draws the open, then calls "Manipulation" at the first close outside the high and low of the 10 chart candles after the period's first: a break of the early range, the move power of 3 reads as the fake. "Distribution" comes only when price turns and closes through a 3 × ATR(14) trailing stop. DistilledTrades' boxes each closed candle from its open to the wick against its close; for a candle that took the previous candle's extreme and closed back inside, from the swept level to the sweep's tip instead. Its own tooltip warns: "As a SIGNAL the open-to-wick reading is a tautology". Any candle with a wick on the far side of its open gets that box. GBB's is the one that times it from the open: its manipulation starts when a close gets more than 0.5 ATR(14) from the open, on the side it went, and its distribution when a close crosses back through the open, at least 1 ATR beyond it, with a fair value gap that way among the last four candles. arleay's draws the open but reads its manipulation as a sweep out of a range of 8 to 60 chart candles, closed back inside within 30 minutes on a body of at least 0.8 ATR. The sweep has to pass the open only if you switch "Sweep must pass the PO3 open" on; it's off.
Most take TradingView's candle, and its day isn't midnight. Eight build their candle or cycle from TradingView's own candle of that timeframe: LuxAlgo's, BigBeluga's, wintonbanks', NarcotikT's, DistilledTrades', mayb1dayy's, TakingProphets' and GBB's. A TradingView daily candle follows the symbol's session. TradingView's symbol data, read on 31 October 2026, gives CME_MINI:ES1! a 17:00 to 16:00 Chicago session (18:00 to 17:00 New York), FX:EURUSD 17:00 to 17:00 New York and BINANCE:BTCUSDT a round-the-clock session on UTC. So their daily open is the 18:00 New York price on ES, 17:00 on EURUSD and 00:00 UTC on Bitcoin. mayb1dayy's own tooltip says so for its previous-day levels: on futures the daily bar "spans the full electronic session (18:00-17:00 NY)", and on 24/7 markets "their daily candle rolls at 00:00 UTC". Of the 15, arleay's alone opens its daily candle at midnight New York: it keys the day on year(time, NY), month(time, NY) and dayofmonth(time, NY), and starts its 4-hour candles at 18:00 New York, though midnight cuts the 22:00 one in two.
GBB's "Daily NY Midnight" isn't midnight. Its Anchor setting defaults to "Daily NY Midnight", with the tooltip "ICT canon: Daily NY Midnight." The code is ta.change(time("D", "", "America/New_York")) != 0. TradingView's Pine manual, on time(): "If the session argument is an empty string or not specified, the function uses the symbol's session information." The time zone "defines the time zone of the specified session. It does not change the meaning of returned UNIX timestamps". The session here is empty, so the anchor fires when TradingView's daily candle opens, 18:00 New York on ES and 17:00 on EURUSD, and its "true open" is that candle's open. Its "Daily UTC" option, time("D", "", "UTC"), fires on the same candle.
Two more clocks to check. Nephew_Sam_'s Timezone setting is a list of fixed offsets, "-4" by default, passed as "GMT-4". That's New York's clock in summer only: from 1 November 2026, when New York moves to GMT-5, its Asian candle starts at 17:00 New York, London at 01:00, NY AM at 07:00 and NY PM at 11:00. Pick "-5" for winter. Edufx's day starts at timestamp(timezone, year, month, dayofmonth, 20, 0, 0): 20:00 on its Timezone setting, but on the exchange's calendar date. On a symbol whose exchange clock runs on UTC, such as BINANCE:BTCUSDT, 20:00 New York is already the next UTC date, so each new cycle starts a day late: by our reading, every other New York day gets no boxes. It also keeps one box per phase and moves it to each new cycle, so only the latest stays on the chart. Its weekly cycle's comment says "Sunday 5 PM", but dayofmonth - dayofweek is the Saturday before.
The requests are mostly safe, because most make none. Nine of the 15 ask for no higher-timeframe data at all and build everything from your chart's candles, which can't look ahead. NarcotikT's asks for the open with lookahead on and no [1]; for an open that's safe, since it's set when its candle starts. mayb1dayy's asks for its closed candles in the manual's form, [1] with lookahead on, and builds the forming one from chart candles. TakingProphets' asks for the forming candle with lookahead off, which is right on a live chart. WillyAlgoTrader's optional bias filter uses the manual's form; AxeAlgo's bias, shown in its panel and used for nothing else, asks with lookahead off; GBB's asks for its Goldbach grid's range with lookahead off, while its power of 3 cycle reads chart candles.
When they decide. Flux Charts', WillyAlgoTrader's, DistilledTrades', arleay's and AxeAlgo's call their phases on closed candles (barstate.isconfirmed). BigBeluga's "Manipulation" waits for a close; its "Distribution" reads the live close, so the label can print mid-candle and vanish before the close. GBB's has no closed-candle check: its phases change on the live close, so set its phase alerts to fire once per bar close. A candle drawn beside the chart is the forming one by design: its body and wicks move until it closes.
Small things worth knowing. TradingFinder's draws its boxes only on charts of 60 minutes or less, and each box takes in the first candle after its window: its high and low update while On[1] == 1 or On == 1. TakingProphets' time label adds an hour to the candle's start on the exchange's clock (adjusted_hour = hour(htf_t) + 1): New York time on CME futures, an hour ahead of it on FX. wintonbanks' alerts are limited to 02:00 to 05:00 New York by default. Three print statistics of their own signals on the chart: Flux Charts' "PO3 Backtesting" panel, WillyAlgoTrader's dashboard and AxeAlgo's "Follow-Through Rate". We haven't tested them and don't repeat them. arleay's marks each setting it chose itself "not from the source" in its tooltip.
Where does the day open?
On a stock's regular hours, TradingView's daily candle and the New York day start together. On a market that trades through the night they don't, and power of 3 is read from the open. Pick a start below: the made-up candles stay put; the open moves, and so does the leg below it.
18:00 New York: open 100.20; the leg below it is 0.06, from the 18:00 candle.
The day opens at Tue 18:00, so the evening's climb is part of its body. Its low, 100.14, is the first candle's; London's 03:00 low, 100.30, sits 0.10 above the open, inside the body. Day so far: open 100.20, high 101.12, low 100.14, close 100.98 at 16:00. A 0.78 body with a 0.06 wick under the open, made in the first hour: London's dip never reaches this open.
Illustrative candles, made up for this explainer (simulated): not a market and not a result. The made-up market trades from 18:00 New York, as CME index futures do, so the day's candle opens at 18:00 there; TradingView's symbol data, read on 31 October 2026, gives CME_MINI:ES1! a 17:00 to 16:00 Chicago session (18:00 to 17:00 New York). The leg is the wick on the far side of the open: open to low on a bullish candle, high to open on a bearish one.
Read as text: the 22 candles, with the day opening at 18:00 New York
| New York | Day | Open | High | Low | Close | Marks |
|---|---|---|---|---|---|---|
| Tue 18:00 | today | 100.20 | 100.30 | 100.14 | 100.28 | the day's open; the day's low |
| Tue 19:00 | today | 100.28 | 100.44 | 100.24 | 100.40 | |
| Tue 20:00 | today | 100.40 | 100.58 | 100.36 | 100.54 | |
| Tue 21:00 | today | 100.54 | 100.66 | 100.48 | 100.62 | |
| Tue 22:00 | today | 100.62 | 100.74 | 100.56 | 100.68 | |
| Tue 23:00 | today | 100.68 | 100.70 | 100.58 | 100.62 | |
| Wed 00:00 | today | 100.62 | 100.68 | 100.54 | 100.60 | |
| Wed 01:00 | today | 100.60 | 100.66 | 100.52 | 100.56 | |
| Wed 02:00 | today | 100.56 | 100.58 | 100.40 | 100.44 | |
| Wed 03:00 | today | 100.44 | 100.48 | 100.30 | 100.38 | |
| Wed 04:00 | today | 100.38 | 100.50 | 100.34 | 100.46 | |
| Wed 05:00 | today | 100.46 | 100.56 | 100.42 | 100.52 | |
| Wed 06:00 | today | 100.52 | 100.60 | 100.48 | 100.56 | |
| Wed 07:00 | today | 100.56 | 100.66 | 100.52 | 100.64 | |
| Wed 08:00 | today | 100.64 | 100.80 | 100.60 | 100.78 | |
| Wed 09:00 | today | 100.78 | 100.96 | 100.74 | 100.92 | |
| Wed 10:00 | today | 100.92 | 101.12 | 100.88 | 101.06 | the day's high |
| Wed 11:00 | today | 101.06 | 101.10 | 100.96 | 101.00 | |
| Wed 12:00 | today | 101.00 | 101.04 | 100.92 | 100.96 | |
| Wed 13:00 | today | 100.96 | 101.02 | 100.90 | 100.98 | |
| Wed 14:00 | today | 100.98 | 101.06 | 100.94 | 101.02 | |
| Wed 15:00 | today | 101.02 | 101.04 | 100.94 | 100.98 |
Under 18:00 New York, the day a script that takes TradingView's daily candle draws on ES, the open is 100.20 and the only trade below it is the first hour's 0.06. London's 03:00 dip to 100.30 sits inside the body. Under midnight New York, the same dip is a 0.32 wick below the open before the 10:00 high: the shape innercircletrader.net describes. Neither candle is wrong. They're different days, so pick the one your trading means, then check which one the script you add draws.
Ours
No desk of ours names accumulation, manipulation and distribution, so none is in the table. Two come close, and neither is on TradingView's search: their full Pine v6 source comes in Pine Pro Library, $49 once for every desk and every update.
Fractal Model Desk draws the last three higher-timeframe candles and the forming one beside the chart by default, for TTrades' Fractal Model. It picks the timeframe from your chart, so a 1-hour chart gets the day and a 15-minute chart 4 hours, and asks for the closed candles in the manual's form, [1] with lookahead on. They are TradingView's own candles, so on a 1-hour ES chart its daily candle opens at 18:00 New York, not at midnight. It names no part of the candle as accumulation, manipulation or distribution.
ICT Levels Desk draws the "00:00 open", which its tooltip calls "ICT's true day open": the open of the first candle of each New York day, read on its Timezone setting, America/New_York by default, so it's midnight New York on ES, EURUSD and Bitcoin alike. The line is drawn when that first candle closes, and the alert "Midnight open crossed" fires the first time a closed candle closes across it. It doesn't draw the day's candle, measure the leg below or above the open, or call a phase. It also draws the killzones and the previous day's high and low, and our code reads of killzone indicators and previous day high low indicators set it against those scripts.
The rule we write down for the day is in our Smart Money Concepts Rule Book. Its chapter "Time: killzones, the silver bullet and the power of 3" puts the windows on the New York clock, shows what daylight saving time does to them on yours, and works the one-hour and one-day setups built on them.
The deep version, as a PDF
The Smart Money Concepts Rule Book
ICT and SMC as exact rules on closed candles, every concept set against the ones it's confused with, and what our data says about each.
- 26 SMC and ICT terms, each one closed-candle rule: BOS, CHoCH, MSS, order blocks, breakers, fair value gaps, sweeps, OTE, killzones, SMT and more
- The comparisons traders search for, side by side: BOS vs CHoCH vs MSS, breaker vs mitigation vs order block, sweep vs grab vs breakout, FVG vs imbalance vs IFVG
- Every measurement we've published on these concepts, with its sample, period and costs, and why the book prints no win rate
One payment, instant download. Refund within 7 days if you haven't downloaded it.
We haven't measured whether trading power of 3 does better than not.
Check one yourself
- Find the day.
request.security(…, "D", …),time("D")andtimeframe.change("D")are TradingView's daily candle: 18:00 New York on CME futures. A time zone passed totime("D", "", …)with no session doesn't change that.dayofmonth(time, "America/New_York")changing is midnight New York. - Find the open. Look for the
openthe script saves when its period starts. No such line means the script has no open to measure from. - Find the manipulation. A clock window, a wick beyond a range, or a wick beyond the open? And does it ask for a close back inside before it calls it?
- Find the order. A daily candle can't show whether its low came before its high. Only a script that reads the chart's candles in time can.
- Find the close.
barstate.isconfirmeddecides on a closed candle; without it, a label you see live is the live candle's.
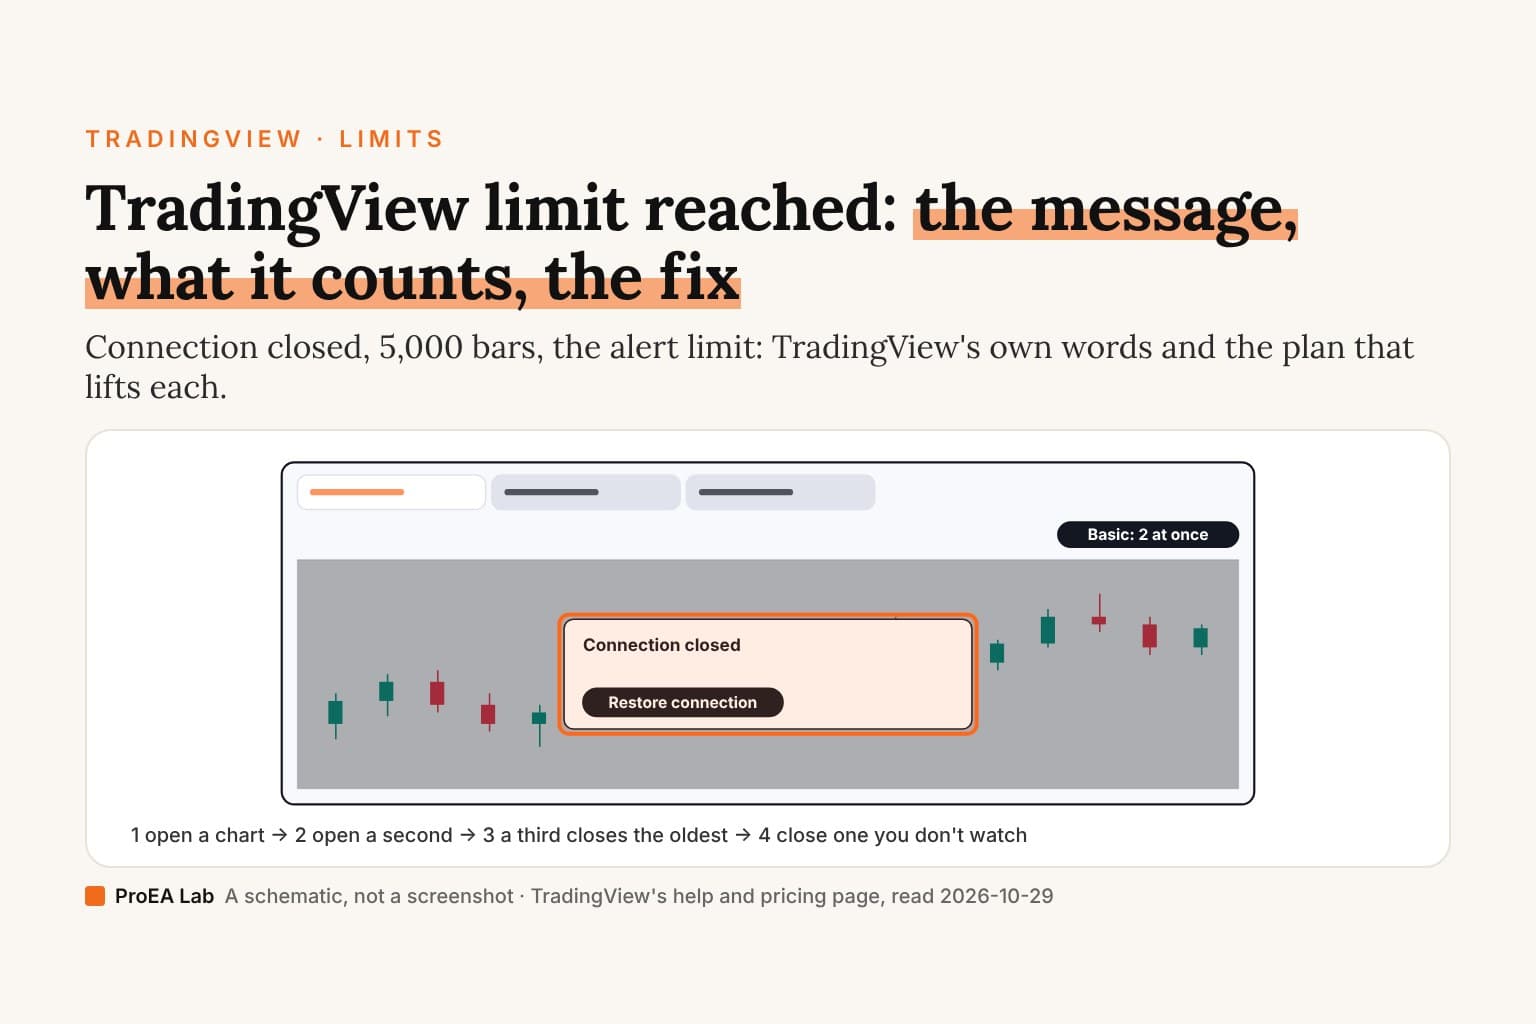
Alerts need a paid plan. TradingView's pricing page, read on 29 October 2026, shows no technical alerts on indicators on Basic, 20 on Essential, 100 on Plus, 400 on Premium and 1,000 on Ultimate.
Every script here, ours included, is Pine Script and runs only on TradingView: none runs on MT4, MT5 or NinjaTrader 8.
Sources
- Each script's Pine source, as TradingView served it on 31 October 2026, at its link in the table.
- innercircletrader.net, ICT Power of 3, last updated 6 May 2026, read on 31 October 2026.
- TradingView's Pine manual, read on 31 October 2026: Time and Other timeframes and data.
- TradingView's symbol data, read on 31 October 2026 from its scanner: CME_MINI:ES1!, FX:EURUSD and BINANCE:BTCUSDT.
- TradingView's pricing page, read on 29 October 2026.
- Fractal Model Desk and ICT Levels Desk: their Pine sources,
fractal-model-desk.pine(v2.1.0) andict-levels-desk.pine(v1.2.0), in Pine Pro Library.
Limits
One code read, on 31 October 2026, of the versions TradingView served that day. Scripts change, and boosts measure popularity, not quality. The drill runs made-up candles, not market data. We build and sell Fractal Model Desk, ICT Levels Desk and The Smart Money Concepts Rule Book, and we have no relationship with any author named here. Nothing here is financial advice.
Frequently asked questions
What is the best power of 3 indicator for TradingView?
It depends which part you want, and the most boosted is closed: HTF Power of Three° by toodegrees (26,700 boosts) is protected, so we couldn't read its code. Of the open-source ones, HTF PO3 by LuxAlgo (4,543 boosts) is the most boosted that draws the higher-timeframe candle beside your chart. Set it to D, since it draws a 1-hour candle by default, and know that its day is TradingView's daily candle, which opens at 18:00 New York on CME futures. Of the 15 we read, only AMD Range+ by arleay (765 boosts) opens the day at midnight New York, the open ICT's guides mark. The most boosted open one, ICT Power Of Three by Flux Charts (10,238 boosts), has no open at all.
What is a power of 3 candle indicator?
One that draws a higher-timeframe candle, usually the day's, beside your intraday chart, so you can watch its open, wicks and body form. Seven of the 15 open-source scripts we read draw one: LuxAlgo's, BigBeluga's, TakingProphets', wintonbanks', DistilledTrades', mayb1dayy's and, as four session candles, Nephew_Sam_'s. Most default to a candle other than the day's, and all but Nephew_Sam_'s build it as TradingView's own candle, which on CME futures opens at 18:00 New York, not at midnight.
What is ICT AMD (accumulation, manipulation, distribution)?
ICT's power of 3 under another name: one candle, most often the day's, read in three parts. Price ranges near the open (accumulation), makes a fake move to one side of it (manipulation), then runs the other way (distribution). A bullish day, in the words of innercircletrader.net's power of 3 page, 'prints a wick below the open (the manipulation low), runs to the high of the day to clear external liquidity, and closes near the high of the daily range.' The same page marks the open at midnight New York. Scripts named AMD read it three ways: clock windows, a range and a sweep on your chart's own candles, or the higher-timeframe candle drawn beside the chart.
Is there a free power of 3 indicator?
Yes. All 15 TradingView scripts in our table are open source and free to add: five are shared under the Mozilla Public License 2.0, two under CC BY-NC-SA 4.0, one under the TradingView open-source licence its file names, and seven carry no licence line. Another 35 are protected, free to add with the code hidden, so we couldn't read them, and 13 are invite-only.
Is there a power of 3 trading indicator with alerts?
Eight of the 15 have alerts. Flux Charts' sends Buy and Sell when price breaks beyond a quiet range, with take-profit and stop-loss alerts; WillyAlgoTrader's a sweep and its reference trade; arleay's a long or short entry; GBB's when its manipulation and distribution phases start; AxeAlgo's for each phase; DistilledTrades' when a higher-timeframe candle closes as a sweep and reclaim; wintonbanks' when price reaches the previous higher-timeframe candle's high or low; mayb1dayy's for sweeps and structure shifts. We haven't tested any of them for results. All are Pine Script, which runs only on TradingView.
Does ProEA make a power of 3 indicator?
Not by name. None of our desks names the three parts. Two come close, both in Pine Pro Library at $49 once with the full Pine v6 source of every desk. Fractal Model Desk draws higher-timeframe candles beside the chart: TradingView's own, the day's on a 1-hour chart, so on ES its day opens at 18:00 New York. ICT Levels Desk draws the midnight New York open and alerts when a closed candle closes across it. Our PDF guide, The Smart Money Concepts Rule Book, writes the rule down in its chapter on time: killzones, the silver bullet and the power of 3.