Download the options trading journal as an Excel workbook (.xlsx) or a CSV. It is our free trading journal template rebuilt for options: premiums per share, one Settings cell for the shares each contract controls, Risk taken from your stop premium or the position's maximum loss, Result net of fees, R, and days to expiry at entry. The Summary keeps the template's results and plan-discipline measures and adds average R for long (debit) and short (credit) positions and the average DTE. No email, no account.
| Sheet | What it holds |
|---|---|
| Trades | 23 columns: the template's 18, renamed for options where they need it, plus five more from S to W |
| Summary | Every measure as a formula: win rate, expectancy in R, profit factor, plan followed against plan broken, and this edition's three |
| Settings | One cell, Contract multiplier, set to 100 |
| Read me | The column rules and the order Risk is worked out in, so the file makes sense without this page |
For Google Sheets, upload the .xlsx with File → Import → Upload to keep the formulas, the Summary and the dropdowns. The CSV holds the 23 columns and the example rows with their worked-out values but no formulas, so rows you add won't calculate.
Your platform doesn't know the risk you planned. Type a stop premium you'd honour, or let the sheet count the most the position can lose.What should an options trading journal track?
One row per closed position, a single option or a whole spread. You type the premiums, contracts, fees and dates; Risk, Result, R multiple, Win/Loss and DTE at entry are formulas.
| Column | What you type | Why it matters |
|---|---|---|
| Date | The day you opened the position | DTE at entry counts from it |
| Underlying | SPY, QQQ, TSLA | Finds the name that keeps costing you |
| Position (Long = debit, Short = credit) | Long when you paid to open, Short when you were paid | Flips the sign of Result and picks the Risk rule |
| Strategy / reason | A setup name and a few words, written before entry | The why; the Strategy column is the menu |
| Entry premium (per share) | As your platform quotes it; for a spread, the net debit or credit | Risk and Result multiply it by the Settings cell |
| Stop premium (optional) | The premium at which you would close | When it's filled, it sets Risk |
| Target premium | Where you'd take the profit | Your plan, to read against the exit |
| Exit premium (per share) | What you closed at; 0 if it expired worthless | Sets Result |
| Contracts | How many | Multiplies everything |
| Risk (account currency) | Formula, below | The denominator of R |
| Result (account currency) | Formula, net of fees | What actually happened |
| R multiple, Win/Loss | Formulas | Make a 1-contract trade and a 10-contract trade comparable |
| Fees | Commissions and fees on every leg, opening and closing | Already inside Result |
| Followed plan? (Y/N), Mistake tag | From the dropdowns | Split the method from the rule breaks |
| Notes, Screenshot link | One line, and a link to the chart | The context you'll want on Sunday |
| Strategy | Long call, Long put, Debit spread, Credit spread, Iron condor, Covered call, Cash-secured put or Other | A closed menu you can total R by |
| Expiry | The expiration date | Feeds DTE |
| DTE at entry | Formula: Expiry − Date, in calendar days | Groups trades by how close to expiry you opened |
| Strike(s) | 700, or 590/585 for a spread | Text, for reading back |
| Spread width (credit spreads) | The distance between the strikes: 5 for 590/585 | Sets a credit spread's maximum loss |
Long or Short is about the cash, not the market view. A long put is Long, because you paid a debit, even though you are bearish; a put credit spread is Short. The Read me puts it in one line: "Position: Long when you paid a debit to open, Short when you received a credit. For a spread, type the net premium." The QQQ example is a put credit spread on the 590/585 strikes for a net credit of 1.25, so its row reads Short, entry premium 1.25, spread width 5.
The Settings cell: 100 shares a contract
Premiums are quoted per share, so every money formula multiplies by the one cell on the Settings sheet. The sheet labels it Contract multiplier and sets it to 100. Cboe's word for that 100 is the unit of trading. Its glossary, read 29 October 2026: "For most equity options, one contract controls one hundred shares of the underlying. The unit of trading in this case is 100 shares." Cboe keeps "multiplier" for cash-settled options: "The amount specified in a cash-settled option contract by which the current underlying interest value is multiplied to arrive at the value required to be delivered upon valid exercise of the cash-settled option contract."
So, for standard US equity and ETF options, the cell holds the unit of trading. For anything else, the cell's own note says: "Check your broker's contract details for others." It is one cell for the whole sheet, so a contract with a different number belongs in its own copy of the workbook. Cboe's own example of the arithmetic: "if you bought a $2 call option on an underlying stock trading at $50, you would pay a premium of $200 for exposure to $5,000 worth of stock."
How do you calculate risk on an options trade?
The sheet takes the first of four rules that applies, in the Read me's order:
- The stop premium, if you set one: |entry premium − stop premium| × 100 × contracts. The SPY example bought 2 calls at 3.20 with a stop at 1.60, half the premium: (3.20 − 1.60) × 100 × 2 = $320.
- Else, the debit paid, for a long position: entry premium × 100 × contracts. The TSLA example: 4.50 × 100 × 1 = $450. For a bought option, that is the most it can lose; the Options Industry Council's long call and long put pages both state "MAXIMUM LOSS Premium paid" (read 29 October 2026).
- Else, (width − credit) for a credit spread: (spread width − entry premium) × 100 × contracts. The QQQ example: (5 − 1.25) × 100 × 1 = $375.
- Else, a naked short: it has no defined maximum, so the cell stays blank and you type the risk you planned over the formula. The Read me: "A short option with no spread width has no defined maximum: type the risk you planned."
=IF(OR(E2="",I2=""),"",IF(F2<>"",ABS(E2-F2)*Settings!$B$2*I2,IF($C2="Long",E2*Settings!$B$2*I2,IF(W2<>"",(W2-E2)*Settings!$B$2*I2,""))))
The stop premium comes first because a journal measures you against the plan, not the worst case. That is the template's convention: Risk is fixed at entry, so a loss past your stop shows up as worse than −1R. Type rule 4's risk before you read the Summary; until then the row counts in Total trades and the win rate but in no R figure.
How do you calculate the result of an options trade?
Result = (exit premium − entry premium) × 100 × contracts, with the sign flipped for a credit, minus fees. A credit position makes money when the premium falls, so the flip turns a lower exit into a gain. An option that expired worthless has an exit premium of 0: a long one loses the whole debit plus fees, and a short one keeps the whole credit less fees.
=IF(OR(E2="",H2="",I2=""),"",(H2-E2)*IF($C2="Short",-1,1)*Settings!$B$2*I2-N2)
R multiple = Result ÷ |Risk|, and Win/Loss reads the sign of Result, both exactly as in the free template. DTE at entry = Expiry − Date, in calendar days. The sheet is arithmetic on what you type: it doesn't price the options, and the Read me says to "check your broker's statement for assignment and exercise."
What does a filled-in options journal look like?
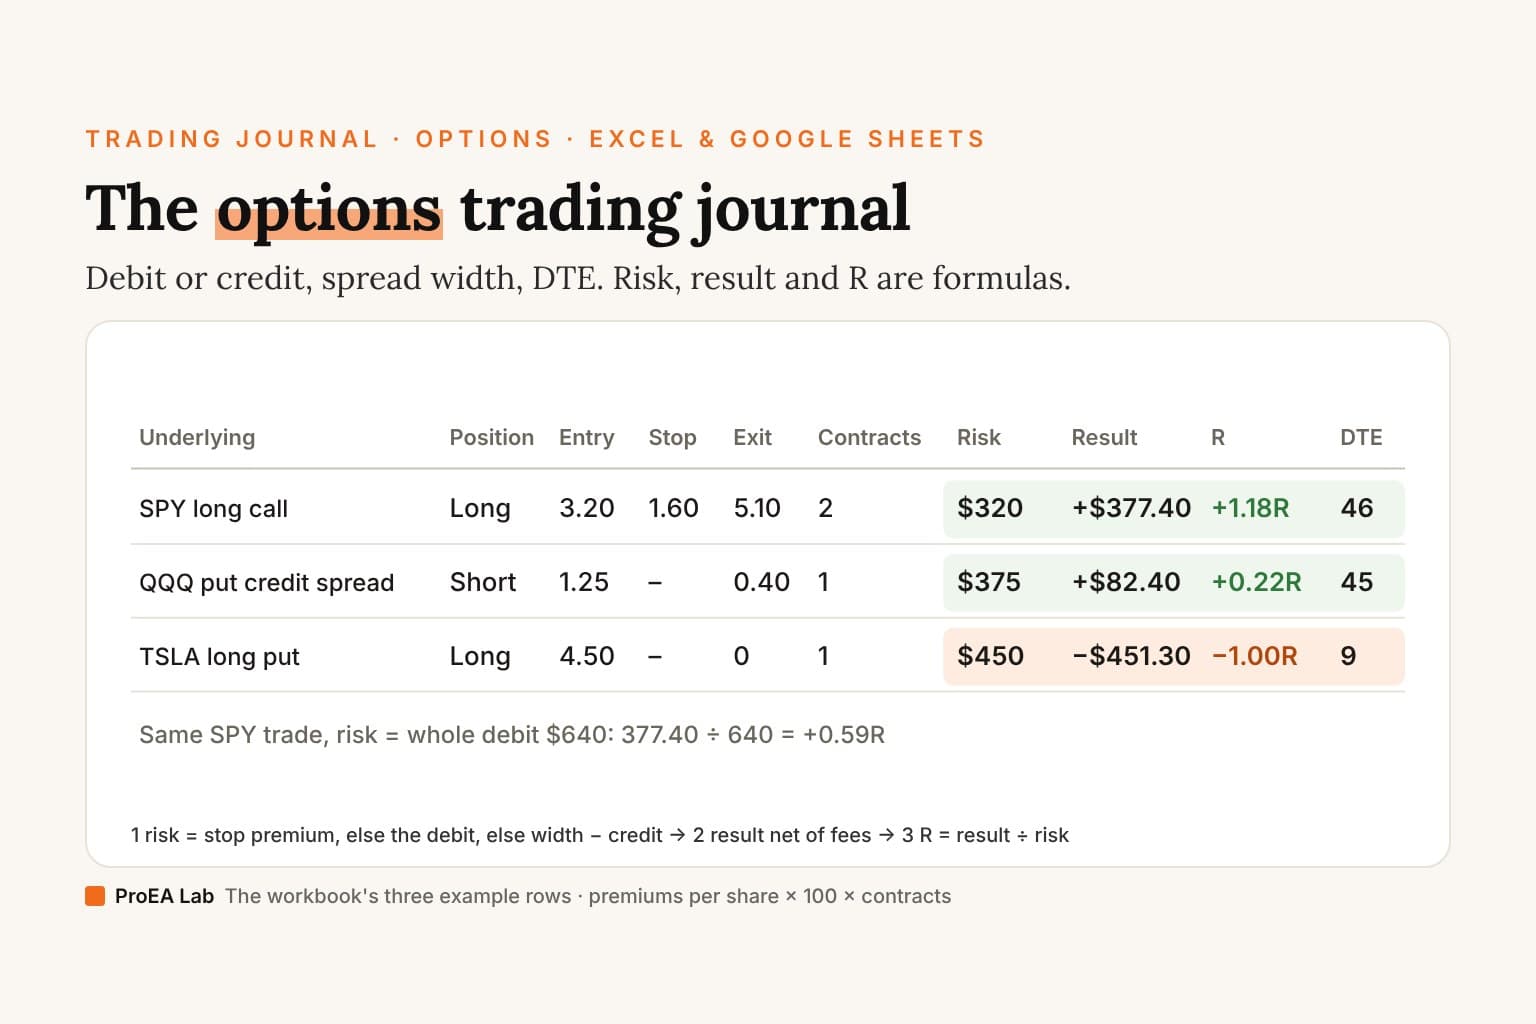
The workbook's three example rows, with LibreOffice's recalculated values:
| SPY long call | QQQ put credit spread | TSLA long put | |
|---|---|---|---|
| Position | Long (debit) | Short (credit) | Long (debit) |
| Strike(s), expiry | 700, 2026-11-20 | 590/585, 2026-11-20 | 400, 2026-10-16 |
| DTE at entry | 46 | 45 | 9 |
| Entry premium | 3.20 | 1.25 | 4.50 |
| Stop premium | 1.60 | none | none |
| Exit premium | 5.10 | 0.40 | 0, expired worthless |
| Contracts | 2 | 1 | 1 |
| Fees | $2.60 | $2.60 | $1.30 |
| Risk | $320 | $375 | $450 |
| Result | +$377.40 | +$82.40 | −$451.30 |
| R | +1.18R | +0.22R | −1.00R |
| Followed plan? | Y | Y | N, Chased entry |
SPY long call. Risk = (3.20 − 1.60) × 100 × 2 = $320. Result = (5.10 − 3.20) × 100 × 2 − 2.60 = $380 − $2.60 = $377.40. R = 377.40 ÷ 320 = +1.18R.
QQQ put credit spread. Risk = (5 − 1.25) × 100 × 1 = $375. Result = (0.40 − 1.25) × −1 × 100 × 1 − 2.60 = $85 − $2.60 = $82.40. R = 82.40 ÷ 375 = +0.22R.
TSLA long put. No stop, so Risk is the debit: 4.50 × 100 × 1 = $450. It expired worthless, exit 0: Result = (0 − 4.50) × 100 × 1 − 1.30 = −$451.30. R = −451.30 ÷ 450 = −1.00R.
The SPY row's R depends on the stop premium. Leave the stop blank and the sheet counts the whole debit as the risk: 3.20 × 100 × 2 = $640. The same +$377.40 is then 377.40 ÷ 640 = +0.59R. Same trade, same dollars, half the R. So the stop premium belongs in the row only if you would really have closed there; otherwise leave it blank, and the debit is your risk.
The TSLA row shows why the plan flag matters. In R it looks like an ordinary full loss, −1.00R. The N and the "Chased entry" tag are what tell you it was a rule break, not the method.
How do I track options trades from my broker?
Export what your broker documents, then type what it can't know. We read each platform's own help on 29 October 2026.
- Interactive Brokers: Flex Query. IBKR's guide (marked "Last updated on September 23, 2026"): "Click Performance & Reports > Flex Queries" … "Click the + icon in the Trade Confirmation Flex Query Templates section." The format choices are "XML, CSV, Text (Pipe), Text (Tab)", and the period choices run up to "Last 365 Calendar Days". The Activity Flex Query version starts with "Click the + icon in the top right corner of Activity Flex Query."
- Webull: Export Orders. "You have the capability to download your order history into a .csv file." On desktop: "Navigate to Account" → "Within the Orders widget, click Settings (three horizontal lines top right)" → "Select Export Orders". The file arrives by email: "a .csv file will be attached to an email from noreply@webull.com within 5-10 minutes."
- thinkorswim. The thinkManual's Account Statement page documents "Order History" and "Trade History" over a custom date range ("By default, all the data is shown for the last 24 hours. You can specify a custom date range…"). It doesn't mention exporting them to CSV, and its Monitor FAQ lists "Export to file…" only for the Position Statement menu. We found no documented CSV route for trade history, so read the rows off Trade History and type them.
IBKR's Trade Confirmation query and Webull's order history are, by their names, lists of fills and orders, not finished positions: one journal row combines a position's opening and closing fills, with the net premium for a spread. No export knows your stop premium, why you entered, whether you followed your plan or which mistake you made. Those columns are yours.
What should you review weekly in an options journal?
The template's five numbers first (the weekly review, in full): total trades, expectancy in R, plan followed against plan broken, the largest loss in R and profit factor. On the three example rows the Summary reads 3 trades, a 66.7% win rate, +0.13R expectancy, +0.40R in total, +$8.50 net after $6.50 of fees, a profit factor of 1.02, and +0.70R when the plan was followed against −1.00R when it was broken. Three rows prove nothing about a method; they show the arithmetic.
Then the three things options add:
- Average R, long against short. The Summary has both: +0.09R for long (debit) positions, the SPY win and the TSLA loss together, and +0.22R for short (credit) positions. Read it beside the count of trades on each side, and read it in R, because a credit spread's dollars and a long call's dollars carry different risks.
- DTE. The Summary's average DTE at entry is 33.3 days (46, 45 and 9). It gives you the average only; for R by DTE, sort Trades by DTE at entry and read down the R column, or note which rows are under a week. The loss here is the 9-day put.
- Strategy. The Strategy column is a fixed menu, so a formula can total it. On the Summary sheet,
=SUMIF(Trades!S:S,"Long call",Trades!L:L)gives the total R of your long calls (+1.18R on the examples) and=AVERAGEIF(Trades!S:S,"Credit spread",Trades!L:L)the average R of your credit spreads.
Last, count the mistake tags and total the R of the rows marked N, as in any journal. Write down the leak with the largest cost in R and one rule for next week. The trading expectancy calculator works the expectancy from your own win rate and average R if you want to check the Summary's.
The deep version, as a PDF
The Trading Journal Playbook
What to write on every trade and why, filled-in entries across markets, the pre-trade checklist, the weekly and monthly review with the arithmetic shown, and the same columns on paper, in a spreadsheet or an app.
- What to write on every trade, and why each of the template's eighteen columns exists, in the order you fill them
- 13 filled-in entries across forex, gold, an index CFD, a partial close, a prop-firm evaluation day, a skipped trade and a backtest, every Risk, Result and R worked from the prices
- The pre-trade checklist, and how a month of mistake tags turns into checks of your own
Opens soon · USD 19, one payment. See what's inside →
Options trading journal in Excel, Google Sheets or an app?
In Excel, open the .xlsx. In Google Sheets, upload it (File → Import → Upload, then Replace spreadsheet or Create new spreadsheet) and check the Summary reads 3 trades and +0.13R before you delete the example rows. The CSV has the example rows with their worked-out values but no formulas and no Settings sheet, so rows you add won't calculate: use it to move rows, not to start a journal.
The calculators fill the planning columns before the trade:
- the options profit calculator gives a long call or put's break-even and its contract stop risk before you enter;
- the 0DTE options calculator gives a credit spread's max risk with commission on every leg, for SPX, SPY and QQQ;
- the theta and IV crush calculator shows how much time decay and an implied-volatility drop take from a premium;
- the expected move calculator gives the move the options market prices, from the implied volatility, the straddle or the VIX.
Ours, TradeLens, imports MT4 HTML statements and MT5 history, and takes a broker CSV through its column-mapping wizard. It is MT4, MT5 and CSV only, built for forex and CFD traders, not a multi-asset journal, so for an options journal this free workbook is the tool we'd point you to. For the same columns on paper, there's the printable trading journal; for whole entries filled in, six trading journal examples.
The example rows are made up and marked EXAMPLE; their premiums are illustrative, not quotes. Nothing here is a view on any strategy or a claim about results. We recalculated the workbook in LibreOffice on 29 October 2026 and checked every computed cell against the same arithmetic in plain Python.
Frequently asked questions
What should an options trading journal include?
Everything a stock journal has, plus what options add: whether you paid a debit or took a credit, the entry and exit premium per share, contracts, the shares each contract controls (100 for most equity options), the strategy, the expiry and days to expiry at entry, the strikes and, for a credit spread, its width. Risk, the net result and R are worked out from those.
How do you calculate risk on an options trade?
In the sheet's order: the distance from entry to your stop premium, times 100, times contracts, if you set a stop; otherwise the debit paid for a long position; otherwise the spread width minus the credit, times 100, times contracts, for a credit spread. A naked short option has no defined maximum, so you type the risk you planned.
How do you record an option that expired worthless?
Type 0 as the exit premium. A long option that expires worthless loses the whole premium plus fees: the TSLA example paid 4.50 on one contract, so its result is −$451.30 and the trade is −1.00R. A short option that expires worthless keeps the whole credit, less fees.
Why does the same options trade show a different R?
Because R divides the result by the risk you planned. The SPY example made $377.40. Against its stop at half the premium, $320 of risk, that is +1.18R; against the whole $640 debit it would be +0.59R. Type a stop premium only if you would have closed there.
Is there an options trading journal for Google Sheets?
Yes. Upload the .xlsx with File → Import → Upload to keep its formulas, Summary, Settings sheet and dropdowns. The CSV carries the 23 columns and the example rows with their worked-out values but no formulas, so rows you add won't calculate.
How do I export options trades from my broker?
Interactive Brokers builds a Flex Query, with CSV among its formats, under Performance & Reports. Webull's desktop app exports your orders from the Orders widget as a .csv sent by email. thinkorswim's manual documents Order History and Trade History but no CSV export of them, so type those rows yourself.
Does the journal handle assignment and exercise?
No. The sheet is arithmetic on the premiums you type, and its Read me says to check your broker's statement for assignment and exercise.