Download the crypto trading journal as an Excel workbook (.xlsx) or a CSV with the values but no formulas. It's our free trading journal template set up for crypto: size in coins, fees for both sides of the trade, funding paid or received, and a column for spot or perp. It works as a crypto futures trading journal for perpetuals and as a log of spot trades. Risk, Result and R are formulas, in the quote currency (USDT for a USDT pair). The workbook has three sheets: Trades, Summary and Read me. No email, no account.
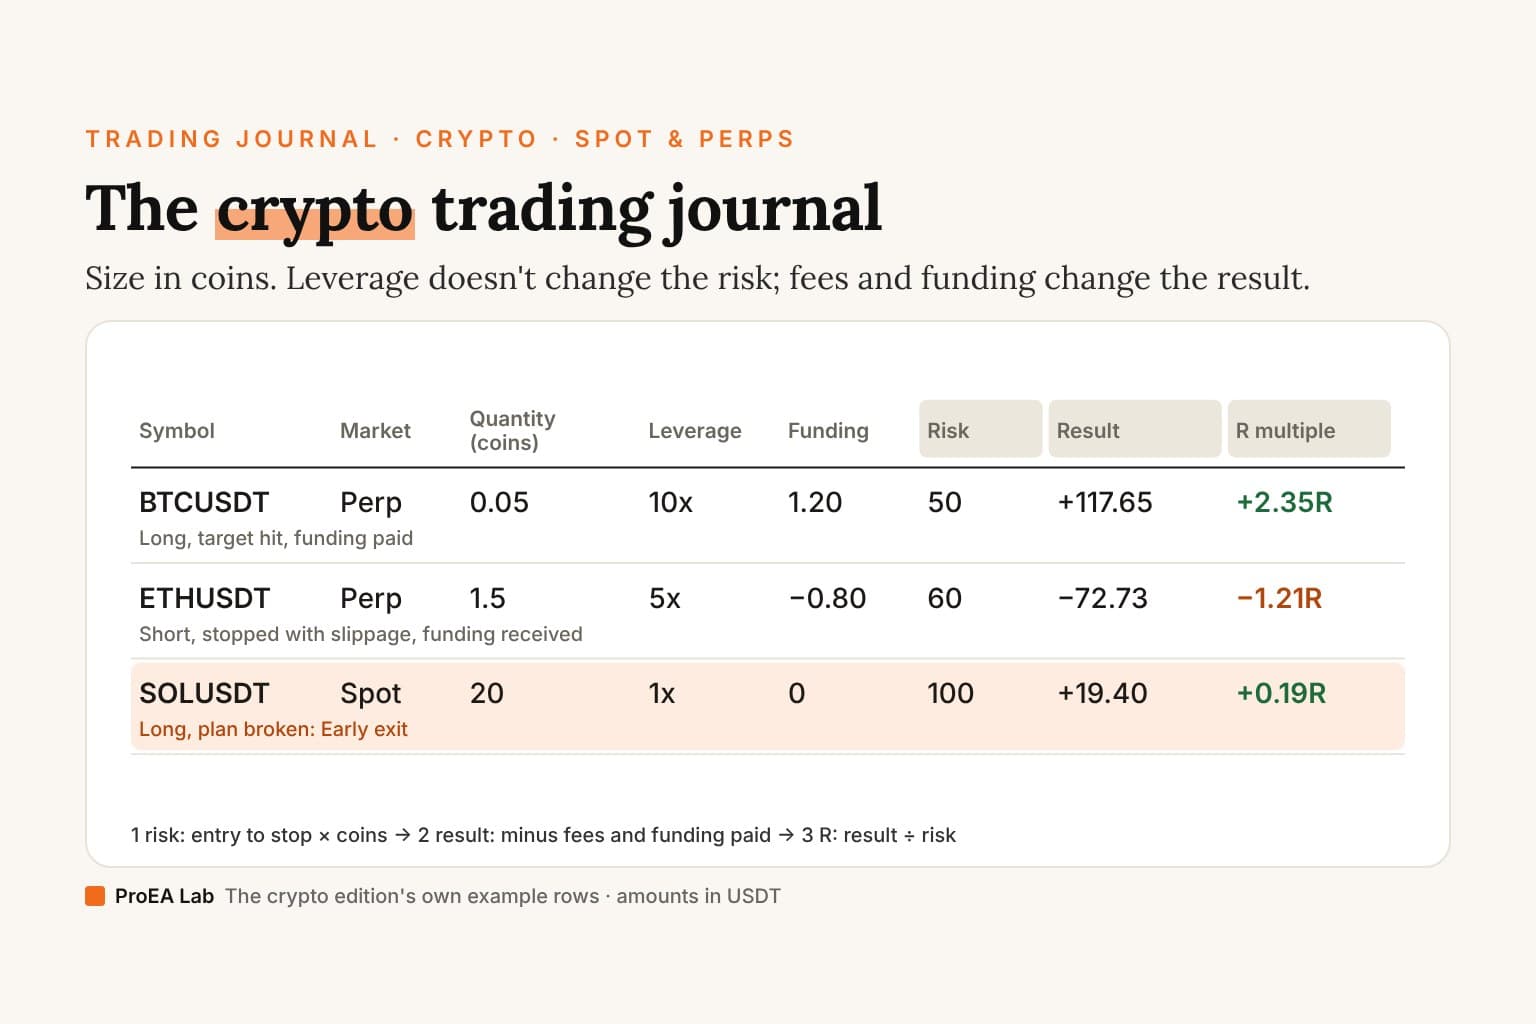
| The three example rows | Market | Risk | Result | R multiple | Followed plan? |
|---|---|---|---|---|---|
| BTCUSDT long, target hit, funding paid | Perp | 50 USDT | +117.65 USDT | +2.35R | Y |
| ETHUSDT short, stopped with slippage, funding received | Perp | 60 USDT | −72.73 USDT | −1.21R | Y |
| SOLUSDT long, sold early | Spot | 100 USDT | +19.40 USDT | +0.19R | N |
Every figure in that table is a formula in the workbook, recalculated in LibreOffice before we published it. Delete the three rows marked EXAMPLE and log one row per closed trade.
Leverage doesn't change what you lose at the stop. The distance to the stop times the coins you hold does. Size from that, and write it down before you enter.What should a crypto trading journal include?
The free template's eighteen columns, with size counted in coins, plus three: funding, the market and the leverage. You type the rest; Risk (quote currency), Result (quote currency), R multiple and Win/Loss are formulas.
| Column | What goes in it | Typed or formula |
|---|---|---|
| Date | The day the trade closed | Typed |
| Symbol | The pair: BTCUSDT, ETHUSDT | Typed |
| Direction (Long/Short) | Pick from the list | Typed |
| Setup / reason | One name from your setup menu, written before entry | Typed |
| Entry | Your average fill | Typed |
| Stop | The initial stop you sized from | Typed |
| Target | The planned exit | Typed |
| Exit | Your average exit fill | Typed |
| Quantity (coins) | How many coins: 0.05 BTC, 1.5 ETH, 20 SOL | Typed |
| Risk (quote currency) | Distance from entry to stop × quantity | Formula |
| Result (quote currency) | Price move × quantity, minus fees, minus funding paid | Formula |
| R multiple | Result ÷ Risk | Formula |
| Win/Loss | Win, Loss or Breakeven | Formula |
| Fees | Both sides of the trade, as the exchange's trade history shows them | Typed |
| Followed plan? (Y/N) | Pick from the list | Typed |
| Mistake tag | Moved stop, Early exit, Oversized and four more | Typed |
| Notes | One line | Typed |
| Screenshot link | A link to the chart | Typed |
| Funding (paid +, received -) | The sum of the funding payments while the position was open | Typed |
| Market (Spot/Perp) | Pick from the list | Typed |
| Leverage (info only) | What you set; the formulas don't use it | Typed |
Quantity is in coins, not dollars and not contracts, because that's what the price multiplies. If your exchange shows a perp's size in USDT, divide it by the entry price for the coins.
How do I calculate risk on a leveraged crypto trade?
Risk = |Entry − Stop| × Quantity. That's the whole formula, and leverage isn't in it. The workbook's Read me says it plainly: "Leverage doesn't change it: 10x on the same quantity and stop risks the same dollars, it only ties up less margin."
Take the BTCUSDT example: 0.05 BTC bought at 60,000 with a stop at 59,000. At the stop, the position loses 1,000 × 0.05 = 50 USDT, before fees. What leverage changes is how much of your balance the exchange holds as margin, the position's value (0.05 × 60,000 = 3,000 USDT) divided by the leverage:
| Leverage (info only) | Margin tied up | Risk at the stop |
|---|---|---|
| 1x | 3,000 USDT | 50 USDT |
| 5x | 600 USDT | 50 USDT |
| 10x | 300 USDT | 50 USDT |
Higher leverage frees margin; it doesn't shrink the loss at your stop. What it does move is the liquidation price, closer to your entry. If the liquidation price sits between your entry and your stop, the exchange closes you before the stop does, and the plan in your journal never got its test. The crypto position size calculator works out the quantity for a USDT risk and shows the liquidation price beside your stop; the liquidation price calculator estimates it before and after you add to a position.
So the journal records leverage for information only. Two trades with the same Risk are the same size to the journal, whatever leverage carried them; the column is there so you can compare, on Sunday, the R of your high-leverage trades with the rest.
How do I log fees and funding?
Fees: both sides, one number. The fee for opening and the fee for closing, added up, as the trade history shows them. The perp fee calculator works out maker and taker fees and the break-even exit for a planned trade.
Funding: what you paid, positive; what you received, negative. Result = (Exit − Entry) × Quantity, sign flipped for a short, minus Fees, minus Funding. Spot trades have no funding: type 0.
Binance defines funding in its help centre (read 29 October 2026, page updated 6 March 2026):
- "Funding rates are periodic payments transferred between holders of long and short positions in Perpetual Contracts."
- "Funding Amount = Nominal Value of Positions * Funding Rate" "(Nominal Value of Positions = Mark Price * Size of a Contract)"
- "Please note: Binance does not charge fees on Funding Payments. Funding Payments are transferred directly between traders holding opposing positions."
- "The default funding interval is every 8 hours at 00:00 (UTC), 08:00 (UTC), and 16:00 (UTC)."
- "If you close your position prior to the funding time, you will not pay or receive any funding."
The interval isn't the same everywhere. Binance's fees page, read the same day, says "Typically settling every 8 hours, the frequency of funding fee settlements varies depending on the cryptocurrency pair held", and lists 4-hour pairs too. And the funding page adds that, "Effective from 2025-05-02 08:00 (UTC)", a USDⓈ-M perpetual switches to settling "every one hour when the previous funding rate settlement of USDⓈ-M perpetual contracts reaches the funding rate cap or floor." So add up the payments your history shows, rather than counting intervals. The funding rate calculator estimates them for 1-hour, 4-hour and 8-hour intervals before you hold a position.
Where to find what you paid: Binance's help page that described the futures Transaction History tab now shows "This article does not exist.", so we can't give you its current click path. What we could read: Binance's 2023 blog says "Your history of Funding Fees can be found in your transaction history.", and its API lists a "FUNDING_FEE" income type. Bybit, read the same day, folds funding into its own Closed P&L: "Closed P&L = Position P&L - Fee to open - Fee to close - Sum of all funding fees paid/received". That's the sheet's Result, built the same way, so Bybit's Closed P&L is your cross-check.
What does a filled crypto trading journal look like?
The edition's three example rows, worked by hand. All three are made up and marked EXAMPLE; prices are illustrative, not quotes. Every amount is in USDT.
| Symbol | Market | Direction | Entry | Stop | Target | Exit | Quantity (coins) | Leverage | Fees | Funding | Risk | Result | R multiple |
|---|---|---|---|---|---|---|---|---|---|---|---|---|---|
| BTCUSDT | Perp | Long | 60000 | 59000 | 62500 | 62500 | 0.05 | 10 | 6.15 | 1.20 | 50 | +117.65 | +2.35R |
| ETHUSDT | Perp | Short | 3000 | 3040 | 2920 | 3046 | 1.5 | 5 | 4.53 | −0.80 | 60 | −72.73 | −1.21R |
| SOLUSDT | Spot | Long | 150 | 145 | 160 | 151 | 20 | 1 | 0.60 | 0 | 100 | +19.40 | +0.19R |
BTCUSDT perp, long 0.05 BTC at 10x, target hit. Risk = |60000 − 59000| × 0.05 = 50 USDT. Result = (62500 − 60000) × 0.05 − 6.15 − 1.20 = 117.65 USDT: 125 on the move, 6.15 of fees for the entry and the exit, and 1.20 of funding paid ("paid two funding intervals", says the note). R = 117.65 ÷ 50 = +2.35R.
ETHUSDT perp, short 1.5 ETH at 5x, stopped out. Risk = |3000 − 3040| × 1.5 = 60 USDT. The stop was 3040; the fill came at 3046, $6 an ETH of slippage, 9 USDT on 1.5 ETH. Result = (3046 − 3000) × −1 × 1.5 − 4.53 − (−0.80) = −72.73 USDT: −60 planned, −9 of slippage, −4.53 of fees and +0.80 of funding received while short. R = −1.21R. The plan was followed; the fill and the fees took it past −1R, and the funding gave a little back.
SOLUSDT spot, long 20 SOL, sold early. Risk = |150 − 145| × 20 = 100 USDT. Result = (151 − 150) × 20 − 0.60 − 0 = 19.40 USDT, or +0.19R. Followed plan: N. Mistake tag: Early exit. The note: "Sold at +$1 on a red candle; the plan was the 160 target." With the edition's own formula, the 160 target would have paid (160 − 150) × 20 − 0.60 = 199.40 USDT, or +1.99R, if price had gone on to reach it. The row can't say whether it would have. What it does is count the Early exit tag, so the weekly review shows how often you leave before your plan does.
The Summary sheet on these three rows reads 3 trades, a 66.7% win rate, expectancy +0.44R per trade, total R +1.33R, total result 64.32 USDT, a profit factor of 1.88, a largest loss of −1.21R, 11.28 USDT of fees and 0.40 USDT of total funding paid (1.20 paid, 0.80 received). Plan followed averages +0.57R; plan broken, +0.19R. Three rows prove nothing, but they show the arithmetic. For whole entries with the reason and the lesson written in, see six trading journal examples.
Spot vs perp in the journal
The same Risk formula, the same R; the perp row needs two more numbers.
| Spot | Perpetual (perp) | |
|---|---|---|
| What you hold | The coins | A position on the price, with margin |
| Going short | You can only sell coins you hold | Open a short, as in the ETHUSDT row |
| Leverage | None | Set by you; it moves the liquidation price |
| Funding | None | Paid or received at each funding time you hold through |
| Fees in the journal | Both sides | Both sides; funding goes in its own column |
| Market (Spot/Perp) | Spot | Perp |
| Funding (paid +, received -) | 0 | From the funding or transaction history |
| Leverage (info only) | 1 | As set |
| Risk | Entry to stop × coins | Entry to stop × coins |
If you trade CME's Micro Bitcoin futures (MBT) rather than an exchange perp, use the futures trading journal: its Specs sheet carries MBT's point value, and futures have no funding.
How do I export trade history from Binance?
Spot and USDⓈ-M futures export from different places, with different limits. Binance's help pages, read 29 October 2026:
Spot, on the website (page updated 27 January 2026):
- "Log in to your Binance account, click the [Profile] icon and go to [Orders] - [Spot Order]."
- "Click [Trade History] - [Export Trade History]."
- "Select [All Time] and click on the calendar bar to adjust the dates. You can download up to a full year's trading history from the selected date after 2017-07-13."
- "Click [Generate]." "Please note that you can only generate up to 5 statements per month."
- "Click [Download] to save it in a CSV file." "Please note that the statement download link will only be stored for 7 days."
Spot, in the app: "Up to 10,000 data points can be exported each time." and "The maximum range for each export is 6 months." Beyond 6 months, a statement covers up to a year, and "The history is shown in UTC+0".
USDⓈ-M futures (page updated 21 January 2026): "You can view and download your USDⓈ-M or COIN-M Futures order history by clicking [Orders] - [USDⓈ-M Futures Order] or [COIN-M Futures Order] located at the top-right corner of the Futures trading interface." Then: "Click the Export icon at the top-right corner of the Futures Order interface to download your order history." For everything: "Select [Beyond 3 months - Custom] if you want to generate a report that contains all your order history."
Binance's API documentation states the futures download limits, which the website shares. For the trade history download: "Request Limitation is 5 times per month, shared by front end download page and rest api". For the order history download, 10 times a month. For each, "The time between startTime and endTime can not be longer than 1 year". Neither help page lists the CSV's column headers, so map them when you open the file, whatever it calls them: the fill prices to Entry and Exit, the filled amount to Quantity (coins), the fees to Fees.
How do I export trade history from Bybit?
Bybit's Data Export page, on the website only. Its help article, read 29 October 2026 (last updated 30 September 2026), says "the account data export function is not available on the Bybit app" and is for verified accounts:
- "On the Bybit Homepage, hover your cursor over your Profile, then go to Account → Data Export." "Alternatively, go to Assets → Funding Account → History → Data Export."
- Choose the records. Order History includes "USDT Perpetual Order, Trade and Closed P&L History" and "Spot Order and Trade History", among others.
- "After confirming the selections, simply click on Export Now to generate your data."
- "Once the file is ready, the status will change to Exported, and the download button will be visible."
"Transaction Log and Order History will be available in the CSV format". The limits, in the page's words: "the export period is limited to one year (12 months), with a maximum of 50 exports per month for all the data types"; "The exporting process for Transaction Log and Order History will take about 1-3 days"; and "the download link will only be valid for seven (7) days". On how far back it goes, the page states both: "Up to three (3) years of recent data can be retrieved", and, in its Transaction Log table, "The available data can be retrieved for up to five (5) years, starting from January 1, 2022."
For a quicker export of one product: "go to Orders → Unified Trading Order", pick the product's history tab and click Export. That route allows "up to six (6) months of records within the last two (2) years", and "Each export is limited to 10,000 entries". The page doesn't list the CSV's column headers either.
How do I use the crypto journal in Google Sheets?
Upload the .xlsx, not the CSV. In Google Sheets, choose File → Import → Upload, pick crypto-trading-journal-v1.xlsx and create a new spreadsheet. That keeps the formulas, the Summary and the dropdowns on Direction, Followed plan?, Mistake tag and Market. Then check the Summary reads 3 trades and +0.44R before you delete the examples.
The CSV has the 21 columns and the 3 example rows with their worked-out values but no formulas, so rows you add won't calculate. If you start from it, paste these into J and K for each row you add, with the row number changed:
=IF(OR(E2="",F2="",I2=""),"",ABS(E2-F2)*I2)
=IF(OR(E2="",H2="",I2=""),"",(H2-E2)*IF($C2="Short",-1,1)*I2-N2-S2)
For R multiple and Win/Loss, paste these into L and M:
=IF(OR(J2="",K2=""),"",IFERROR(K2/ABS(J2),""))
=IF(K2="","",IF(K2>0,"Win",IF(K2<0,"Loss","Breakeven")))
In Excel, open the .xlsx. The workbook is prepared for 500 trades; copy the last formula row down for more.
What should I review every week?
The five numbers from the free template, off the Summary sheet: total trades, expectancy in R, plan followed against plan broken, the largest loss in R, and profit factor. The printable version of the review is page 5 of the printable trading journal. Then three crypto questions:
- What did funding cost? The Summary's Total funding paid (0.40 USDT on the examples) is already inside Result. If it grows week on week, you're paying to hold. Divide it by your usual Risk to see it in R, the habit count R, not money argues for.
- Spot or perp, which pays? The Summary doesn't split them.
=AVERAGEIF(Trades!T:T,"Perp",Trades!L:L)gives the perp trades' average R (+0.57R on the examples), and the same with "Spot" gives +0.19R. Count the rows each rests on with=COUNTIF(Trades!T:T,"Perp"). - Which tag costs the most R?
=SUMIF(Trades!P:P,"Early exit",Trades!L:L)totals one mistake tag's R. The costliest tag becomes next week's one rule.
The trading expectancy calculator checks the Summary's expectancy from your win rate and average R. The numbers describe what you did; a few dozen trades are still a small sample.
The deep version, as a PDF
The Trading Journal Playbook
What to write on every trade and why, filled-in entries across markets, the pre-trade checklist, the weekly and monthly review with the arithmetic shown, and the same columns on paper, in a spreadsheet or an app.
- What to write on every trade, and why each of the template's eighteen columns exists, in the order you fill them
- 13 filled-in entries across forex, gold, an index CFD, a partial close, a prop-firm evaluation day, a skipped trade and a backtest, every Risk, Result and R worked from the prices
- The pre-trade checklist, and how a month of mistake tags turns into checks of your own
Opens soon · USD 19, one payment. See what's inside →
What is the best trading journal for crypto?
The one you'll keep filling in, with the fees and the funding inside the result. The sheet does that for free; an app earns its fee when typing the trades in is what stops you. What the subscription journals' own pages said about crypto, as our competitor files record them:
| Journal | What its pages said about crypto, read 29 October 2026 |
|---|---|
| TradesViz | "Assets Supported": Basic "Stock"; Pro and Platinum include "Crypto currency" |
| Edgewonk | "Journal for all markets: Forex, Stocks, Futures, Crypto, Indices, Commodities, Options" |
| TradeZella | Its Zella AI page: "Covers stocks, options, futures, forex, and crypto." |
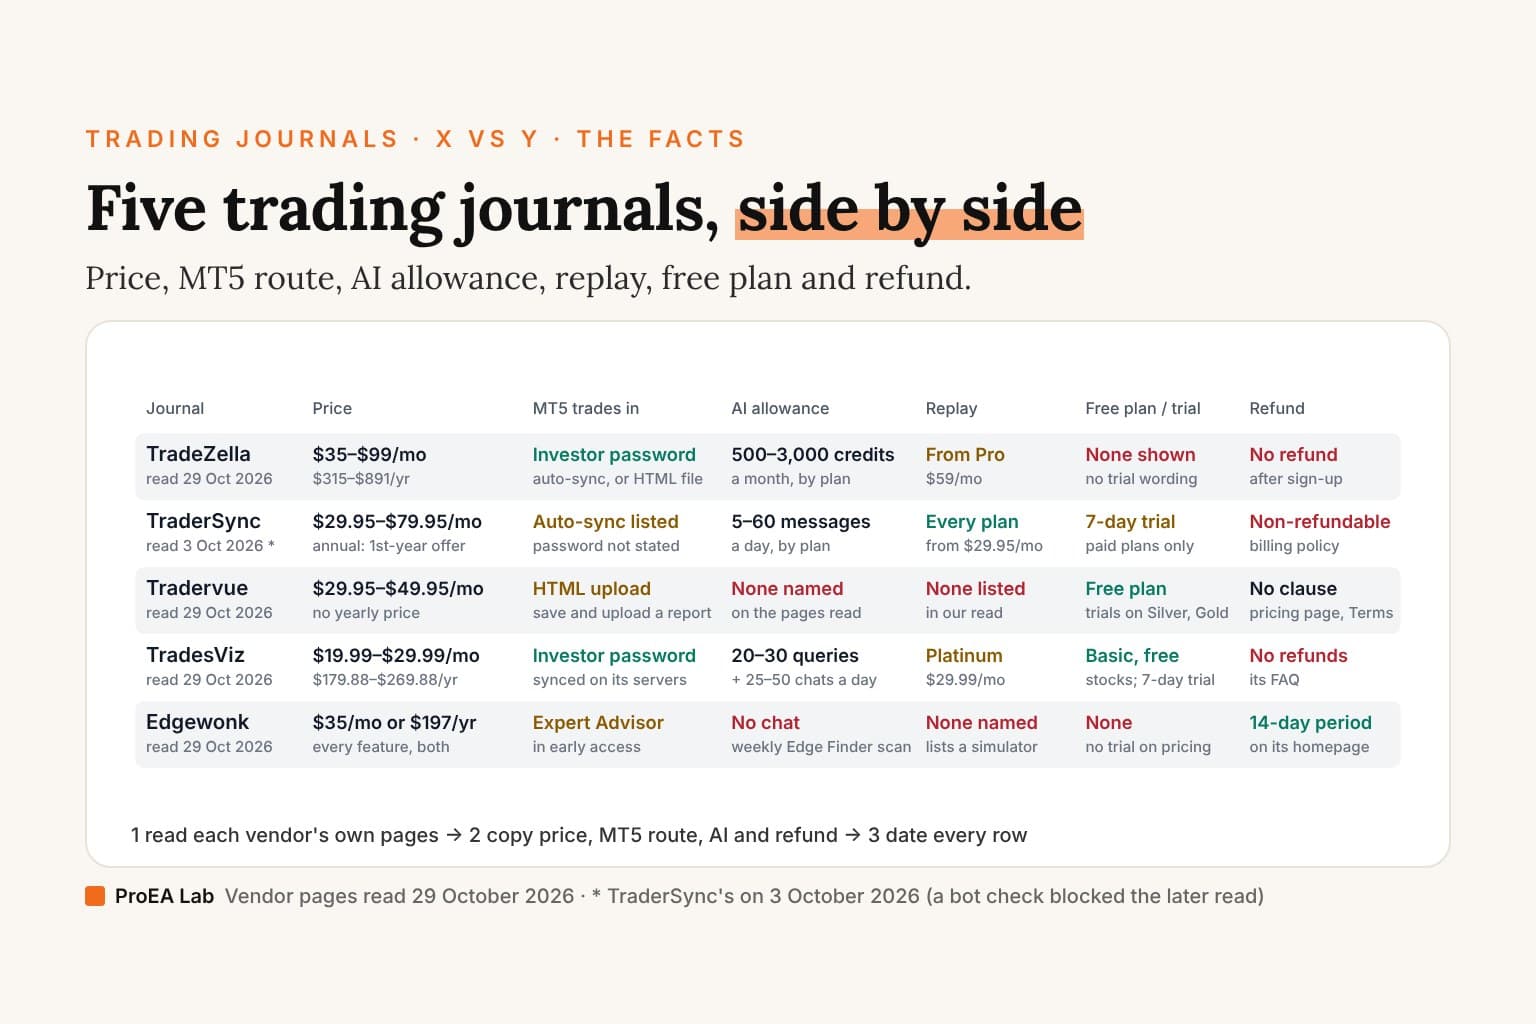
None of the files we keep names a Binance or Bybit import, and we didn't test one, so check the journal's own broker list for your exchange before you pay. Side-by-side comparisons, with prices, are in our trading journal comparison.
Ours, TradeLens, is built around MetaTrader. It imports MT4 HTML statements and MT5 history, and takes a broker CSV through its column-mapping wizard, with starter templates for MT4, MT5, cTrader, TradingView and a generic file. There is no Binance or Bybit template, and we haven't documented either export going through the wizard, so for crypto, start with this sheet. TradeLens runs on your own computer (Python, a browser UI and one SQLite file), and its AI coach, on a free local model or your own Claude, OpenAI or Gemini key, explains figures computed in code. It's $47 at launch, $79 regular; TradeLens Cloud is $29 a month.
If you trade crypto in a funded or evaluation account, keep the account's daily and drawdown limits in the prop firm tracker spreadsheet, beside this journal.
What the crypto journal doesn't do
- It doesn't read your exchange account. It's arithmetic on what you type or paste, as its Read me says; nothing syncs.
- It doesn't work out fees or funding. You type what the exchange charged; the calculators above estimate them before the trade.
- It's built for spot pairs and USDT-quoted perps. Results are in the quote currency. Coin-margined (COIN-M or inverse) contracts settle in the coin, so type Risk and Result over the formulas for those.
- It doesn't split the Summary by market. Use the AVERAGEIF and SUMIF lines above.
- It doesn't tell you whether you have an edge. It describes the rows you enter. Not financial advice.
Frequently asked questions
Is there a free crypto trading journal template?
Yes. Ours is an Excel workbook, plus a CSV with the values but no formulas: 21 columns for spot and perpetual trades, with quantity in coins, fees, funding, and Risk, Result and R as formulas. No email, no account.
How do I calculate risk on a leveraged crypto trade?
Multiply the distance from entry to stop by the quantity in coins. A long of 0.05 BTC from 60,000 with a stop at 59,000 risks 1,000 × 0.05 = 50 USDT at 1x, 5x or 10x. Leverage only changes the margin the position ties up: 300 USDT at 10x.
Should I include funding fees in a crypto trading journal?
Yes, inside the Result. Type the funding you paid while the position was open as a positive number in the Funding column, and funding you received as a negative one. On Binance the default funding interval is every 8 hours, at 00:00, 08:00 and 16:00 UTC, and some pairs settle more often.
How do I export my trade history from Binance?
For spot, go to Orders, then Spot Order, then Trade History and Export Trade History, pick the dates, Generate, then Download the CSV. Binance's help page says one statement covers up to a full year, you can generate up to 5 statements a month, and the link is kept for 7 days.
How do I export trade history from Bybit?
On the Bybit website, hover over your Profile and go to Account, then Data Export. Order History arrives as a CSV, which Bybit says takes about 1 to 3 days. Each export covers up to a year, and Bybit's page states both that three years and that five years of data can be retrieved.
How do I journal crypto trades?
One row per closed trade: the pair, direction, setup, entry, stop, target, exit and quantity in coins, then the fees for both sides and any funding. Risk, Result and R are formulas. Write the stop and the reason before entry, because no exchange export has them.
What is the best trading journal for crypto?
The one you keep filling in, with fees and funding inside the result. Of the subscription journals whose pages we read on 29 October 2026, TradesViz's paid plans, Edgewonk and TradeZella list crypto among their markets. None of the files we keep names a Binance or Bybit import, so check before you pay.
Can I use the crypto trading journal in Google Sheets?
Yes. Upload the .xlsx with File, Import, Upload to keep the formulas and the Summary. The CSV has the 21 columns and the 3 example rows with their worked-out values but no formulas, so rows you add won't calculate.