Download the free day trading journal as an Excel workbook (.xlsx) or a CSV for Google Sheets. It's our free trading journal template with the clock added: the same 18 columns and the same Summary, plus five columns from S to W, Time in, Time out, Minutes held, Trade # today and Session, for 23 in all. Minutes held and Trade # today are formulas. The Summary gains the average R of the day's first, second and later trades, the average R of each session, and the average minutes held. No email, no account.
Five example rows, marked EXAMPLE, show it working: three trades on Monday 5 October, one on the 6th and one on the 7th. They're made up, with illustrative prices. Delete them before you log your own.
Write down when each trade happened, and the sheet can count what the day's later trades, and each session, cost you in R.What does a day trading journal look like?
One row per closed trade, in time order within each day. These are the workbook's five example rows, cut down to the columns the clock adds and the ones you'd read beside them:
| Date | Symbol | Setup / reason | Time in | Time out | Minutes held | Trade # today | Session | R multiple | Followed plan? (Y/N) | Mistake tag |
|---|---|---|---|---|---|---|---|---|---|---|
| 2026-10-05 | EURUSD | Pullback - London open | 08:12 | 10:47 | 155 | 1 | London | +1.96R | Y | |
| 2026-10-05 | EURUSD | Range fade - London high | 11:05 | 11:31 | 26 | 2 | London | −1.035R | Y | |
| 2026-10-05 | EURUSD | No setup | 11:34 | 11:52 | 18 | 3 | London | −1.06R | N | Revenge trade |
| 2026-10-06 | XAUUSD | Opening range - New York | 14:31 | 15:20 | 49 | 1 | New York | +3.37R | Y | |
| 2026-10-07 | GBPUSD | Breakout retest | 02:10 | 03:05 | 55 | 1 | Asia | −1.03R | Y |
Each row also carries the template's Direction (Long/Short), Entry, Stop, Target, Exit, Size (lots), Risk (account currency), Result (account currency), Win/Loss, Fees, Notes and Screenshot link. Every example risks $100, so each R is its Result divided by 100.
What columns does a day trading journal need?
The template's 18 columns record the trade; the five new ones record the clock. Why each of the 18 is there is in the free template post. The new ones:
| Column | You type | Or the sheet works it out |
|---|---|---|
| Time in | The entry time, as hh:mm | |
| Time out | The exit time, as hh:mm | |
| Minutes held | =IF(OR(S2="",T2=""),"",ROUND((T2-S2)*1440,0)): time out minus time in, times 1440, the minutes in a day | |
| Trade # today | =IF($A2="","",COUNTIF($A$2:$A2,$A2)): how many rows so far, this one included, carry this row's date | |
| Session | Asia, London or New York, from a dropdown |
Three things follow from those formulas:
- Rows go in time order within each day. Trade # today counts the rows above with the same date, so a trade typed out of order gets the wrong number.
- A trade held past midnight comes out with negative minutes. Type its minutes over the formula on that row, as the workbook's Read me says.
- Session is yours to define. The sheet only checks that the word is on the list. Pick the hours once and keep them: our forex market hours clock shows the Sydney, Tokyo, London and New York sessions on your own clock. If you only trade US stocks, every row will say New York; Trade # today and Minutes held still do their work.
Size (lots) is the template's own header. For shares or contracts, type the count: Risk and Result are in money, so R works the same in any market. Risk is the loss at your initial stop, typed before you enter. The forex position size calculator, the XAUUSD lot size calculator and the stock position size calculator size a trade to the risk you pick.
A worked day: Monday 5 October
Three EURUSD trades, each risking $100.
| Trade # today | Time in → out | Setup / reason | Size (lots) | Entry, stop, exit | Result | R |
|---|---|---|---|---|---|---|
| 1 | 08:12 → 10:47 | Pullback - London open | 0.50 | 1.1700, 1.1680, 1.1740 | +$196 | +1.96R |
| 2 | 11:05 → 11:31 | Range fade - London high | 0.50 | 1.1745, 1.1765, 1.1765 | −$103.50 | −1.035R |
| 3 | 11:34 → 11:52 | No setup | 1.00 | 1.1758, 1.1748, 1.1748 | −$106 | −1.06R |
Trade 1 is a long from the London open. A 20-pip stop on 0.50 lots is $100 of risk; the 1.1740 target paid 40 pips, $200, less $4 of fees: +$196, +1.96R. It was held 155 minutes.
Trade 2 fades the London high and is stopped out at 11:31: −$100 at the stop and $3.50 of fees, −1.035R. A planned loss; nothing in it to fix.
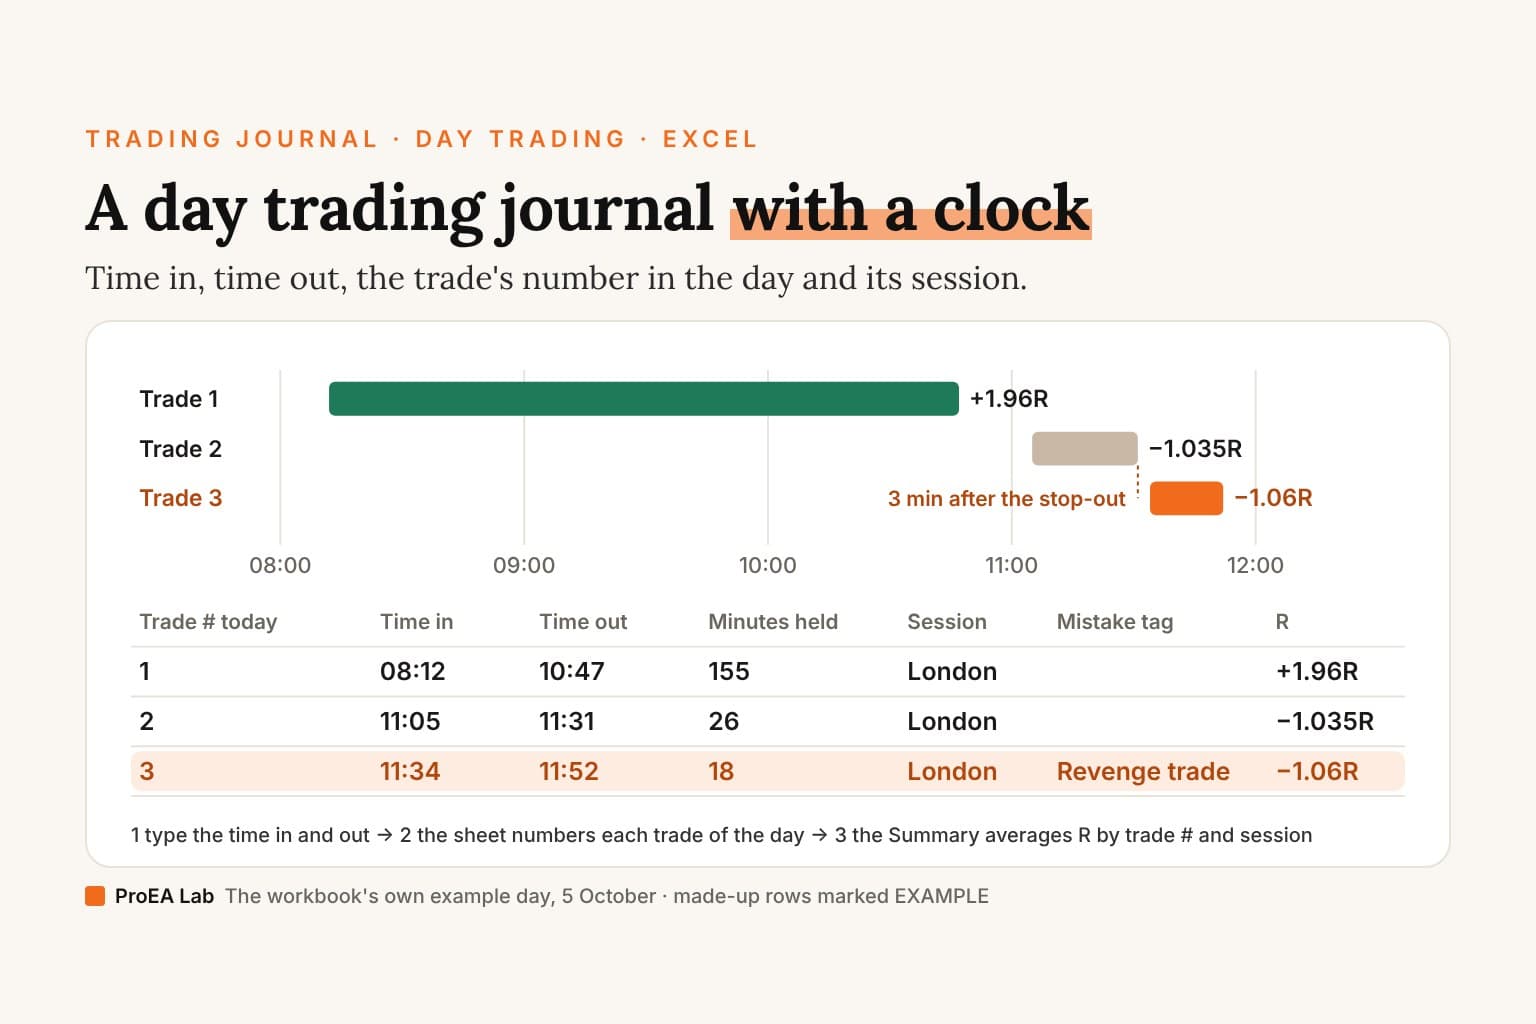
Trade 3 is the row the clock columns are for. It went in at 11:34, three minutes after trade 2's stop-out, with no setup, at twice the size: 1.00 lot on a 10-pip stop, still $100 of risk. It was stopped at 11:52, 18 minutes later: −$100 and $6 of fees, −1.06R. Followed plan? (Y/N): N. Mistake tag: Revenge trade.
The day stood at +1.96R at 10:47 and finished at −0.135R: +1.96R, then −1.035R, then −1.06R. In money, +$196 became −$13.50.
The sheet doesn't compute the gap between two trades; you read it off two cells, trade 2's Time out (11:31) and trade 3's Time in (11:34). What it does count is the trade number. A revenge trade follows a loss, so unless the loss was yesterday's, it lands on Trade # today 2 or later, and that is where the Summary below collects its cost.
What does the Summary show?
The template's own Summary, then a block for this edition. On the five example rows:
| Summary line | Value | Rows behind it |
|---|---|---|
| Average R, 1st trade of the day | +1.43R | 3: +1.96R, +3.37R, −1.03R |
| Average R, 2nd trade of the day | −1.035R | 1 |
| Average R, 3rd trade or later | −1.06R | 1 |
| Average R, Asia | −1.03R | 1 |
| Average R, London | −0.045R | 3 |
| Average R, New York | +3.37R | 1 |
| Average minutes held | 60.6 | 5 |
The template's block reads 5 trades, a 40% win rate, an expectancy of +0.441R per trade, a total of +2.205R and a profit factor of 1.71. The four trades marked Y averaged +0.82R; the one marked N, the revenge trade, −1.06R.
What five rows prove: nothing. Read literally, this Summary says: take only the first trade of the day, trade only New York, skip Asia. Each of those rests on one to three trades. New York's +3.37R is a single target hit; the 2nd-trade average is a single stop-out. A handful of rows can't tell a habit from luck; all they show is that the formulas work. How many you need depends on how spread out your results are, which how many trades to test a strategy works through. The count only starts when you start logging, which is the case for logging the clock from today.
How do I journal day trading?
Write the risk before you click and the rest as each trade closes. A day can hold several trades, so the routine has to be short:
- Before the session: know your setups, your size rule and your limit for the day, in trades or in R. On a funded account, the daily loss limit calculator gives you the room in money.
- At entry: Date, Symbol, Direction (Long/Short), Setup / reason, Entry, Stop, Target, Size (lots), Risk (account currency), Time in and Session.
- At exit: Time out, Exit, Result (account currency) net of fees, Fees, Followed plan? (Y/N), and one Mistake tag if the answer is N.
- After the close: look at the day's last Trade # today against your limit, and write one line in Notes for each trade marked N.
Log as the trades close, not at night. By evening, the three minutes between a stop-out and a revenge entry can blur into "a bad afternoon", and the clock columns only work if the times are the real ones. For filled-in entries with notes, see six trading journal examples; the printable trading journal keeps the same columns on paper. For trades held overnight or for days, the swing trading journal adds the calendar instead of the clock, and the trading psychology journal puts how you felt before each trade beside its R.
What should I review each week?
Five lines of the Summary, in this order:
- Total trades. It says how much to believe the rest. One week of day trading is rarely enough rows for any average below it to mean much.
- Average R by trade number. If the 2nd and the 3rd-or-later averages sit below the 1st week after week, a cap on trades per day is a rule worth testing. One week can't show that.
- Average R by session. The same question for each session you trade.
- Expectancy when plan broken (R) and Total R when plan broken. What the rows marked N cost. Filter the Mistake tag column to Revenge trade to see that tag's share.
- Largest loss (R). Below −1R means a loss bigger than you planned: slippage, fees or a moved stop.
Then write one rule for next week in the Notes of your first row on Monday, and check it the Sunday after. The expectancy calculator recomputes the Summary's expectancy from a win rate and average R, if you want to check the sheet by hand.
How do I fill it from MT5 or TradingView?
From MT5: export your history (Toolbox → History, right-click the list, choose the period, then Report), then copy each closed position from the report's Positions table, as the free template post maps it column by column. The Positions table has two Time columns: the first is when the position opened, your Time in; the second is when it closed, your Time out. Both are written as YYYY.MM.DD HH:mm:ss, so you type only the hh:mm.
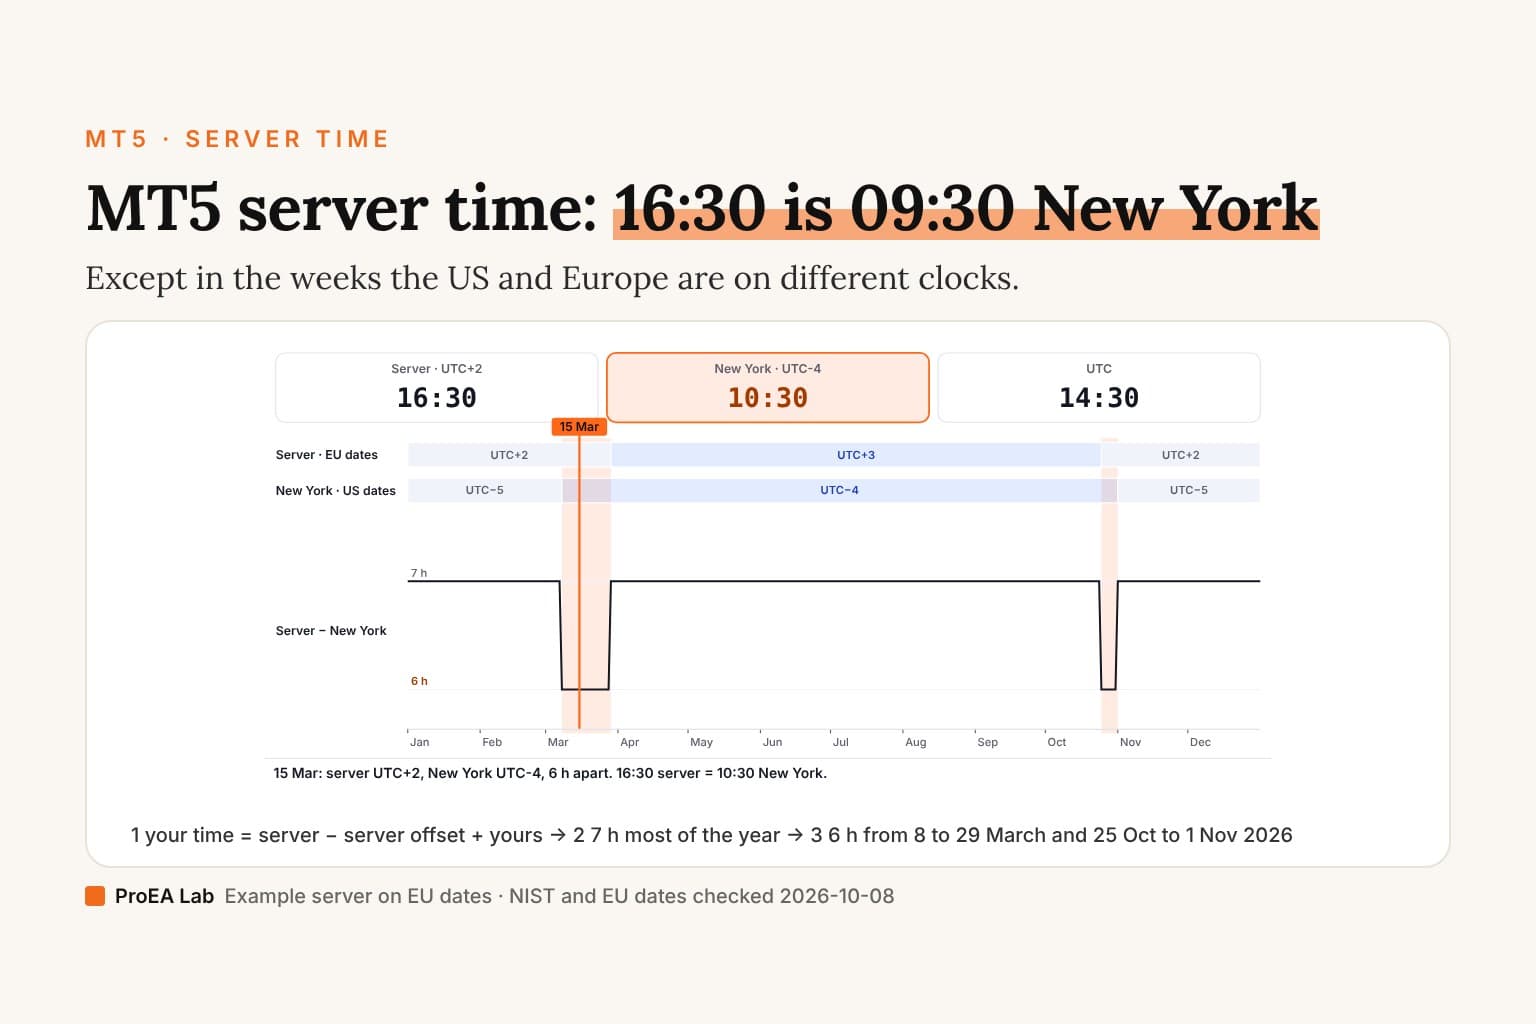
Both times are on your broker's server clock, not yours. Many MT5 servers run UTC+2 in winter and UTC+3 in summer; MT5 server time shows how to find your server's offset and convert. Convert before you choose the Session, or a London trade lands in Asia. Risk isn't in the report either: type the loss at your initial stop. The free MT5 report analyzer reads the report in your browser and flags rows it can't use before you copy them, and importing MT5 trades into a journal covers the import routes and the four checks that keep the data honest.
From TradingView: TradingView has no journal, but its Trading Panel keeps your Paper Trading or broker history, and Download data saves each tab as a CSV. In TradingView's help, as our TradingView trading journal guide quotes it (read on 29 October 2026), the history tab lists your orders with their "placement and closing times", and account history lists "your closed positions, with their entry and close prices, realized PnL". The CSV's exact column headers weren't on any page we read, so open your own export before you map it. To see your fills as arrows on the chart, turn on Executions in the chart settings' Trading tab.
Either way, an export gives you prices, times and profit. It can't give you the setup, the plan flag, the mistake tag or the risk you planned. Those are typed, ideally the same day.
Can I use it in Excel or Google Sheets?
In Excel, open the .xlsx. In Google Sheets, upload the .xlsx with File → Import → Upload to keep the formulas, the Summary and the dropdowns.
The CSV carries the 23 column headers and the five example rows with their worked-out values but no formulas, so rows you add won't calculate, and it has no Summary. If you start from it, paste the two clock formulas above into U2 and V2 and fill down, and the template's R multiple and Win/Loss formulas into L2 and M2:
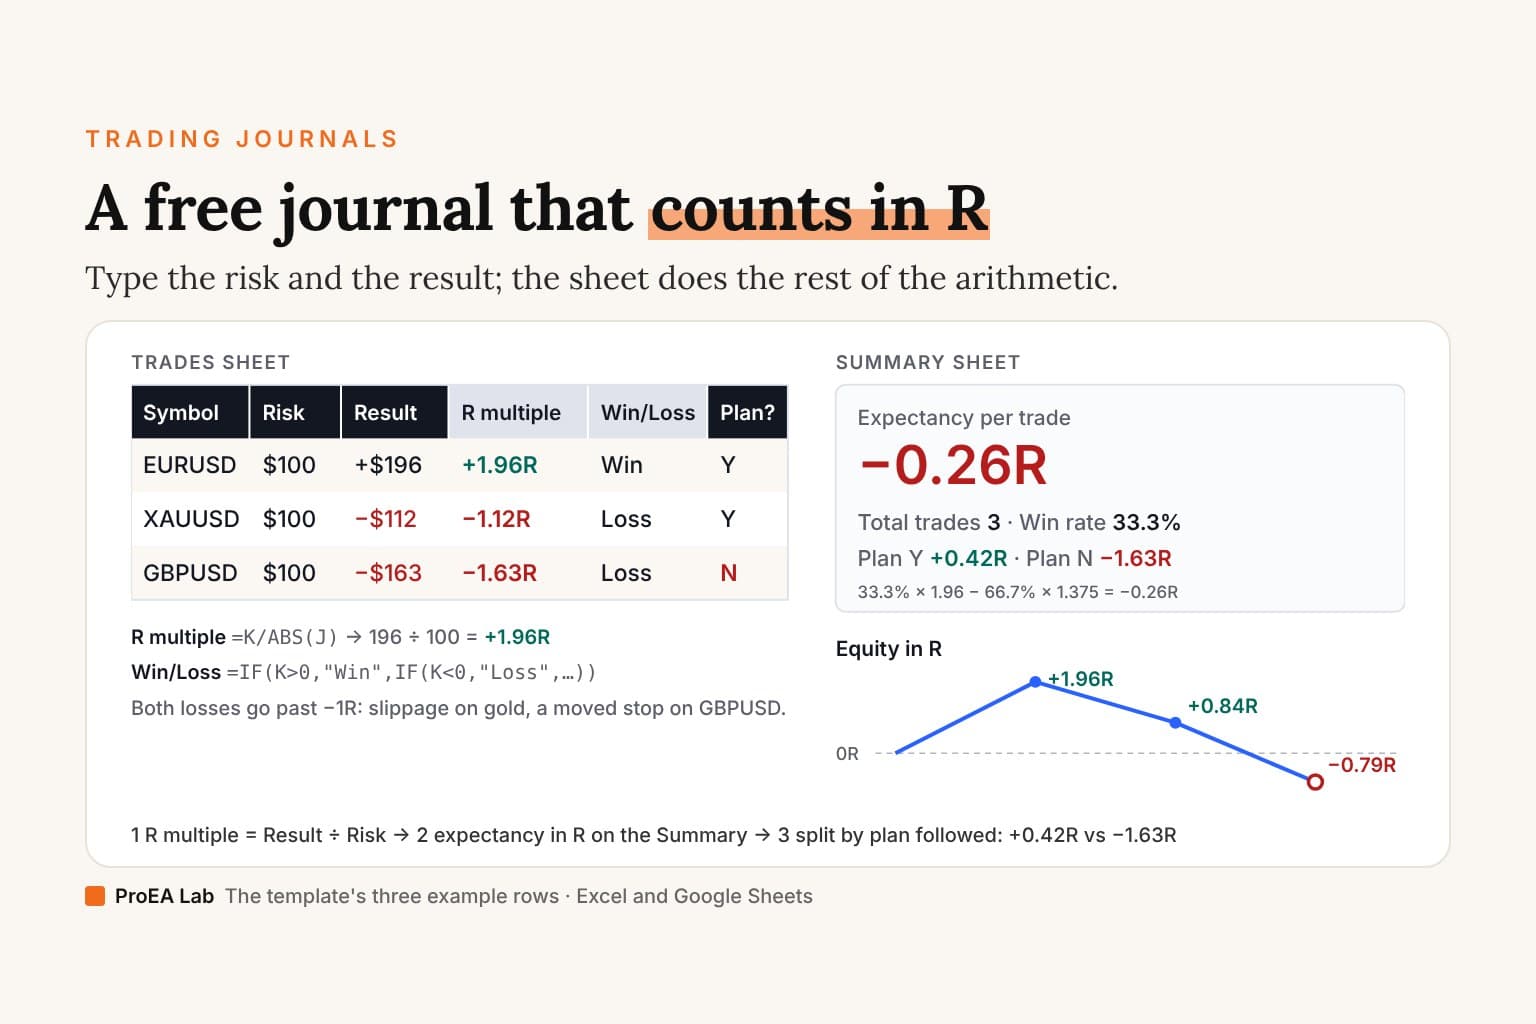
=IF(OR(J2="",K2=""),"",IFERROR(K2/ABS(J2),""))
=IF(K2="","",IF(K2>0,"Win",IF(K2<0,"Loss","Breakeven")))
We recalculated the workbook in LibreOffice and checked its computed cells against our own arithmetic. We didn't test every Sheets locale, so after uploading, check that the Summary reads 5 trades and 60.6 average minutes held before you delete the examples. If you searched for a day trading tracker in Excel, this is one: the Trades sheet is the log and the Summary is the tracker.
The deep version, as a PDF
The Trading Journal Playbook
What to write on every trade and why, filled-in entries across markets, the pre-trade checklist, the weekly and monthly review with the arithmetic shown, and the same columns on paper, in a spreadsheet or an app.
- What to write on every trade, and why each of the template's eighteen columns exists, in the order you fill them
- 13 filled-in entries across forex, gold, an index CFD, a partial close, a prop-firm evaluation day, a skipped trade and a backtest, every Risk, Result and R worked from the prices
- The pre-trade checklist, and how a month of mistake tags turns into checks of your own
Opens soon · USD 19, one payment. See what's inside →
Is there a day trading journal app?
Yes, several journals have phone apps; ours doesn't. What their own sites said when we read them:
| Journal | Phone app | Read on |
|---|---|---|
| TradesViz | Its homepage lists "Mobile App V3 for iOS & Android", and its footer links iOS and Android downloads | 29 October 2026 |
| TraderSync | Its site footer links its App Store and Google Play listings | 9 July 2026; on 29 October its pages answered with a bot check |
| TradeLens (ours) | None. The $47 download runs on your computer: Python, a browser page and one SQLite file; TradeLens Cloud, $29 a month, is reached in a browser from any device | Our own product |
| This workbook | It's a file. Whether you can type into it on a phone depends on your spreadsheet app; we didn't test one | Our own file |
A phone app matters if you log trades away from your desk. At a desk, the cost of a journal is the typing: an app that imports your trades saves it, and a spreadsheet makes you look at every row as you type it. Either works. The columns matter more than the software.
Where TradeLens fits
We sell TradeLens, a journal that runs on your own computer. It imports MT4 HTML statements, MT5 history and broker CSVs, the CSVs through a column-mapping wizard with starter templates for MT4, MT5, cTrader, TradingView and a generic file. Our comparison with TraderSync describes it grouping every closed MT4/MT5 deal by session (Asia, London, New York), weekday, hour and holding time, and by default flagging a trade that opens within 15 minutes of a losing close and is either at least 1.5 times the median size of your previous 20 trades or a flip of direction on the same symbol. Trade 3 above, three minutes after a loss at twice the size, is that pattern. The figures are computed in code; the AI coach, on a free local model or your own Claude, OpenAI or Gemini key, explains them. It's $47 at launch ($79 regular), and TradeLens Cloud, the hosted edition, is $29 a month. It has no phone app.
The workbook is free and stays free. If the Summary above is all the analysis you want, that's a good outcome, not a lost sale. Nothing here is financial advice, and neither the sheet nor TradeLens says what to trade.
Frequently asked questions
What does a day trading journal look like?
One row per trade, in time order within each day: the usual trade columns (date, symbol, setup, entry, stop, exit, size, risk, result, R, a plan flag and a mistake tag) plus Time in, Time out, Minutes held, Trade # today and Session. In our example day, trade 3 went in at 11:34, three minutes after a stop-out, with no setup, and lost 1.06R.
Is there a free day trading journal template for Excel?
Yes. Ours is a free .xlsx with 23 columns: the 18 of our general template plus five for the clock. Minutes held, Trade # today, R and Win/Loss are formulas, and the Summary averages R by trade number and by session. No email, no account, and a CSV version for Google Sheets.
How do I journal day trading?
Type the setup, the planned risk and the time in when you enter, and the exit, the net result, the time out, the plan flag and one mistake tag when you close. Keep the rows in time order so the sheet can number each trade of the day. Once a week, read the average R of the day's first, second and later trades and of each session.
Can I use the day trading journal in Google Sheets?
Yes. Upload the .xlsx with File → Import → Upload to keep its formulas, Summary and dropdowns. The CSV holds the example rows with their worked-out values but no formulas, so rows you add won't calculate until you paste in the Minutes held, Trade # today, R multiple and Win/Loss formulas yourself.
Can I fill a day trading journal from MT5?
Yes. Export the history report from Toolbox → History, then copy each closed position: the Positions table's first Time column is your Time in and its second is your Time out. Both are on your broker's server clock, so convert them before you choose the session. Risk isn't in the report: type the loss at your initial stop.
Is there a day trading journal app?
Some journals have phone apps. When we read their sites, TradesViz's homepage listed "Mobile App V3 for iOS & Android" (29 October 2026) and TraderSync's footer linked its App Store and Google Play listings (9 July 2026). TradeLens, the journal we sell, has no phone app. Our workbook is a file; we didn't test it on a phone.
What should I review weekly in a day trading journal?
Total trades first, since it says how much to believe the rest; then the average R by trade number and by session; then what the trades marked N cost, and the largest loss in R. With five rows, as in our example, most of those averages are a single trade: they show the sheet works, not what to change.