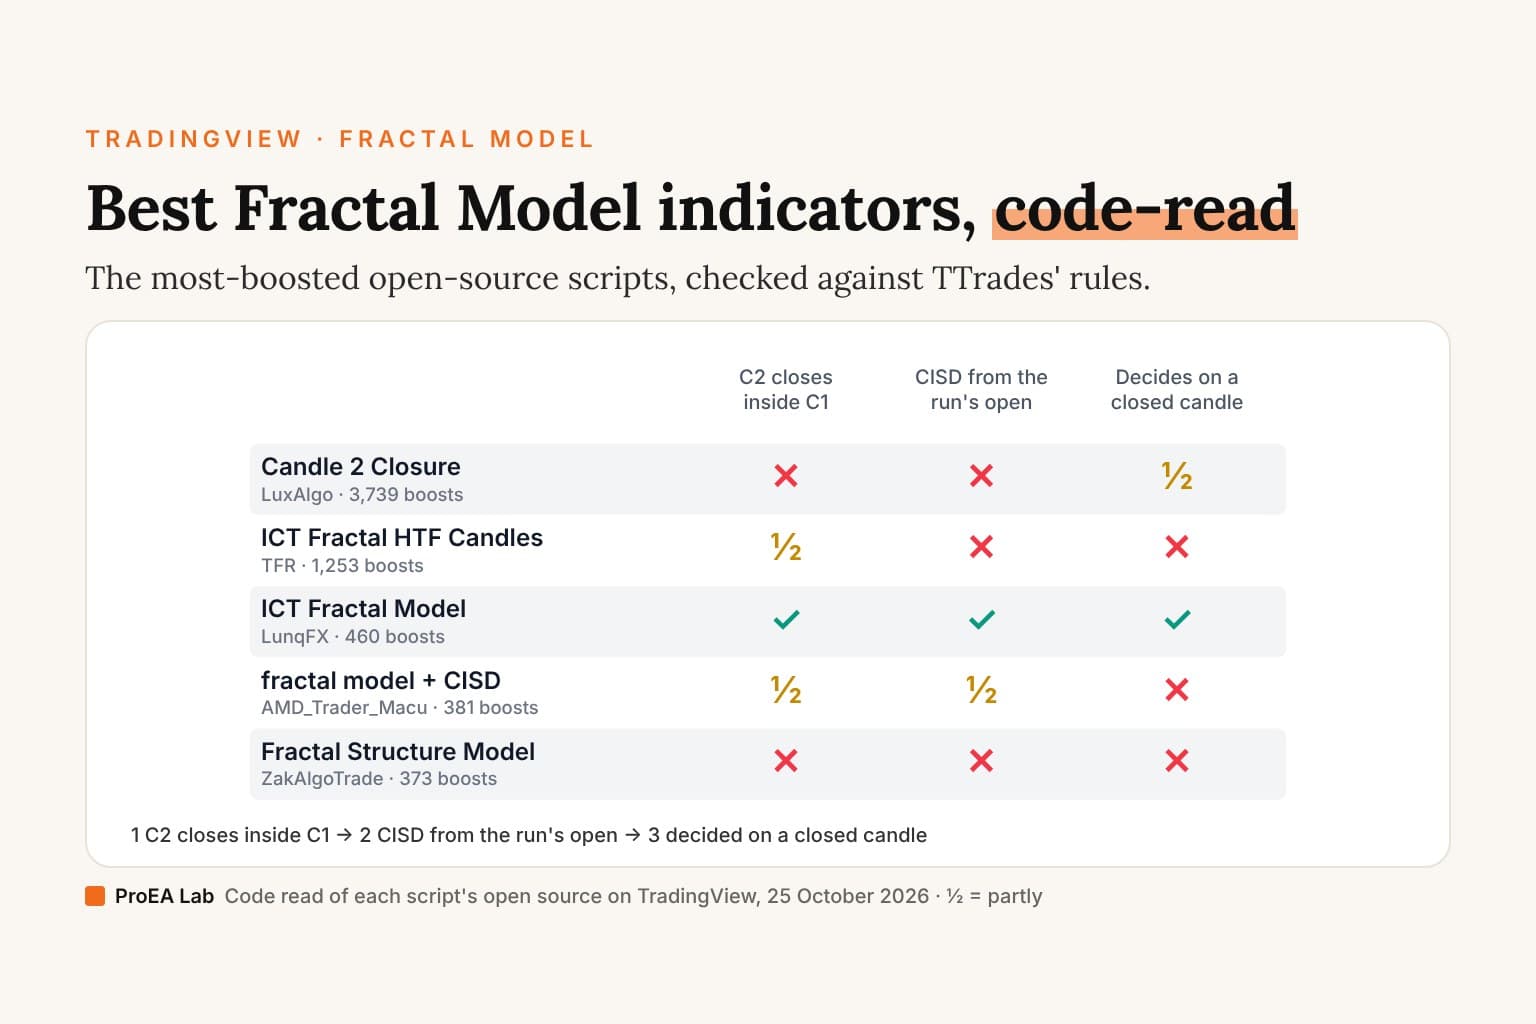
Short answer: for a free script that follows TTrades' rules, ICT Fractal Model, HTF Candles, CISD & C2 Targets by LunqFX is the closest in our read: it needs C2 to close inside C1, takes the CISD from the open of the run, and decides everything on a closed candle. The most boosted free one, Candle 2 Closure by LuxAlgo, marks C2 on a single timeframe, with no CISD. TTrades' own indicator is paid, from $45 a month, and its code is closed.
Most lists name Fractal Model indicators.
This one reads them.
What we checked
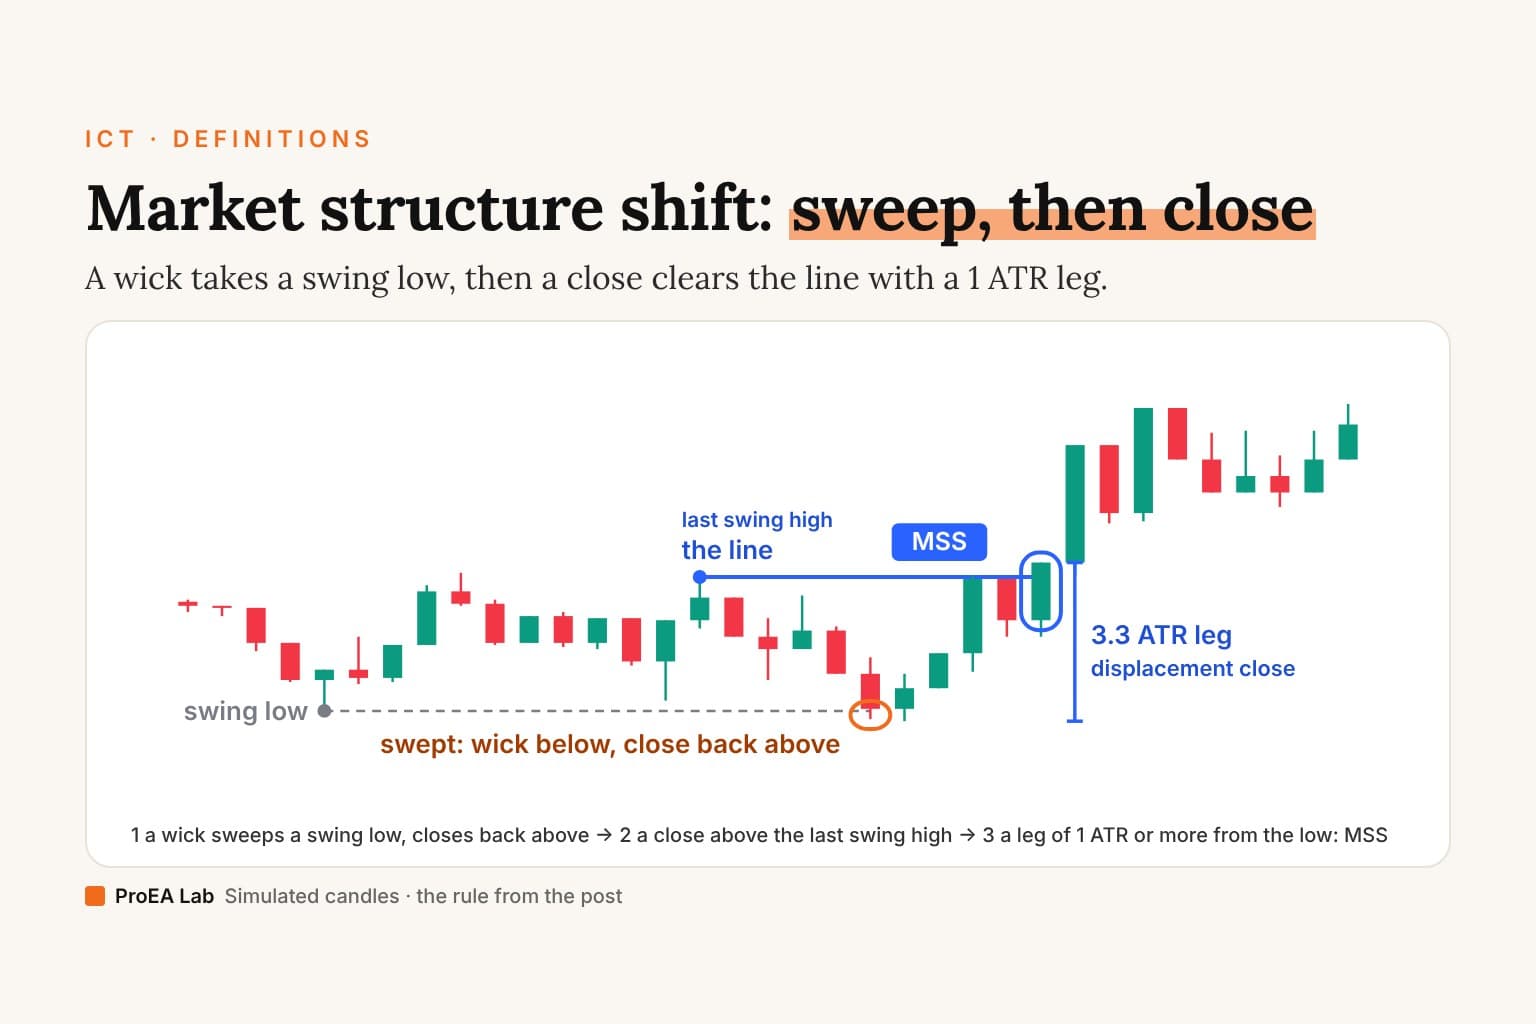
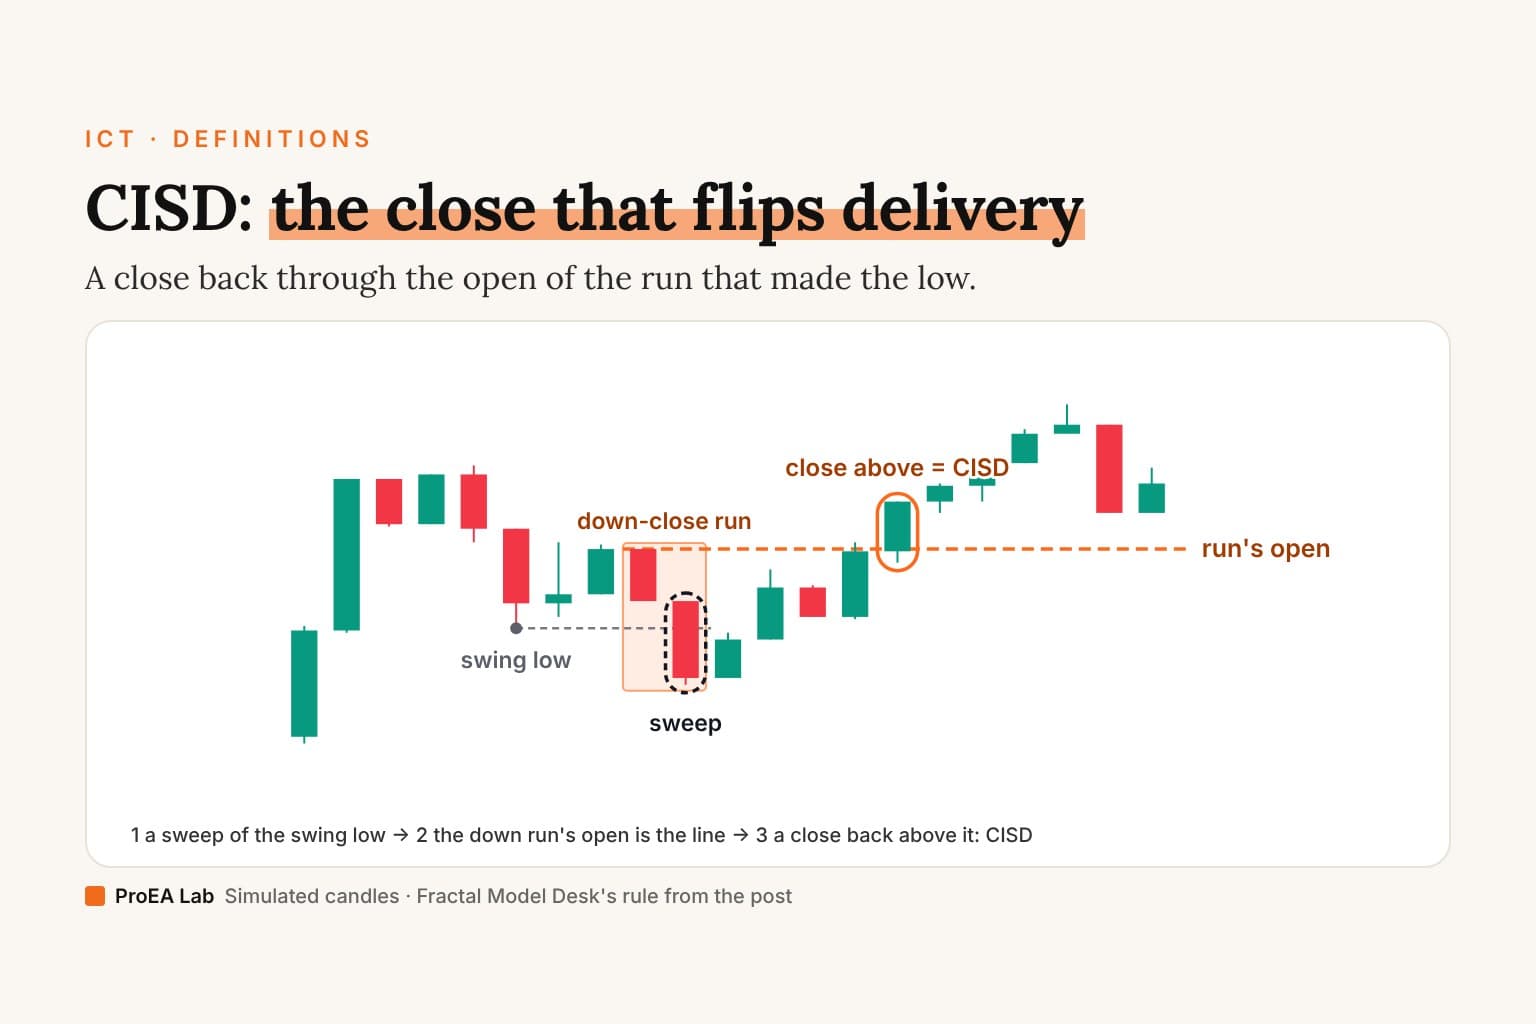
The model is short (explained in full here). C2 sweeps C1's high or low, the lower timeframe closes back through the open of the run that made the extreme (the CISD), and C2 closes back inside C1.
Simulated 15-minute candles, not market data, run through the study's rule. Setup 1 is the first setup whose trade reaches C1's far side, so every step shows; Another setup plays the rest in order, whatever they did. R is after a 0.40 round-trip cost.
Read as text
- C1, the four-hour candle, closes at 12:00 UTC: high 2394.41, low 2382.89.
- 12:15: a candle of C2 trades below C1's low. A long setup starts.
- 15:30: a 15-minute close above 2386.36, the open of the run of down candles that made the low (2377.80).
- C2 closes back inside C1's range: the swing is confirmed.
- 16:00: entry at 2390.96, stop 2377.80, target 2394.41 (C1's high).
- 19:30: the target fills at 2394.41: +0.23R after a 0.40 round-trip cost.
We searched TradingView's scripts for "fractal model" on 25 October 2026, took the most-boosted open-source ones that claim the model, and read every line that decides when a setup is drawn. Four questions:
- Higher-timeframe candles: where do they come from, and does the script read one that is still forming?
- C2: must it close back inside C1, or is any close back past the swept level enough?
- CISD: is it TTrades' line, the open of the first candle in the run into the extreme?
- When it decides: on a closed candle, or on the live one?
The table
Boosts as TradingView's search showed them on 25 October 2026.
| Script | Boosts | Higher-timeframe candles | C2 closes inside C1 | CISD | Decides on |
|---|---|---|---|---|---|
| Candle 2 Closure (LuxAlgo) | 3,739 | None: it runs on the chart's own candles | No: a close back past C1's low or high is enough | None | Labels on the live bar; alerts once per bar close |
| ICT Fractal HTF Candles (TFR) | 1,253 | The last four, beside price, read with lookahead on | Colours a C2 that swept and closed back | None | Draws the forming candle; no signals or alerts |
| ICT Fractal Model, HTF Candles, CISD & C2 Targets (LunqFX) | 460 | Built from the chart's closed bars | Yes, strictly; a sweep of both sides doesn't count | TTrades' line | Closed bars, alerts once per bar close |
| fractal model + CISD + HTF Sweep (AMD_Trader_Macu) | 381 | Read with lookahead on, the forming candle included | A close at or back inside the swept level | A similar line on chart swings, off by default | The forming higher-timeframe candle |
| Fractal Structure Model [Pro] (ZakAlgoTrade) | 373 | Built from the chart's bars | Not checked: a setup is the last candle's colour plus a CISD | A close beyond the previous candle's high or low | The live bar |
| Fractal Model – C2 (Fixed Arrows) (QMA) | 120 | None | No: "C2" is a close beyond the candle that swept the last three | None | Plots its arrow one candle back |
| HTF Candle Fractal Model (CBTrades) | 120 | A copy of DGT's open-source HTF candles and mini charts, credited in its header | No model logic | None | — |
| Fractal Model Desk (ours) | — | Completed candles only (one back, with lookahead on: TradingView's safe form) | Yes, strictly | TTrades' line, a doji ending the run | Closed bars, one JSON alert per close |
Three more have closed code, so we can't read them: Fractal Model Ja [beta] (527 boosts, protected), CandelaCharts' Fractal Range Model (283, invite-only) and Fractal Market Model [BLAZ] (155, invite-only).
What the code says
LuxAlgo's Candle 2 Closure is the popular one, and it isn't the full model. It works on one timeframe: put it on the 4-hour chart and each candle is checked against the one before. A bullish C2 needs a down-close C1, a lower low, and a close above C1's low, so a close above C1's high counts too. There is no CISD and no lower timeframe. Labels draw on the live bar and can vanish before it closes; its alerts wait for the close. It is shared under CC BY-NC-SA 4.0.
LunqFX's script is the closest to TTrades. Published 16 October 2026, it builds the higher-timeframe candles from the chart's own closed bars, with no request.security at all. C2 must close strictly inside C1, the CISD is the open of the run into the sweep, and its record counts only a CISD printed before C2 closed. Targets sit at C1's middle and its far side. A panel counts how often each target was touched on your symbol: no costs, no entry rule, so it's a touch count, not a result.
Two scripts read the forming higher-timeframe candle. TFR's candles use lookahead on with no offset, which TradingView's documentation warns leaks the final values into history; it only ever draws the latest four candles, so on a live chart you see the one still forming. fractal model + CISD + HTF Sweep uses the same reading for its "Sweep and Return" check, so on history its label can print at the start of a higher-timeframe candle, before the sweep happened. Live, it checks the forming candle, not the closed one.
"CISD" doesn't always mean TTrades' CISD. TTrades takes the opening price of the first candle in the run into the extreme. Fractal Structure Model [Pro] calls any close beyond the previous candle's high or low a CISD, near a swing low, and its setups don't check that C2 swept C1 at all. QMA's "C2" is a close beyond a candle that swept the last three, plotted one candle back, so on history the arrow sits a bar before the signal existed.
TTrades' own indicator
TTrades sells the Fractal Model indicator on its site from $45 a month, $120 a quarter or $438 a year, and it comes with TTrades' mentorship. On TradingView it is Fractal Model [Pro+] (TTrades) by toodegrees, with 5,790 boosts, inside a $120-a-month collection of 18 indicators. Its code is closed, so it isn't in the table. Its pages list automatic bias, automatic SMT, T-Spot, time filters and protected swings. Of the open scripts, only Fractal Structure Model [Pro] has a T-Spot level, a bias filter you set and time filters; none has automatic bias or SMT. Prices, access and features, side by side with ours: TTrades' indicator vs Fractal Model Desk.
Ours
Fractal Model Desk isn't on TradingView's search: its full Pine v6 source comes in Pine Pro Library, $49 once. It reads completed higher-timeframe candles, needs C2 to close strictly inside C1, takes the CISD from the run's open, and records a setup only on a closed bar. It ships with a Strategy Lab twin for the Strategy Tester. It leaves the bias and the point of interest to you.
We also tested the model it draws: 108 versions on 7 markets from January 2018 to September 2026. Before costs it was a coin flip, and nothing passed after costs. The Fractal Model study has every number.
Check one yourself
- Open source: search the code for
lookahead_on. One candle back ([1]) is safe; no offset reads the candle still forming. Then look forbarstate.isconfirmedbefore labels and alerts, and negativeoffsetvalues on plots. - Closed source: screenshot a C2 or CISD on a live bar, wait for the higher-timeframe close, then change any input and change it back. If the mark has moved or gone after that reload, the script used the live price.
- Any script: check the CISD on three setups by hand. Find the run of candles into the swept extreme, mark the open of its first candle, and see whether the script's line sits there.
None of the scripts here, ours included, runs on MetaTrader 5: Pine Script runs only on TradingView.
C2's rule on its own is candle range theory, which has many more scripts of its own: best CRT indicators, code-read. So does the CISD: best CISD indicators, code-read.
The deep version, as a PDF
The Fractal Model Field Guide
TTrades' Fractal Model, CRT and CISD as exact rules, with every result of our 108-version, 7-market test.
- The model in TTrades' own dated words, then as a seven-check rule you can apply candle by candle
- Every result of our 108-version test on 7 markets, 2018 to 2026, before and after costs
- What each choice did: timeframe pair, entry, target and filter, and how far each fell short after costs
One payment, instant download. Refund within 7 days if you haven't downloaded it.
Limits
One code read, on 25 October 2026, of the versions TradingView served that day. Scripts change, and boosts measure popularity, not quality. We build and sell Fractal Model Desk, our own automation of public TTrades material, not TTrades' indicator, and we have no relationship with TTrades. Nothing here is financial advice.
Use this animation on your site.
Frequently asked questions
What is the best Fractal Model indicator on TradingView?
Free: in our read, ICT Fractal Model, HTF Candles, CISD & C2 Targets by LunqFX follows TTrades' rules most closely. It builds the higher-timeframe candles from the chart's closed bars, needs C2 to close inside C1, takes the CISD from the open of the run and decides everything on the close. It is new, published 16 October 2026. Paid: TTrades' own indicator, from $45 a month, with closed source.
Is there a free TTrades Fractal Model indicator?
Not TTrades' own: TTrades sells it from $45 a month, and toodegrees includes it in a $120-a-month collection. Free open-source scripts on TradingView build the same model. LunqFX's is the closest to the rules in our read; LuxAlgo's Candle 2 Closure is the most boosted, with 3,739 boosts, but it marks C2 on one timeframe, with no CISD.
Does the Fractal Model indicator repaint?
It depends on the script. LunqFX's and our Fractal Model Desk decide on closed bars. fractal model + CISD + HTF Sweep reads the higher-timeframe candle that is still forming with lookahead on, so on history its sweep label can print at the start of a higher-timeframe candle, before the sweep happened. LuxAlgo's Candle 2 Closure draws its labels on the live bar but sends its alerts once per bar close.
Which Fractal Model indicators use TTrades' CISD?
TTrades takes the CISD from the opening price of the first candle in the run into the high or low. LunqFX's script and our desk use that line. fractal model + CISD + HTF Sweep tracks a similar line on chart swings, off by default. Fractal Structure Model [Pro] calls a close beyond the previous candle's high or low a CISD. LuxAlgo's Candle 2 Closure and TFR's candles have none.
Can I see the source code of TTrades' Fractal Model indicator?
No. TTrades grants access to your TradingView username and the script stays closed; on TradingView it is a Paid Space script, which TradingView describes as invite-only. Fractal Model Desk comes with its full Pine v6 source in Pine Pro Library, $49 once.
Is there a Fractal Model indicator for MT5?
We found none. Every script here is Pine Script, which runs only on TradingView; a MetaTrader 5 version would be a new program, to be checked the same way.
Does a Fractal Model indicator make money?
An indicator marks setups; it doesn't decide whether they pay. We coded the model as rules and tested 108 versions on 7 markets from January 2018 to September 2026: before costs it was a coin flip, and nothing passed after costs. LunqFX's track-record panel counts how often price reached its targets, with no costs and no entry rule, so it is not a profit figure.