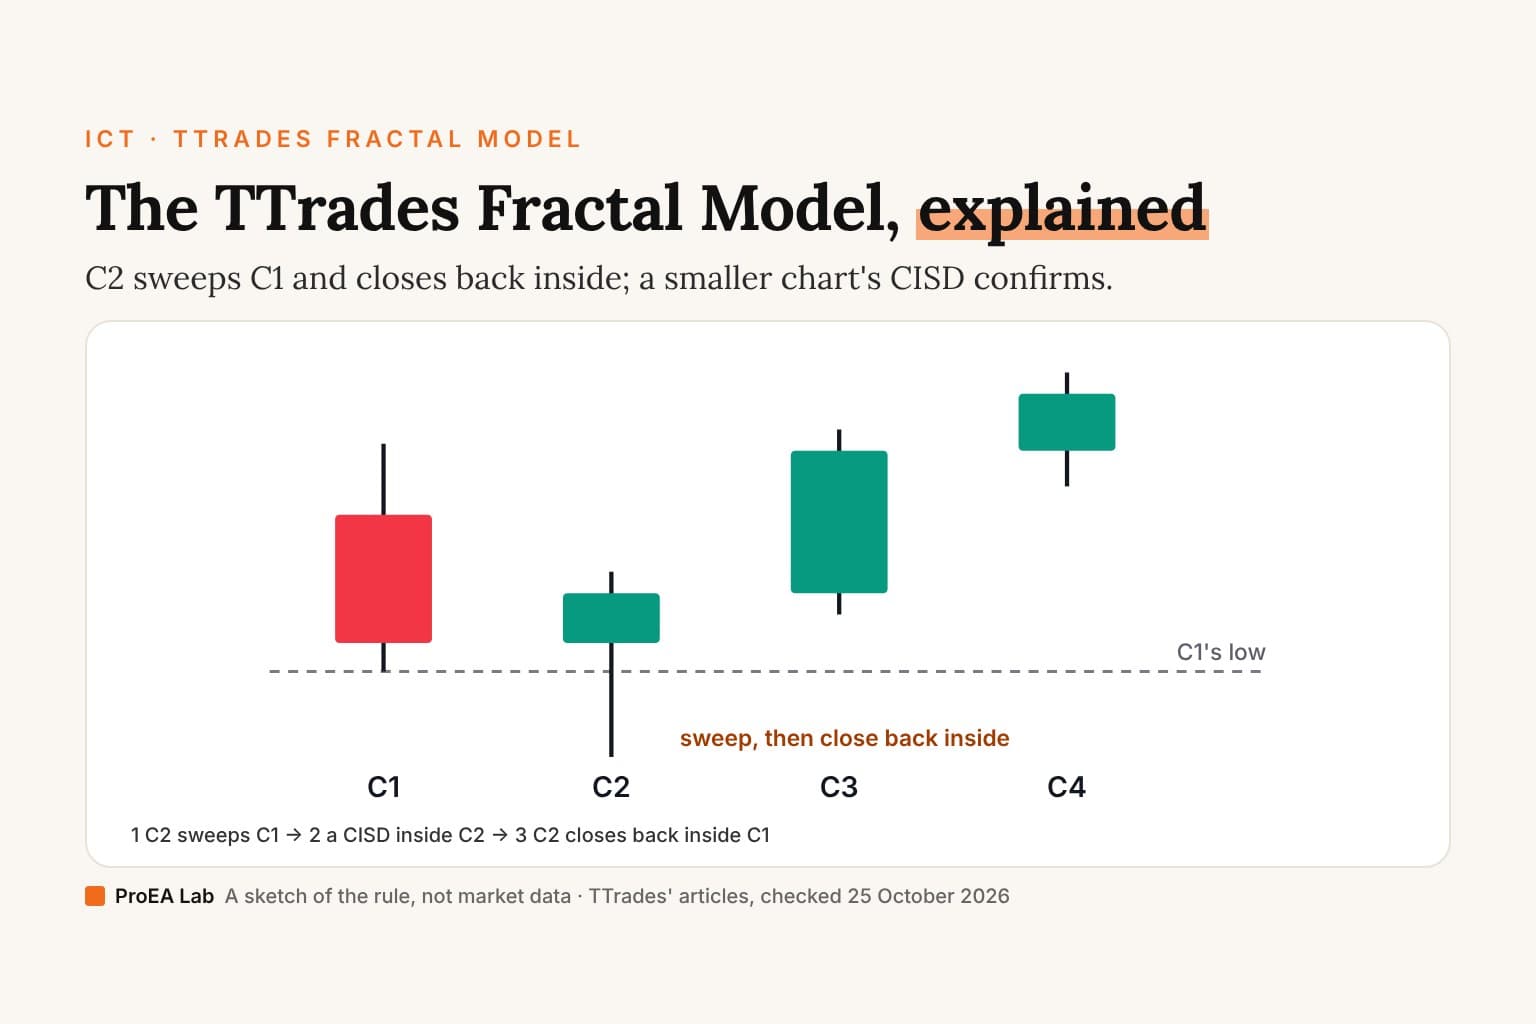
Short answer: the TTrades Fractal Model reads one larger candle against the last. C2 sweeps C1's high or low and closes back inside C1; on a smaller chart, a close back through the open of the run into the sweep (the CISD) confirms the turn. TTrades calls it "a mechanical trading system designed to decode price delivery and expansion phases across all timeframes."
Four candles, one close that matters, and the same shape on every timeframe.
Simulated 15-minute candles, not market data, run through the study's rule. Setup 1 is the first setup whose trade reaches C1's far side, so every step shows; Another setup plays the rest in order, whatever they did. R is after a 0.40 round-trip cost.
Read as text
- C1, the four-hour candle, closes at 12:00 UTC: high 2394.41, low 2382.89.
- 12:15: a candle of C2 trades below C1's low. A long setup starts.
- 15:30: a 15-minute close above 2386.36, the open of the run of down candles that made the low (2377.80).
- C2 closes back inside C1's range: the swing is confirmed.
- 16:00: entry at 2390.96, stop 2377.80, target 2394.41 (C1's high).
- 19:30: the target fills at 2394.41: +0.23R after a 0.40 round-trip cost.
The four candles
TTrades' own definitions, from Understanding Candle 2 Closures Within the Fractal Model (published 15 November 2025, checked 25 October 2026), in our words:
| Candle | What it does |
|---|---|
| C1 | The last closed larger candle. Its high and low are the liquidity. |
| C2 | Sweeps C1's high or low, then closes back inside C1's range: the reversal. |
| C3 | Continuation: expands away from the sweep. |
| C4 | If C3 closes beyond C2's high or low in that direction, it usually leads to a C4 expansion. |
The bullish version sweeps C1's low and closes back above it; the bearish one sweeps the high. Without the close back inside, a sweep is just a sweep, and the same skeleton without a CISD is what traders call candle range theory.
The CISD: the close that confirms C2
Drop to the smaller chart inside C2. Find the run of candles that made the swept low, mark the open of its first candle, and wait for a close back through it. That close is the change in state of delivery. A wick through the line doesn't count.
TTrades doesn't trade it alone: "CISD on its own means nothing to me unless it is paired with a higher time frame candle closure" (How Change in the State of Delivery (CISD) Confirms Swing Points, 10 January 2026). Our CISD guide has the line, the run and how it differs from a market structure shift.
Which chart reads which candle
The model is fractal: the same four candles on every timeframe, with your chart inside the larger one.
A 5m chart reads 1-hour candles: 12 of yours make one.
C2 is one 1-hour candle, built from 12 5m candles: the sweep, the CISD and the close back inside C1 all happen inside it. TTrades' playbook drops to the 5-minute to confirm a CISD in the hourly Candle 2 (11 Aug 2025), and uses the 5-minute for New York reversals (16 Aug 2025).
Made-up candles on a 24-hour, 5-day market. Pairings: Fractal Model Desk's automatic table. TTrades' guidance: its own articles, dated, linked below.
What TTrades' articles say, checked 25 October 2026:
- The Best Timeframes for TTrades Fractal Model (31 January 2026): the daily sets bias over the 4-hour, and the 4-hour frames swing points for the 15-minute. "The same logic applies across all timeframes."
- Fractal Model Playbook (11 August 2025): daily, then hourly, then 5-minute, and "Never drop to the hourly until you have a one-sided daily bias."
- How to Trade Candle 2 (16 August 2025): confirm on the 1-hour or 30-minute in Asia, the 1-hour, 30-minute or 15-minute in London, and drop to the 15-minute or 5-minute in New York.
Fractal Model Desk pairs on its own: a 1-minute chart reads 15-minute candles, a 5-minute chart 1-hour candles, a 15-minute chart 4-hour candles, a 1-hour chart daily candles. On a 4-hour chart it reads weekly candles; set the daily by hand for TTrades' daily and 4-hour pair.
Where a C2 counts
Not everywhere. TTrades only takes a C2 at a higher-timeframe point of interest: a swing high or low, a fair value gap, or an opposing candle when there's neither. The same article adds that if C2 leaves a large wick, C3 should respect the wick's midpoint for the model to stay intact.
That part is judgement, and it's the part no indicator decides for you.
Targets and the stop
TTrades' How to Set Price Targets Using the Fractal Model (23 May 2026) aims at the larger timeframe's swing points: "In bullish conditions → target previous highs", and a level already taken out no longer counts. The articles we read give no exact stop. Our test put it beyond C2's extreme, with C1's far side as the target.
TTrades also marks a T-Spot: "the zone where I expect the wick of the higher timeframe candle to form" (Refining Entries with the Fractal Model, 3 August 2025), confirmed by a 5-minute CISD.
The checklist
- Bias on the larger chart, one-sided before you drop down.
- A point of interest where C2 forms.
- C2 sweeps C1's high or low.
- A CISD on your chart, inside C2.
- C2 closes back inside C1. A close on C1's edge isn't inside.
- A target at an untaken swing point on the larger chart.
- A stop you set before you enter.
Everything above on one page: the TTrades Fractal Model cheat sheet (PDF), in our words, each point dated to its source.
What it takes by hand
Points 3 to 5 are mechanical, and by hand they mean sitting through every close:
- The higher candle. Open the larger chart, mark the last closed candle's high and low, then come back down.
- The sweep. Wait for a wick past that high or low, candle after candle.
- The CISD line. Find the run of candles behind the extreme and mark where it opened.
- The close inside. Wait for the higher candle to close, then check it closed inside the one before.
- The watching. Sit through every higher-timeframe close on each symbol you follow.
Fractal Model Desk does these on the chart: it pairs the timeframes itself, records each sweep at the close it happens, follows the CISD line and freezes it at the first close through, checks C2's close against C1's whole range, and sends an alert at the close when a setup's delivery checks pass. The bias, the point of interest, the size and the orders stay yours.
Does it work?
We coded the mechanical part as rules and tested it: 108 versions on 7 markets from January 2018 to September 2026. Before costs it was a coin flip, and nothing passed after costs; lower timeframes did worse, because costs are a larger share of a small stop. The bias, the point of interest and the objective weren't tested, because they can't be written as rules. Every number is in the Fractal Model study.
The deep version, as a PDF
The Fractal Model Field Guide
TTrades' Fractal Model, CRT and CISD as exact rules, with every result of our 108-version, 7-market test.
- The model in TTrades' own dated words, then as a seven-check rule you can apply candle by candle
- Every result of our 108-version test on 7 markets, 2018 to 2026, before and after costs
- What each choice did: timeframe pair, entry, target and filter, and how far each fell short after costs
One payment, instant download. Refund within 7 days if you haven't downloaded it.
Drawing it on your chart
- TTrades' own indicator is sold from $45 a month; how it compares with ours.
- TTrades' course comes with that indicator and with TTrades' mentorship, $150 a month (both checked 25 October 2026). This page is our read of TTrades' free articles, not the course.
- Free scripts on TradingView draw parts of it; we read their code, and some decide on a candle that hasn't closed. C2's rule on its own is candle range theory, which has scripts of its own.
- Fractal Model Desk is ours: C1 to C4, the CISD and C2's close on your chart, decided on closed candles, with its full Pine v6 source, $49 once in Pine Pro Library.
The same sweep and close back inside runs on the clock in ICT's Judas swing.
We build Fractal Model Desk, our own automation of public TTrades material, not TTrades' indicator, and we have no relationship with TTrades. Nothing here is financial advice.
Use this animation on your site.
Frequently asked questions
What is the TTrades Fractal Model?
A way of reading one larger candle against the last: C2 sweeps C1's high or low and closes back inside C1's range, and a change in state of delivery (CISD) on a smaller chart confirms the turn. TTrades calls it a mechanical trading system designed to decode price delivery and expansion phases across all timeframes.
What are C1, C2, C3 and C4 in the Fractal Model?
C1 is the last closed larger candle; its high and low are the liquidity. C2 sweeps one of them and closes back inside C1: the reversal. C3 expands away from the sweep, and if C3 closes beyond C2's high or low in that direction, TTrades says it usually leads to a C4 expansion.
What timeframes does the Fractal Model use?
TTrades pairs the daily with the 4-hour and the 4-hour with the 15-minute, and its playbook runs daily, then hourly, then 5-minute. Fractal Model Desk pairs automatically: a 1-minute chart reads 15-minute candles, a 5-minute chart 1-hour candles, a 15-minute chart 4-hour candles and a 1-hour chart daily candles.
What is a CISD in the Fractal Model?
Inside C2, on the smaller chart: the first close back through the open of the first candle in the run that made the swept high or low. A wick through it doesn't count. TTrades pairs it with the larger candle's close: a CISD on its own isn't a setup.
Is there a Fractal Model PDF or cheat sheet?
Ours is one page: the four candles, the CISD, which chart reads which candle, a seven-step checklist, targets, and what our test found, each point dated to the TTrades article it comes from. It's in our words, not TTrades' material.
What is the T-Spot in the Fractal Model?
TTrades describes it as the zone where it expects the wick of the higher timeframe candle to form, confirmed by a CISD on the 5-minute chart. Fractal Model Desk doesn't draw a T-Spot; TTrades' own indicator does.
Does the TTrades Fractal Model work?
As a mechanical rule, not in our test: 108 versions on 7 markets from January 2018 to September 2026 were a coin flip before costs, and nothing passed after costs. That test left out what TTrades adds by hand, the bias, the point of interest and the objective, so it isn't a verdict on a trader who adds them.
Is there a Fractal Model indicator?
TTrades sells its own, from $45 a month. Free open-source scripts on TradingView draw parts of the model, and Fractal Model Desk is ours, with its full Pine v6 source, $49 once in Pine Pro Library.