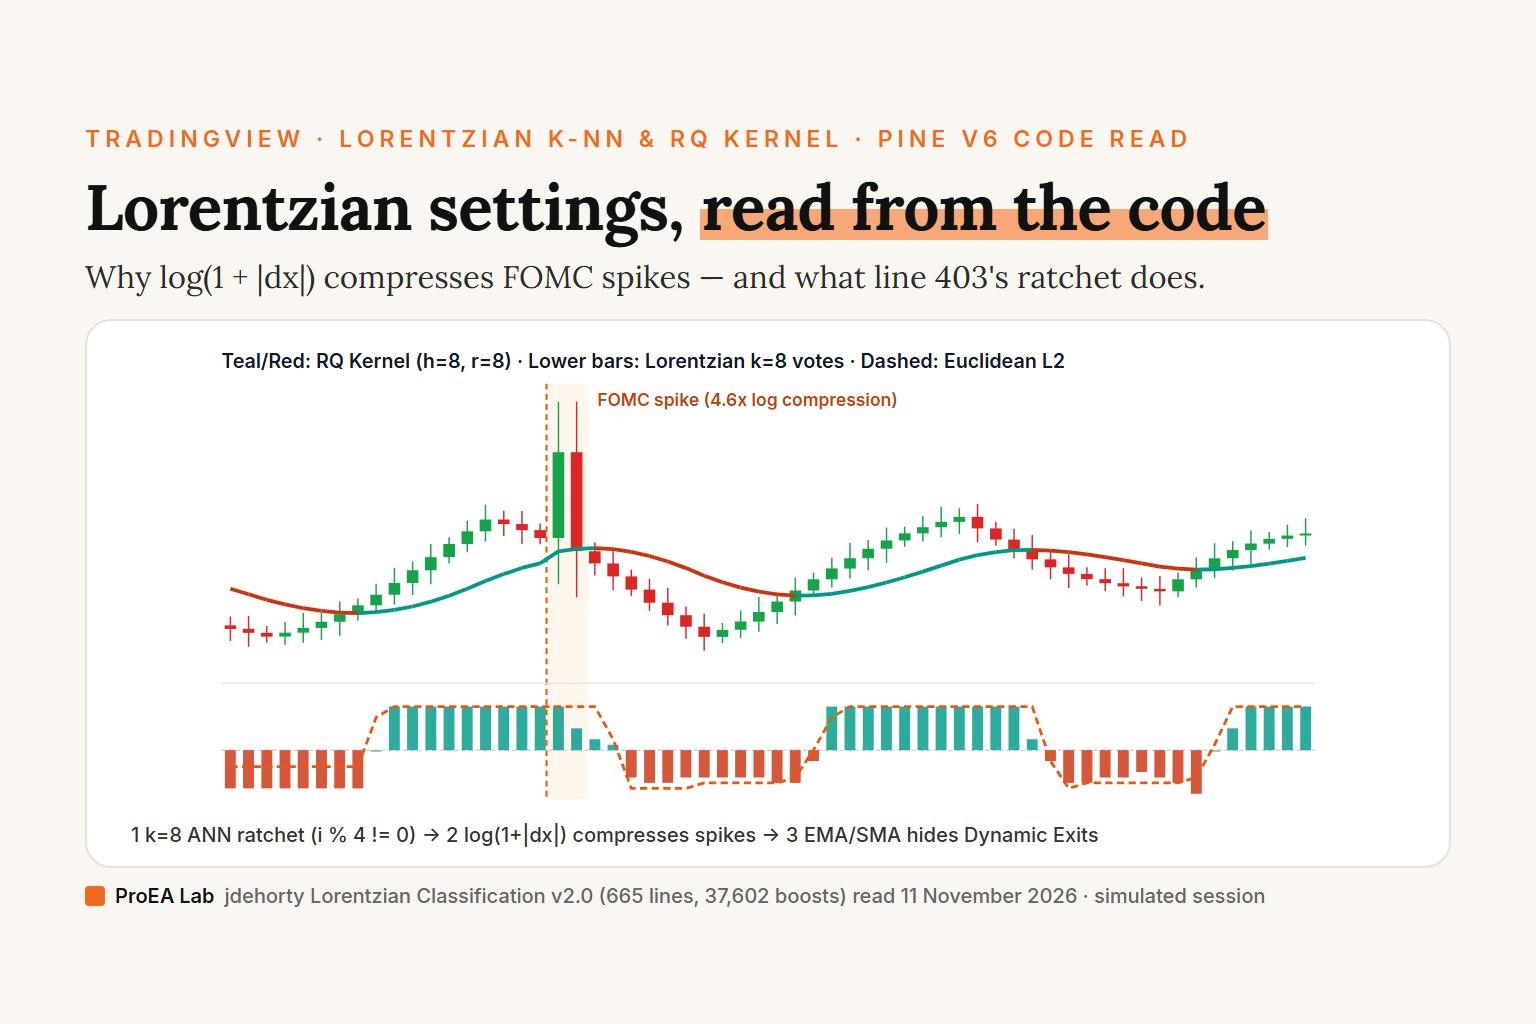
No single Lorentzian Classification setting turns k-nearest neighbors into a crystal ball, and reading all 665 lines of jdehorty's open-source Pine v6 Machine Learning: Lorentzian Classification (37,602 boosts) uncovers three mechanics that tutorial videos miss: line 403 (if d >= lastDistance and i % 4 != 0) runs a monotonic distance ratchet across 3 of every 4 bars rather than sorting the k smallest distances, line 558 silently disables Use Dynamic Exits the moment you enable Use EMA Filter, Use SMA Filter, or Enhance Kernel Smoothing, and maxBarsBackIndex on line 300 slides forward with last_bar_index on chart reloads. Toggle between Lorentzian log(1 + |dx|) and Euclidean distance, compare Line 403's ANN ratchet against sorted k-NN, and test the Rational Quadratic Kernel filter on the simulated FOMC session below.
Lorentzian log(1+|dx|) · Line 403 ANN Ratchet · k=8 · Kernel ON (h=8) → 3 Buy / 3 Sell (0 early flips)
Across the simulated FOMC spike at bar 18, Euclidean distance jumps to 70.2 while Lorentzian compresses the exact same 5-feature shock to 15.4 (4.6× compression). Line 403's ANN ratchet disagrees with sorted minimum-k nearest neighbors on 28 of 60 bars, and Trade with Kernel blocks 0 counter-kernel flips.
Simulated 15-minute candles, not market data: generated deterministically (28 warmup + 60 visible bars, with a simulated volatility shock at visible bars 18–19) to illustrate lines 181–560 of WhBzgfDu (read 11 November 2026). Counts describe these simulated bars only; no trade outcomes are claimed.
Drill code: our TypeScript port of Machine Learning: Lorentzian Classification by jdehorty, used under the Mozilla Public License 2.0. Its source: open-source code on ProEA.
Read preset comparison as table
| Lorentzian Classifier Preset | FOMC Spike Distance | Buy / Sell Signals | Kernel Blocked | Early Flips (<4 bars) |
|---|---|---|---|---|
| Default (k=8 · Lorentzian · ANN · Kernel ON) | 15.4 (log) | 3▲ / 3▼ | 0 | 0 |
| Euclidean Distance (Watch FOMC Spike) | 70.2 (L2) | 3▲ / 3▼ | 0 | 0 |
| True Sorted k-NN (vs Line 403 Ratchet) | 15.4 (log) | 3▲ / 1▼ | 4 | 4 |
| Kernel Filter OFF · k=5 | 15.4 (log) | 3▲ / 3▼ | 0 | 0 |
What we read
On 11 November 2026 we searched TradingView's public scripts for "lorentzian", "lorentzian classification" and "machine learning lorentzian".
Justin Dehorty's (jdehorty) MPL-2.0 Machine Learning: Lorentzian Classification (shorttitle="Lorentzian Classification v2.0", upgraded to //@version=6 on 29 June 2026) has 37,602 boosts, more than six times the Lorentzian Classification Strategy by StrategiesForEveryone (5,978 boosts); the search also returned jdehorty's invite-only ML: Lorentzian Classification Premium (1,652 boosts) and mishy_Champ's Lorentzian Key Support and Resistance Level Detector (1,221 boosts). Every line number below comes verbatim from the 665-line WhBzgfDu source served on 11 November 2026.
Every General, Feature, Filter & Kernel input (lines 203–328)
WhBzgfDu organizes its configuration into five groups ("General Settings", "Feature Engineering", "Filters", "Kernel Settings", and "Display Settings"):
| Input in Settings | Default | Line | What WhBzgfDu actually computes |
|---|---|---|---|
Source | close | 205 | Price series passed into the 4-bar training label (src[4] vs src[0]), ADX filter, and Rational Quadratic Kernel. |
Neighbors Count (k) | 8 | 206 | Maximum length of predictions and distances arrays (1..100). Each neighbor votes +1, -1, or 0; prediction := array.sum(predictions) (line 414). |
Max Bars Back | 2000 | 207 | Sets maxBarsBackIndex = last_bar_index >= settings.maxBarsBack ? last_bar_index - settings.maxBarsBack : 0 (line 300). |
Include Full History | false | 221 | Added in v2.0: sets startIndex = includeFullHistory ? 0 : maxBarsBackIndex (line 398), scanning from bar 0 when checked. |
Feature Count | 5 | 208 | Selects 2 to 5 normalized oscillator coordinates inside get_lorentzian_distance() (lines 181–196). |
Feature 1 .. Feature 5 | RSI(14,1), WT(10,11), CCI(20,1), ADX(20,2), RSI(9,1) | 242–256 | Calls jdehorty/MLExtensions/2 (ml.n_rsi, ml.n_wt, ml.n_cci, ml.n_adx) rescaled onto [0, 100] (for WT(10,11), see our WaveTrend oscillator settings code read). Note Feature 4's paramB = 2 is passed to series_from on line 264, where "ADX" => ml.n_adx(_high, _low, _close, f_paramA) on line 179 ignores f_paramB! |
Use Volatility / Regime / ADX | true / true (-0.1) / false (20) | 226–239 | Combined via filter_all = filter.volatility and filter.regime and filter.adx (line 422). When filter_all is false, signal holds its prior state nz(signal[1]) (line 425). |
Use EMA / SMA Filter | false (200) / false (200) | 303–310 | Gates isBuySignal / isSellSignal above/below the 200-bar EMA/SMA—and silently disables Use Dynamic Exits on line 558. |
Trade with Kernel | true (h=8, r=8.0, x=25, lag=2) | 313–319 | Requires yhat1 = kernels.rationalQuadratic(settings.source, h, r, x) to slope in the trade's direction (or yhat2 >= yhat1 when Enhance Kernel Smoothing is on). |
Use Worst Case Estimates | false | 217 | Switches the top-right calibration table (ml.backtest on line 644) to close-only fills rather than optimistic intrabar assumptions. |
Three surprises when you read lines 181–560 verbatim
1. Lorentzian log(1 + |dx|) vs Line 403's Approximate Nearest Neighbors ratchet
First, lines 181–187 define the 5-feature Lorentzian distance cleanly:
get_lorentzian_distance(int i, int featureCount, FeatureSeries featureSeries, FeatureArrays featureArrays) =>
    switch featureCount
        5 => math.log(1+math.abs(featureSeries.f1 - array.get(featureArrays.f1, i))) +
             math.log(1+math.abs(featureSeries.f2 - array.get(featureArrays.f2, i))) +
             math.log(1+math.abs(featureSeries.f3 - array.get(featureArrays.f3, i))) +
             math.log(1+math.abs(featureSeries.f4 - array.get(featureArrays.f4, i))) +
             math.log(1+math.abs(featureSeries.f5 - array.get(featureArrays.f5, i)))
If an FOMC candle spikes a normalized feature by 40 points, Euclidean squared error adds 40^2 = 1,600, whereas math.log(1 + 40) adds 3.71. Now read the search loop right below it on lines 395–415:
lastDistance = -1.0
size = math.min(settings.maxBarsBack-1, array.size(y_train_array)-1)
sizeLoop = math.min(settings.maxBarsBack-1, size)
startIndex = includeFullHistory ? 0 : maxBarsBackIndex

if bar_index >= maxBarsBackIndex
    for i = startIndex to sizeLoop
        d = get_lorentzian_distance(i, settings.featureCount, featureSeries, featureArrays)
        if d >= lastDistance and i % 4 != 0
            lastDistance := d
            array.push(distances, d)
            array.push(predictions, math.round(array.get(y_train_array, i)))
            if array.size(predictions) > settings.neighborsCount
                lastDistance := array.get(distances, math.round(settings.neighborsCount*3/4))
                array.shift(distances)
                array.shift(predictions)
    prediction := array.sum(predictions)
Three details jump straight off lines 401–414:
i % 4 != 0skips 1 in 4 bars, not 3 in 4: Line 380's comment says "only perform calculations every 4 bars", yet line 402 computesget_lorentzian_distance()on every bar fromstartIndextosizeLoop, andi % 4 != 0evaluates totrueon indices1, 2, 3, 5, 6, 7...(75% of bars), leaving adjacent bars1bar apart rather than4bars apart.d >= lastDistanceis a rising ratchet, not a minimum-distance sort: Adapted from@capissimo's earlier Pine k-NN workaround for Pine's loop-time budget, each pushed bar raiseslastDistance := duntilpredictionsexceedsneighborsCount, wherelastDistanceresets to the 75th-percentile entry (neighborsCount * 3 / 4). Also notice on lines 340–343 thatvar predictionsandvar distancesare declared withvarand neverarray.clear()ed at the start of a new bar—meaning leftover votes from bart - 1stay at the front of the queue until enough bars on bartpush them out!- Why line 336's inverted label and line 403's rising ratchet form a double negative: Line 336 writes
y_train_series = src[4] < src[0] ? direction.short : src[4] > src[0] ? direction.long : direction.neutral. Whensrcrose into bari(src[4] < src[0]),y_train_seriesstores-1(short); whensrcfell into bari(src[4] > src[0]), it stores+1(long). Becaused >= lastDistanceon line 403 ratchets toward maximum-distance (opposite-phase) historical bars—matching an overbought bar today against oversold bars in the past whosey_train_serieswas+1—the two inversions cancel out into a directional signal, smoothed further whenTrade with Kernel = true(comparejdehorty's kernel math in our Nadaraya-Watson Envelope code read).
2. Why Use Dynamic Exits silently stops working (line 558)
Many traders check Show Default Exits, Use Dynamic Exits, and Use EMA Filter (Period = 200) together, then wonder why every × exit marker still prints exactly 4 bars after entry. Lines 556–560 explain why:
bool endLongTradeStrict = ((isHeldFourBars and isLastSignalBuy) or (isHeldLessThanFourBars and isNewSellSignal and isLastSignalBuy)) and startLongTrade[4]
bool endShortTradeStrict = ((isHeldFourBars and isLastSignalSell) or (isHeldLessThanFourBars and isNewBuySignal and isLastSignalSell)) and startShortTrade[4]
bool isDynamicExitValid = not useEmaFilter and not useSmaFilter and not useKernelSmoothing
bool endLongTrade = settings.useDynamicExits and isDynamicExitValid ? endLongTradeDynamic : endLongTradeStrict
bool endShortTrade = settings.useDynamicExits and isDynamicExitValid ? endShortTradeDynamic : endShortTradeStrict
If any of useEmaFilter, useSmaFilter, or useKernelSmoothing is true, isDynamicExitValid becomes false and Use Dynamic Exits is ignored completely.
3. Reload drift (last_bar_index) vs intrabar repainting
Does WhBzgfDu repaint? Separate two distinct mechanisms (covered step by step in our repainting audit guide):
- Live intrabar updates:
close,high, andlowmove while the current candle is still forming, so a ▲ or ▼ label can appear mid-candle and disappear before the close unless your alert or execution waits for candle confirmation (Use Worst Case Estimates = trueon line 217 approximates close-confirmed entries in the calibration table). last_bar_indexwindow drift: Line 300 setsmaxBarsBackIndex = last_bar_index >= settings.maxBarsBack ? last_bar_index - settings.maxBarsBack : 0. Becauselast_bar_indexincrements with each new bar, reloading the chart 100 candles later starts the training window 100 bars further right—shifting initialvar predictionsqueue state across the entire window unlessInclude Full History(line 221) is enabled on a timeframe wheresizeLoopcovers all bars.
Clean Pine Script v6: True Sorted Lorentzian k-NN + Causal Rational Quadratic Kernel
If you want true minimum-distance Lorentzian k-NN without leftover var array state, exact 4-bar chronological spacing (lag % 4 == 0), non- lookahead forward 4-bar labels (close[lag - 4] vs close[lag] for lag >= 4), and confirmed-close alerts in pure //@version=6—ready to merge via our Pine Script indicator merger or port from legacy scripts with our Pine v5 to v6 converter—paste this standalone indicator into TradingView:
//@version=6
indicator("ProEA True-Sorted Lorentzian k-NN + RQ Kernel (v6)", shorttitle = "Lorentzian True k-NN v6", overlay = true)

kNeighbors   = input.int(8, "Neighbors Count (k)", minval = 3, maxval = 31)
lookbackBars = input.int(600, "Training Window (bars)", minval = 100, maxval = 1600, step = 50)
horizonBars  = input.int(4, "Outcome Horizon (bars)", minval = 1, maxval = 12)
useKernel    = input.bool(true, "Require Rational Quadratic Kernel Alignment")
kernelH      = input.int(8, "Kernel Lookback (h)", minval = 3, maxval = 50)
kernelR      = input.float(8.0, "Kernel Relative Weight (r)", minval = 0.5, step = 0.5)

// Normalized [0..100] feature coordinates (no external library dependency)
f1 = ta.rsi(close, 14)
f2 = ta.rsi(close, 9)
f3 = 50.0 + 50.0 * math.tanh(ta.cci(hlc3, 20) / 150.0)
[_, _, adxVal] = ta.dmi(14, 14)
f4 = adxVal

// Causal Rational Quadratic Kernel regression (weights i = 0..48 past bars only)
rqKernel(series float src, int h, float r) =>
    float num = 0.0
    float den = 0.0
    int maxLag = math.min(bar_index, 48)
    for i = 0 to maxLag
        float w = math.pow(1.0 + (i * i) / (2.0 * r * h * h), -r)
        num += src[i] * w
        den += w
    den > 0.0 ? num / den : src

float yhat = rqKernel(close, kernelH, kernelR)
bool kernelBull = yhat > nz(yhat[1], yhat)
bool kernelBear = yhat < nz(yhat[1], yhat)

// True minimum-distance Lorentzian k-NN over non-overlapping historical outcomes (lag >= horizonBars)
int maxLag = math.min(bar_index - 20, lookbackBars)
var array<float> topDist = array.new_float(0)
var array<int>   topVote = array.new_int(0)
array.clear(topDist)
array.clear(topVote)

if maxLag >= horizonBars + 4
    for lag = horizonBars to maxLag by 4
        float d = math.log(1.0 + math.abs(f1 - f1[lag])) +
                  math.log(1.0 + math.abs(f2 - f2[lag])) +
                  math.log(1.0 + math.abs(f3 - f3[lag])) +
                  math.log(1.0 + math.abs(f4 - f4[lag]))
        // Historical outcome from bar [lag] to bar [lag - horizonBars] is 100% closed in the past!
        int outcome = close[lag - horizonBars] > close[lag] ? 1 : close[lag - horizonBars] < close[lag] ? -1 : 0
        int sz = array.size(topDist)
        if sz < kNeighbors
            array.push(topDist, d)
            array.push(topVote, outcome)
        else
            // Replace worst neighbor in top-k if current distance d is strictly smaller
            int worstIdx = 0
            float worstD = array.get(topDist, 0)
            for j = 1 to sz - 1
                float dj = array.get(topDist, j)
                if dj > worstD
                    worstD := dj
                    worstIdx := j
            if d < worstD
                array.set(topDist, worstIdx, d)
                array.set(topVote, worstIdx, outcome)

int voteSum = array.size(topVote) > 0 ? array.sum(topVote) : 0
var int state = 0
int nextState = voteSum >= 2 ? 1 : voteSum <= -2 ? -1 : state
bool flippedLong  = nextState == 1 and state != 1 and (not useKernel or kernelBull)
bool flippedShort = nextState == -1 and state != -1 and (not useKernel or kernelBear)
if flippedLong
    state := 1
else if flippedShort
    state := -1

plot(yhat, "RQ Kernel", color = kernelBull ? #009988 : #cc3311, linewidth = 2)
plotshape(barstate.isconfirmed and flippedLong ? low : na, "Confirmed Buy", shape.labelup, location.belowbar, #009988, text = "▲", textcolor = color.white, size = size.tiny)
plotshape(barstate.isconfirmed and flippedShort ? high : na, "Confirmed Sell", shape.labeldown, location.abovebar, #cc3311, text = "▼", textcolor = color.white, size = size.tiny)

alertcondition(barstate.isconfirmed and flippedLong, "Confirmed Lorentzian Long", "Confirmed Lorentzian k-NN Long on {{ticker}} ({{interval}})")
alertcondition(barstate.isconfirmed and flippedShort, "Confirmed Lorentzian Short", "Confirmed Lorentzian k-NN Short on {{ticker}} ({{interval}})")
Notice three structural upgrades in those 72 lines: array.clear() resets neighbor state cleanly on every bar, for lag = horizonBars to maxLag by 4 enforces true 4-bar spacing while reading close[lag - horizonBars] - close[lag] strictly inside closed history (zero future leakage), and replacing worstD keeps the exact k closest Lorentzian matches rather than a rising distance ratchet. If you are translating Lorentzian ports from C# cBots, MetaTrader 5, or NinjaScript into Pine v6, drop your code into our free cTrader to Pine Script v6 converter, MQL5 to Pine Script v6 converter, or NinjaScript to Pine Script v6 converter, pair regime detection with volatility compression (see our Squeeze Momentum code read), and validate net expectancy after spread and commission in TradingView's Strategy Tester (backtesting checklist).
Use this animation on your site.
Frequently asked questions
What are the default Lorentzian Classification indicator settings on TradingView?
jdehorty's 665-line Pine v6 script Machine Learning: Lorentzian Classification v2.0 (WhBzgfDu, 37,602 boosts) ships Source = close, Neighbors Count = 8, Max Bars Back = 2000, Feature Count = 5 (RSI 14/1, WT 10/11, CCI 20/1, ADX 20/2, RSI 9/1), Use Volatility Filter = true, Use Regime Filter = true (-0.1), Use ADX Filter = false (20), and Trade with Kernel = true (Lookback Window h = 8, Relative Weighting r = 8.0, Regression Level x = 25).
Why does Lorentzian Classification use log(1 + |dx|) instead of Euclidean distance?
Lines 181–196 compute get_lorentzian_distance() by summing math.log(1 + math.abs(f_current - f_historical)) across 2 to 5 normalized oscillator features. Whereas Euclidean distance squares feature gaps—allowing a single FOMC or CPI volatility spike to dominate neighbor distances—the natural logarithm compresses extreme macro outliers onto a sub-linear scale.
Does the Lorentzian Classification indicator repaint on TradingView?
Closed-bar Buy and Sell plotshape labels do not repaint intrabar once a candle closes, provided you wait for bar close (approximated in the calibration table via Use Worst Case Estimates = true on line 217). However, historical signals near the left edge of the 2000-bar window can shift when you reload the chart later because maxBarsBackIndex = last_bar_index - settings.maxBarsBack (line 300) advances with every new live bar and var predictions/distances arrays (lines 340–343) carry state forward across bars.
Why does Use Dynamic Exits stop working when I turn on the EMA or SMA filter?
Line 558 hardcodes bool isDynamicExitValid = not useEmaFilter and not useSmaFilter and not useKernelSmoothing. Whenever Use EMA Filter (200), Use SMA Filter (200), or Enhance Kernel Smoothing is checked, isDynamicExitValid evaluates to false and lines 556–560 silently fall back to strict 4-bar fixed exits (endLongTradeStrict / endShortTradeStrict) with no chart warning.
Does line 403 really check every 4th bar and sort the k closest neighbors?
No—and this is the biggest surprise in the source code. Although the comment on line 380 says the loop performs calculations every 4 bars, line 402 calls get_lorentzian_distance() on every bar in the window and line 403 filters with if d >= lastDistance and i % 4 != 0. Modulo i % 4 != 0 accepts 3 out of every 4 bars (75%), and d >= lastDistance implements an increasing-distance ratchet (resetting lastDistance to the 75th percentile on overflow) rather than sorting for the k minimum distances.
Can I rely on the Show Trade Stats win rate table in the top-right corner?
jdehorty explicitly warns in the code that Show Trade Stats is for feature calibration only, not a replacement for Strategy Tester backtesting: by default Use Worst Case Estimates is false (line 217), zero spread or commission is deducted, and 'Early Signal Flips' count direction changes inside the hardcoded 4-bar training horizon rather than protective stop-loss fills.