Download the trading journal for the Indian market as an Excel workbook (.xlsx) or a CSV with the values but no formulas. It's our free trading journal template in rupees, with the three columns Indian F&O needs: Segment, Lot size and Lots. Quantity, Risk, Result, R multiple and Win/Loss are formulas, so the arithmetic is done for you, and the Summary sheet adds your total charges and your average R in F&O against equity. Delete the three rows marked EXAMPLE, then log one row per closed trade. No email, no account.
Upload the .xlsx to Google Sheets (File → Import → Upload) to keep its formulas, Summary and dropdowns. The CSV has the example rows with their worked-out values but no formulas, so rows you add won't calculate.
Write the risk in rupees before you click. In F&O the lot size decides it: a 50-point stop on one NIFTY lot is ₹3,250.What should a trading journal for the Indian market have?
One row per closed trade, with the planned risk fixed at entry and the result net of every charge. The workbook's Trades sheet keeps the free template's 18 columns in their places and adds three. Each column, by the name the file gives it:
| Column | What you type | Why it matters |
|---|---|---|
| Date | The day the trade closed | The weekly review groups by date |
| Symbol | As your broker names it: NIFTY FUT, RELIANCE, BANKNIFTY CE | Finds the instrument that keeps costing you |
| Direction (Long/Short) | From the list. A short sale, or an option you sold, is Short | Flips the sign of the Result formula |
| Setup / reason | One name from a fixed menu, written before entry | A closed menu can be counted |
| Entry, Stop, Target, Exit | Prices. For options, premiums. Stop is the initial stop | The stop sets the risk |
| Segment | From the list: Equity intraday, Equity delivery, F&O futures, F&O options | Splits the Summary into F&O and equity |
| Lot size | F&O only: NSE's lot size for that contract, on the day you traded | Lot sizes change; each row keeps its own |
| Lots | F&O only: how many lots | Shows whether size followed your rule |
| Quantity | Formula for F&O: Lot size × Lots. For equity, type the shares over it | Every rupee figure multiplies by it |
| Risk (₹) | Formula: the distance from Entry to Stop × Quantity | The denominator of every R |
| Charges (₹, from the contract note) | The trade's charges as one positive number | Already taken off Result |
| Result (₹) | Formula: (Exit − Entry) × Quantity, sign flipped for a short, minus Charges | What actually happened, net |
| R multiple | Formula: Result ÷ Risk | Makes a 1-lot trade and a 10-lot trade comparable |
| Win/Loss | Formula: Win, Loss or Breakeven | Feeds the win rate |
| Followed plan? (Y/N) | From the list | Splits the system from the rule breaks |
| Mistake tag | From the list: Moved stop, Early exit, Oversized and four more | Counts the repeat offender |
| Notes, Screenshot link | One line, and a link to a chart image | The context you'll want on Sunday |
In the file, Segment, Lot size and Lots sit at the end (columns S to U), so the first 18 columns line up with the free template and its Summary formulas. The three formulas that make this the Indian edition, as row 2 has them:
I2  Quantity    =IF(AND(T2<>"",U2<>""),T2*U2,"")
J2  Risk (₹)    =IF(OR(E2="",F2="",I2=""),"",ABS(E2-F2)*I2)
K2  Result (₹)  =IF(OR(E2="",H2="",I2=""),"",(H2-E2)*IF($C2="Short",-1,1)*I2-N2)
Charges are the ones Zerodha's support pages list as "displayed on the contract note": brokerage, STT (securities transaction tax), exchange transaction charges, GST, SEBI charges and stamp duty. Add them up for the trade and type the total. We don't quote rates: your contract note already has the exact rupees. Risk is fixed at entry: if you move your stop, Risk stays what you planned, so a moved stop shows up as a loss bigger than −1R, which is what the sheet should catch.
To size an equity trade from the risk you want, the stock position size calculator works out shares = risk ÷ |entry − stop|. Its labels say dollars; the arithmetic is the same in rupees.
Which lot size goes in the Lot size column?
The one NSE set for that contract when you traded it. NSE's circular NSE/FAOP/70616, dated 3 October 2025 and titled "Revision in Market Lot of Derivative Contracts on Indices", revised the index lots "in pursuance of SEBI guidelines for periodic revision of lot size". NSE's market-lot file (fo_mktlots.csv), read 29 October 2026, still shows the revised sizes:
| Index | Symbol | Before the circular | Revised | NSE's market-lot file, read 29 October 2026 |
|---|---|---|---|---|
| Nifty 50 | NIFTY | 75 | 65 | 65 for the NOV-26, DEC-26, JAN-27, MAR-27 and JUN-27 series |
| Nifty Bank | BANKNIFTY | 35 | 30 | 30 for every series from NOV-26 to SEP-27 |
So NIFTY is 65 and BANKNIFTY is 30 through the Jan-2027 series and later. The circular also kept the old size for a while: "The existing lot size will be applicable for weekly and monthly contracts till December 30,2025 expiry date." A NIFTY trade from 2025 may have been 75 a lot.
Lot sizes are revised periodically. Take yours from NSE's current list or your broker's order window, not from this page, and type it on each row. That's why Lot size is a column you type and not a lookup: when NSE changes it, your old rows keep the size they were traded at, and their Risk and Result stay right. For a stock future, use that stock's lot size from the same list.
The three example rows, worked by hand
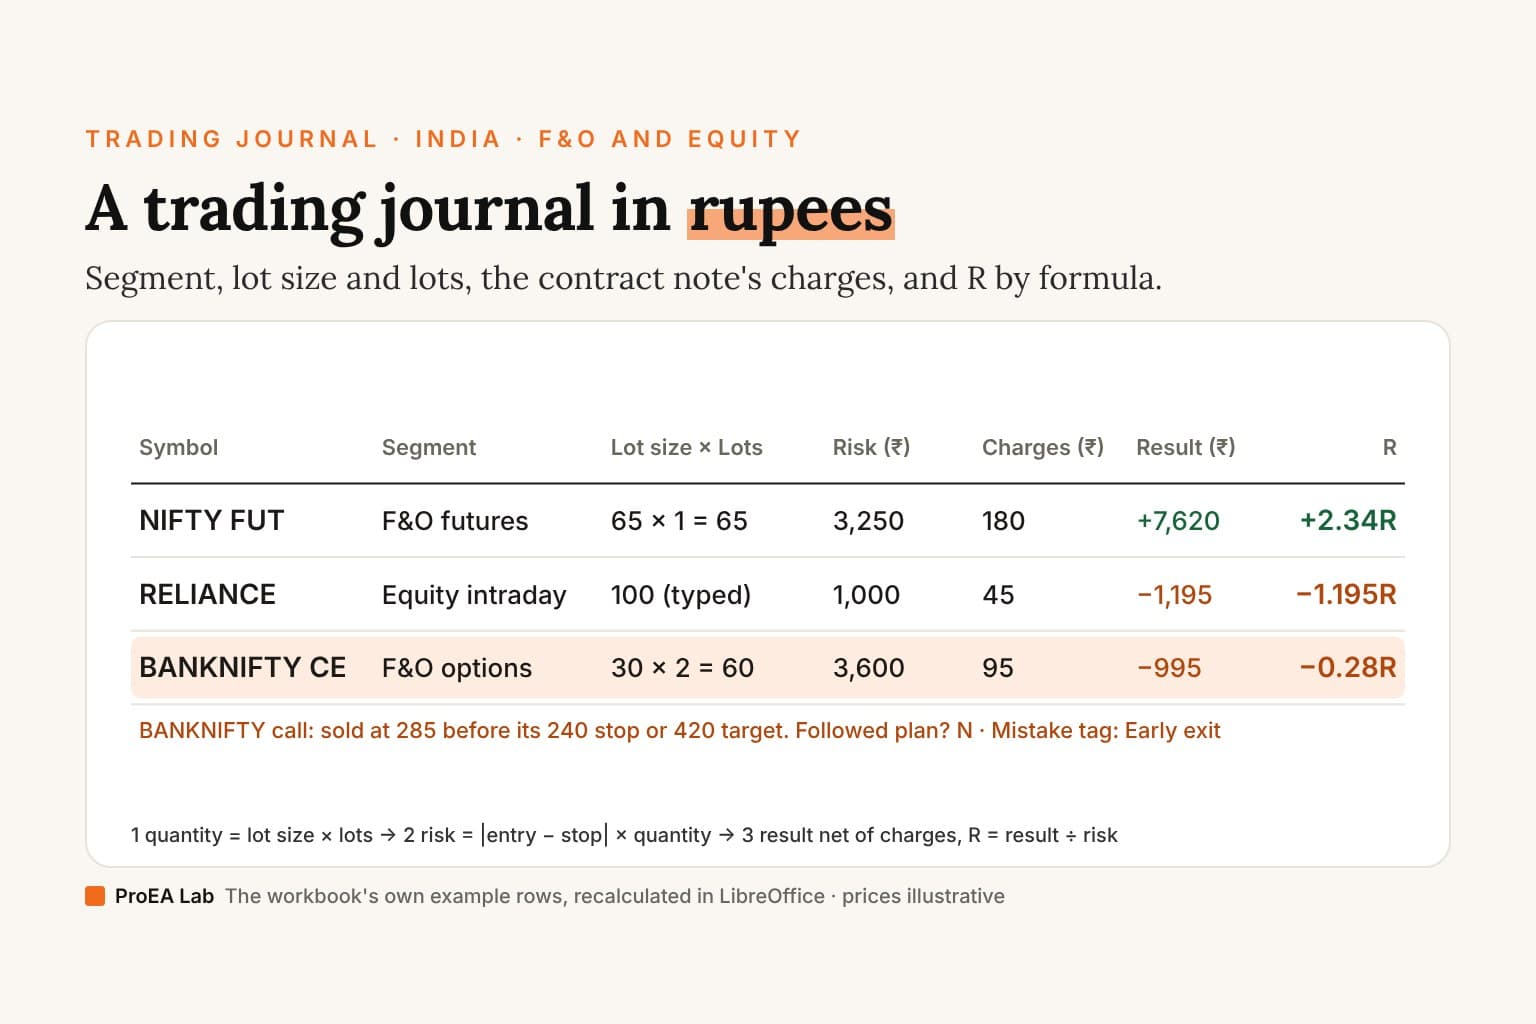
The workbook ships with three example rows, recalculated in LibreOffice. The prices are illustrative, not quotes:
| Row | Segment | Entry → Exit (stop) | Quantity | Risk (₹) | Charges (₹) | Result (₹) | R | Plan |
|---|---|---|---|---|---|---|---|---|
| NIFTY FUT, long | F&O futures | 25000 → 25120 (24950) | 65 × 1 = 65 | 3,250 | 180 | +7,620 | +2.34R | Y |
| RELIANCE, short | Equity intraday | 1400 → 1411.50 (1410) | 100 | 1,000 | 45 | −1,195 | −1.195R | Y |
| BANKNIFTY CE, long | F&O options | 300 → 285 (240) | 30 × 2 = 60 | 3,600 | 95 | −995 | −0.28R | N, Early exit |
NIFTY futures, 1 lot. The stop is 50 points below entry, and one lot is 65, so Risk is 50 × 65 = ₹3,250. It was closed at 25120 at 3:15 pm, 120 points up and short of the 25150 target, as planned: 120 × 65 = ₹7,800, less ₹180 of charges, is ₹7,620. That's 7,620 ÷ 3,250 = +2.34R.
RELIANCE intraday short, 100 shares. Short at 1400 with the stop at 1410: Risk is 10 × 100 = ₹1,000. The stop filled at 1411.50, ₹1.50 of slippage past it. The loss is 11.50 × 100 = ₹1,150 plus ₹45 of charges: −₹1,195, or −1.195R. The part beyond 1R is ₹150 of slippage and ₹45 of charges, the ordinary cost of trading, not a mistake, so Followed plan? is Y.
BANKNIFTY call, 2 lots. Bought at a premium of 300, with a stop at 240 and a target at 420. Two lots of 30 is a quantity of 60, so Risk is 60 × 60 = ₹3,600. It was sold at 285 on a red candle: −15 × 60 = −₹900, less ₹95, is −₹995, or −0.28R. That's a smaller loss than the planned 1R, and it's still a rule break: the plan was the 240 stop or the 420 target, and an early exit was neither. Followed plan? N, Mistake tag Early exit. One early exit that lost less proves nothing; twenty of them, in the plan-broken line, show whether the habit pays or costs.
For more entries filled in the same way, with notes, see six filled-in trading journal examples. For an option's breakeven and the shape of its payoff, the options profit calculator tabulates it; it counts US contracts of 100 shares, so use it for the shape, not the rupee totals.
How do I fill it from Zerodha Console?
From four Console reports, as Zerodha's support pages describe them (read 29 October 2026). One gives the trades, one checks them, two give the charges.
1. The tradebook, for the trades. "Login to Console." / "Click on Reports." / "Click on Tradebook." / "Select the Segment." / "Select the date range and click on the arrow button." Then: "You can download your Tradebook in XLSX or CSV format by clicking beside the Download button." The limit: "Tradebook can only be downloaded for a period of 365 days." A longer history takes more than one download.
Zerodha's help pages don't list the tradebook's columns, so check yours: if it shows each buy and each sell on its own line, pair them, because the journal wants one row per round trip. A long is the buy and the sell that closed it; a short is the sell and the buy that closed it. Entry is the opening price, Exit the closing price, and if a position opened or closed over several fills, use their average price weighted by quantity. The tradebook can't tell you the setup, your planned stop or whether you followed your plan: type those on the day, while you remember them.
2. The P&L report, to check you have every trade. "Visit console.zerodha.com/reports/pnl." / "Select the segment from the drop-down." / "Select Combined, Realised or Unrealised P&L from the drop-down." / "Select the date range and click on the arrow button." / "You can download the P&L as a spreadsheet once it loads." Zerodha itself says: "You should cross-check the P&L report, holdings, and position data with your tradebook, contract notes, and funds statement."
3. The Tax P&L, for each trade's charges. "Log in to Console." / "Click on Reports." / "Click on Tax P&L." / "Select the Financial year." / "Select the quarter range and click on the arrow button." / "Segment wise capital gains report will be displayed." / "Click on Download." What makes it useful here: "The Tax P&L report includes tradewise charges." One caution from the same page: "The sum of tradewise charges for a segment may not always match the charges shown in the summary. This happens when a trade is entered in the current financial year but not exited within the same year."
4. Contract notes, for the breakdown. "Visit console.zerodha.com/reports/downloads." / "Select Contract note in the statement." / "Select Report type as PDF, XML etc." / "Select a Date range". The charges, in Zerodha's words, are "brokerage, exchange transaction charges, STT, GST, Stamp duty, SEBI charges, which are displayed on the contract note." The limit: "You can only download contract notes for the past 365 days". Save each month's notes beside the journal, so a charge you check next year is still there.
| Report | What it gives the journal | Limit or caution Zerodha states |
|---|---|---|
| Tradebook (XLSX or CSV) | The trades themselves, once you pair the fills | 365 days per download |
| P&L report | A check that no trade is missing | None stated |
| Tax P&L | Charges per trade | Totals may differ across financial years |
| Contract notes | The charge breakdown | The past 365 days |
What should I review every week?
The Summary computes the free template's numbers, plus three for this market. On the three example rows:
| Summary measure | Example rows | Read it as |
|---|---|---|
| Total trades | 3 | How much to believe the rest: at 3, not at all |
| Expectancy per trade (R) | +0.29R | 33.3% × 2.34 − 66.7% × 0.74 |
| Expectancy when plan followed / broken (R) | +0.57R / −0.28R | The method against the rule breaks |
| Largest loss (R) | −1.195R | Beyond −1R: the RELIANCE slippage and charges |
| Profit factor | 3.48 | ₹7,620 ÷ ₹2,190 of gross losses; moves with size |
| Total charges (₹) | 320 | Already inside Result |
| Average R, F&O | +1.03R | The NIFTY and BANKNIFTY rows |
| Average R, equity | −1.195R | The RELIANCE row |
The total result is ₹5,430 after ₹320 of charges. The F&O against equity split is the one this edition adds. In rupees, the larger position dominates the total; in R, the NIFTY lot and the 100 RELIANCE shares are on one scale. Three rows are a worked example, not evidence. The trading expectancy calculator takes your own win rate and average R and adds the break-even win rate.
Then count the mistake tags, total each setup's R, and write one rule for next week. The printable trading journal has the weekly review on paper if you'd rather fill it by hand.
The deep version, as a PDF
The Trading Journal Playbook
What to write on every trade and why, filled-in entries across markets, the pre-trade checklist, the weekly and monthly review with the arithmetic shown, and the same columns on paper, in a spreadsheet or an app.
- What to write on every trade, and why each of the template's eighteen columns exists, in the order you fill them
- 13 filled-in entries across forex, gold, an index CFD, a partial close, a prop-firm evaluation day, a skipped trade and a backtest, every Risk, Result and R worked from the prices
- The pre-trade checklist, and how a month of mistake tags turns into checks of your own
Opens soon · USD 19, one payment. See what's inside →
What is the best trading journal in India?
The one that records what the Indian market needs, and that you keep filling. That's rupees, the segment, the lot size and lots, the charges from your contract note, R, and a plan flag. The free sheet does all of it in rupees, with every formula visible. A paid app saves typing; it doesn't change the columns that matter.
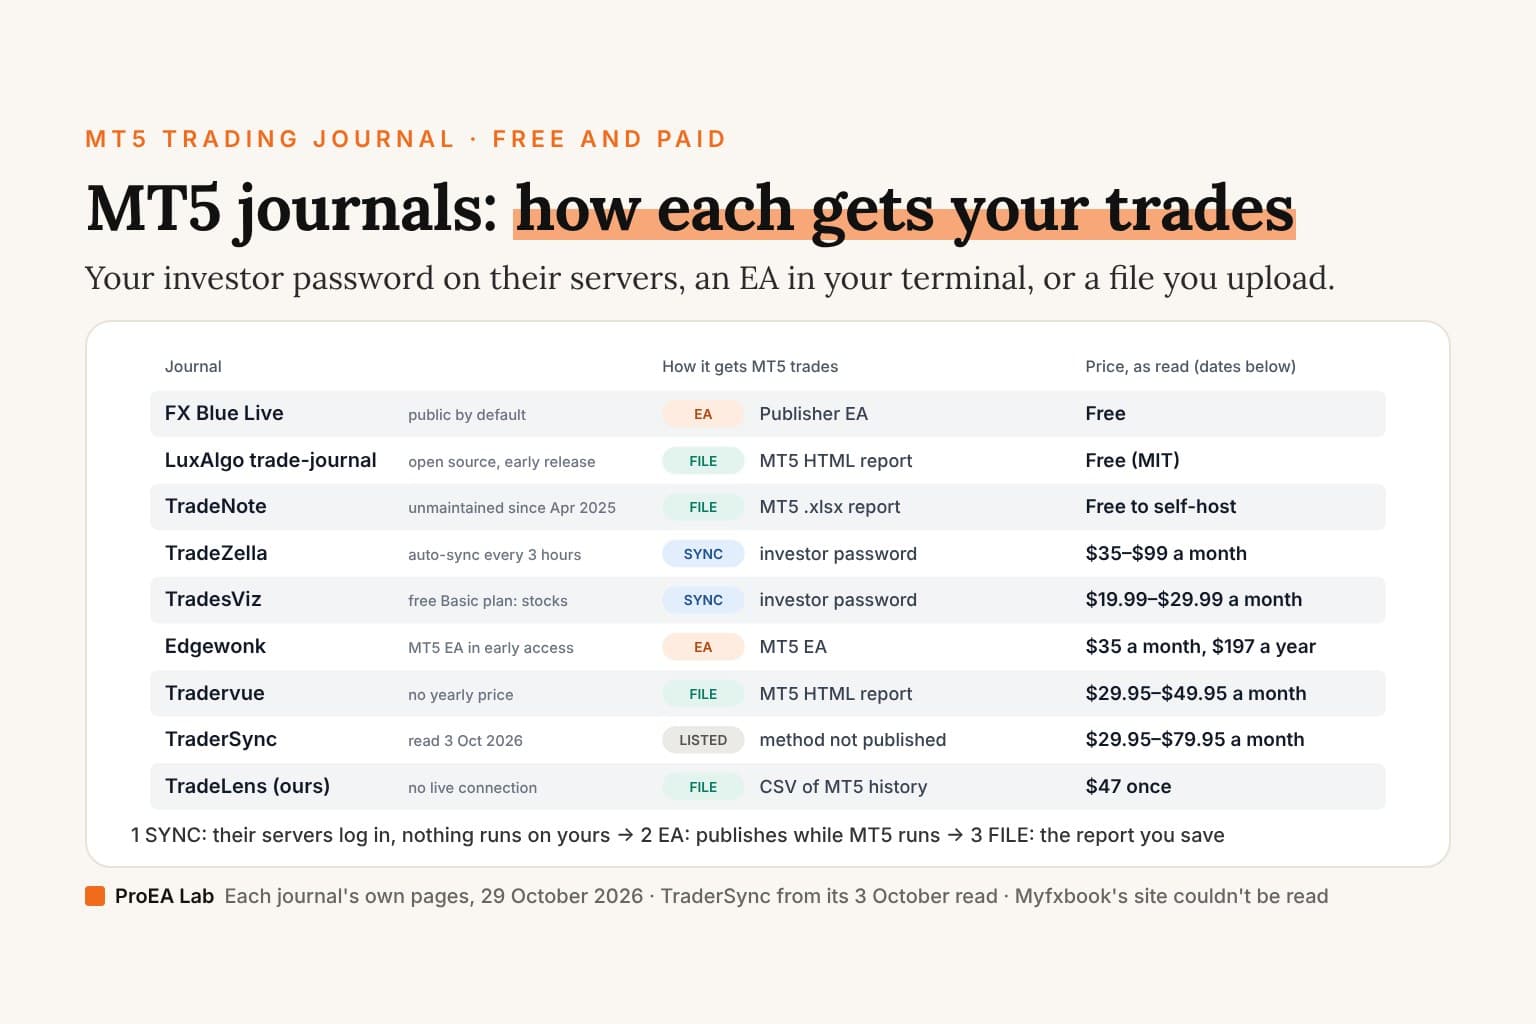
Subscription journals such as TradeZella price in dollars: its pricing page, read 29 October 2026, lists $35, $59 and $99 a month. Before you pay for any app, check that it imports your broker's file; we haven't checked any of them for Zerodha. Our trading journal comparison sets the subscription journals side by side.
Ours, TradeLens, is a $47 download (launch price; $79 regular) that runs on your own computer: Python, a browser UI and one SQLite file. It takes a broker CSV through a column-mapping wizard, with starter templates for MT4, MT5, cTrader, TradingView and a generic file. None of them is for an Indian broker, and its page says it shows "where your trading leaks money in dollars", so for a rupee journal the free sheet is the better fit.
What the sheet doesn't do
- It isn't a tax record, and this isn't tax advice. For tax, use your broker's Tax P&L. The sheet is arithmetic on what you type.
- It doesn't read your account. Every trade goes in by hand, or by pasting from the tradebook.
- It doesn't know lot sizes. Type each row's from NSE's list or your broker's order window.
- A sold option with no stop has no Risk. The formula needs a stop premium. Type the risk you planned over it, or the row has no R.
- Filtering the Trades sheet doesn't filter the Summary. Its formulas read whole columns; for one segment or one month, review a copy with only those rows.
The R method behind all of it is in count R, not money. If you trade a prop firm account as well, the prop firm tracker spreadsheet tracks the account's rules beside the journal.
Frequently asked questions
Is there a free trading journal for the Indian market?
Yes. Ours is an Excel workbook, plus a CSV with the values but no formulas, that keeps the free template's 18 columns in rupees and adds Segment, Lot size and Lots. Quantity for F&O, Risk, Result, R and Win/Loss are formulas. No email, no account.
How do I keep a trading journal with Zerodha?
Download the tradebook from Console (Reports, then Tradebook, as XLSX or CSV, up to 365 days at a time) and, if it lists each buy and sell on its own line, pair them, so each round trip is one row. Take the charges from the contract note or the Tax P&L. Then add what no report can know: the setup, the stop you planned and whether you followed your plan.
What is the lot size of NIFTY and BANKNIFTY?
NSE's market-lot file, read on 29 October 2026, shows 65 for NIFTY and 30 for BANKNIFTY through the January 2027 series and later. Those sizes come from NSE circular NSE/FAOP/70616 of 3 October 2025. NSE revises lot sizes periodically, so take yours from NSE's current list or your broker's order window.
How do I calculate risk in rupees for F&O trades?
Quantity is the lot size times the lots, and risk is the distance from entry to stop times the quantity. One NIFTY futures lot of 65 with a 50-point stop risks ₹3,250. For an option, use premiums: a BANKNIFTY call bought at 300 with its stop at 240, 2 lots of 30, risks 60 × 60 = ₹3,600.
Which charges go in a trading journal?
Brokerage, STT, exchange transaction charges, GST, SEBI charges and stamp duty, as your contract note lists them for that trade. Type their total as one positive number in the Charges column; the Result formula takes it off, so every R is net of costs.
What is the best trading journal in India?
The one that records rupees, the segment, the lot size and lots, the charges from your contract note and R, and that you keep filling. A spreadsheet does all of that free; a paid app saves typing. Before paying for an app, check that it imports your broker's file.
Can I use this trading journal for income tax?
No. It's arithmetic on what you type, not a tax record and not tax advice. For tax, use your broker's Tax P&L; on Zerodha it's in Console under Reports, then Tax P&L.