breakaway-desk-lab.pine
The same plans in TradingView's tester.
A 15-minute level breaks. The first gap becomes a limit. The chart shows every ending.
MIT licence. Draws on your chart; never places an order.
≈ +$100 at $100 risk · before costs
Simulated one-minute market · simplified rules · R before costs.
Window 1 is the first simulated setup whose limit fills, so every step shows. The next windows play every later setup in order, stops and no-fills included.
| Time | Event | Prices |
|---|---|---|
| 10:29 | Break ↓ on a close beyond the 15m swing low | 21,316.25 |
| 10:30 | First gap: resting sell limit, 10 minutes | entry 21,317.00 · stop 21,356.25 · target 21,277.75 |
| 10:32 | Returned: limit filled | 21,317.00 |
| 10:43 | Target hit, +1.00R before costs | 21,277.75 |
Every way it can end is drawn while the limit waits. Pick one.
● ARMED · waiting for the returnThree endings, drawn before any of them happens.
Unedited. Watch the camera, or pick a part.
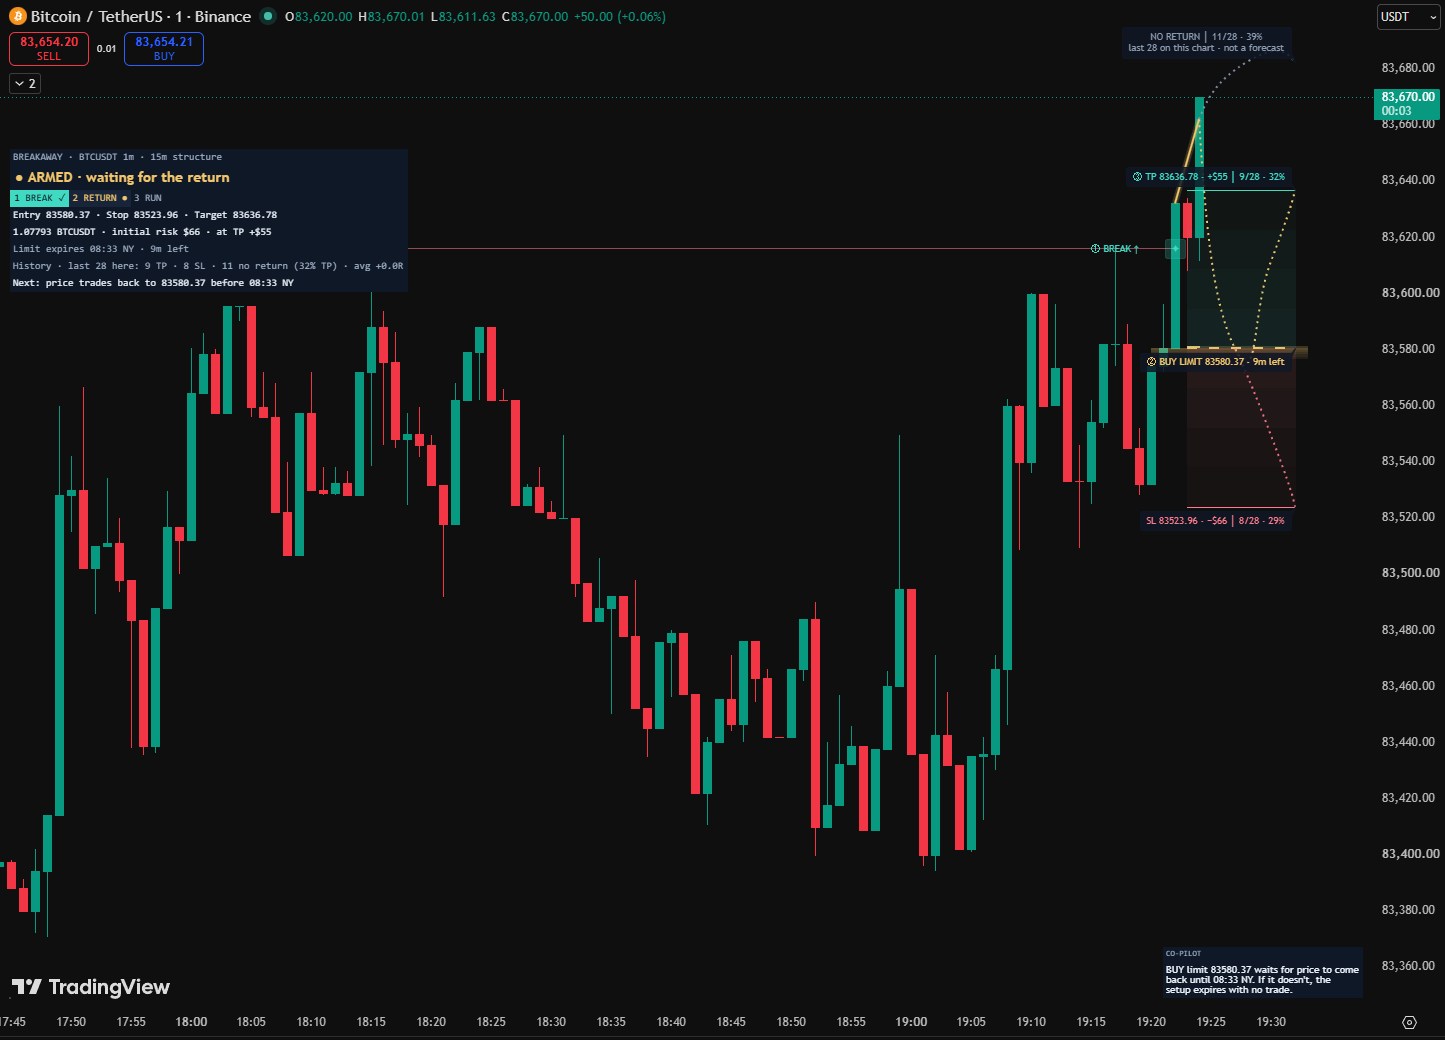
●A live plan on BTCUSDT, one-minute candles.
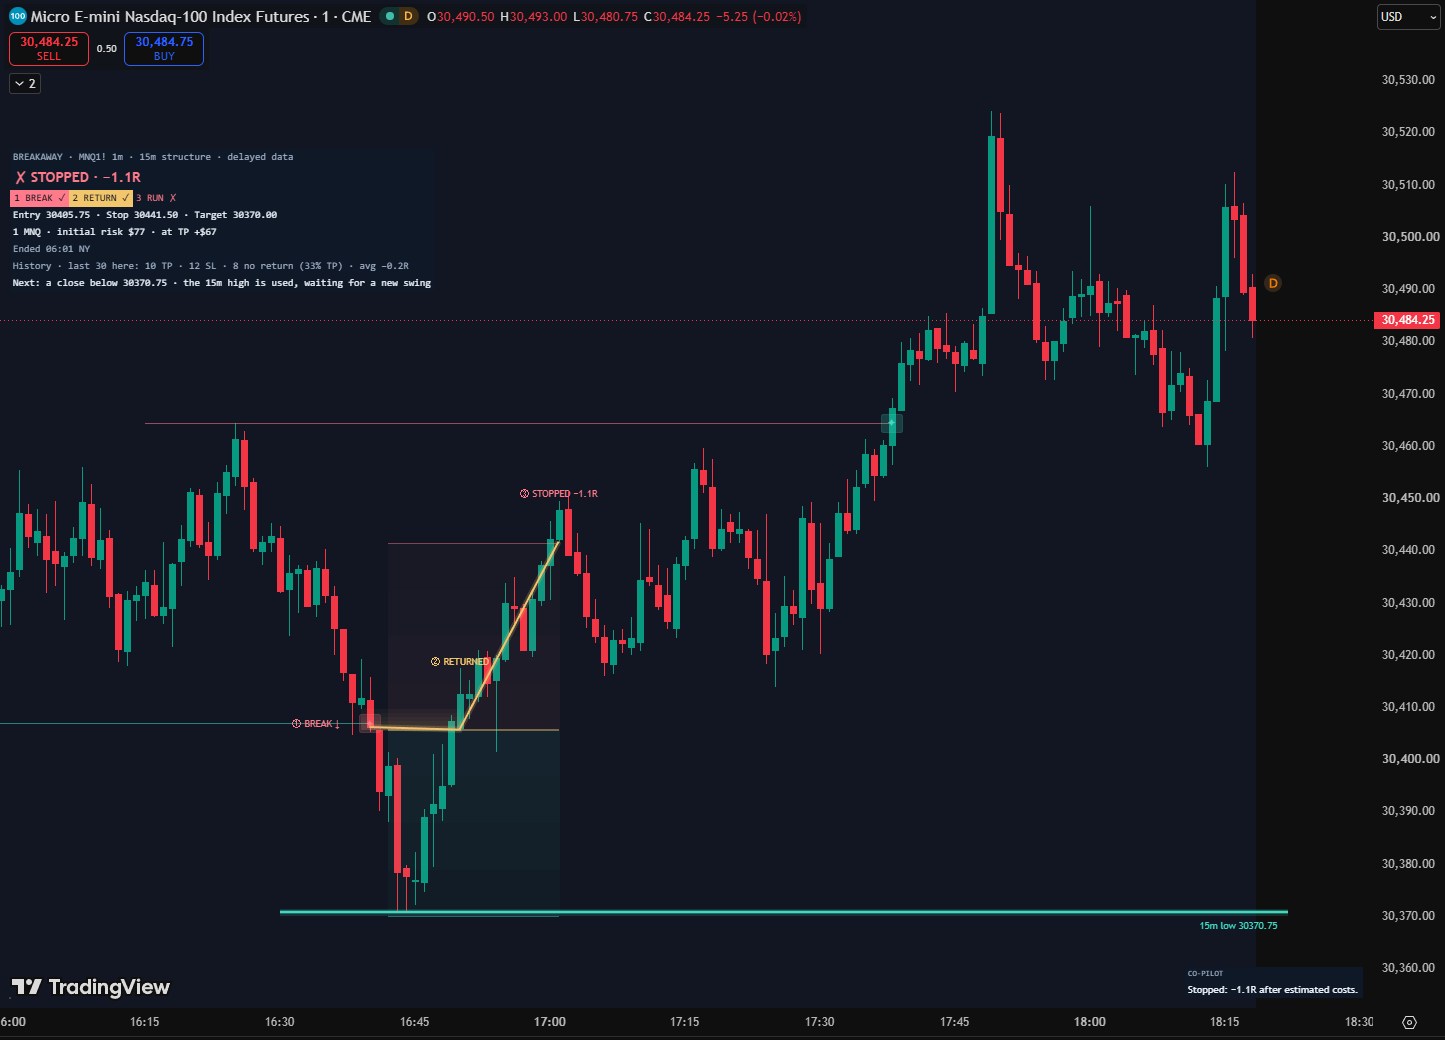
Native TradingView captures, 24 Sep 2026. Nothing redrawn. Full capture ↗
MIT licensed. Three steps.
Standard 1–5 minute candles · Automation Off while you learn it
The same plans in TradingView's tester.
Scripts, docs, tests, validation notes.
Not in our test. The author's registered validation on MGC and MNQ lost money after costs: core validation MGC −USD295 over 8 trades and MNQ −USD144 over 9, on two observed days. The on-chart record is this chart's history, not a forecast. Validation notes are in the ZIP: docs/market-results.md and docs/validation-results.md.
No. It is an independent build of a publicly explained concept, not the private Breakaway Bot and not its signals.
No. It draws the plan and says what is happening. Keep Automation Off while you learn it; you place any order yourself.
Standard 1–5 minute candles (not Heikin Ashi). It reads the 15-minute structure itself.
No. It is a simulated one-minute market with the desk's rules simplified (no sizing or fees, so R is before costs). The captures above are the real indicator on TradingView.
Breakaway Desk is a free, open-source TradingView indicator (MIT) for standard 1–5 minute candles. When a candle closes beyond an unbroken 15-minute swing, the first same-direction gap becomes a resting limit with a countdown. Entry, stop, target and size are frozen when the plan is made. It is an independent build of a publicly explained concept, not the private Breakaway Bot or its signals.
A candle must close beyond a confirmed 15-minute swing high or low that is still unbroken. The first gap in the same direction within the next ten chart candles becomes the return zone. If price does not return before the limit expires, the plan ends with no fill. See how a plan is made and ends
The rules lost money after estimated costs: core validation MGC −USD295 over 8 trades and MNQ −USD144 over 9, on two observed days. The record tags on the chart count this chart's history; they are not a forecast. Read the honest numbers
No. The Lab is a separate script for TradingView's Strategy Tester, whose broker emulator places the same frozen plans. Its costs are set in the strategy's Properties; the desk's commission input does not change them. Compare the Strategy Lab
A setup starts only when a candle closes beyond an unused 15-minute swing. A wick through the level is not enough, and a close exactly at it is not beyond it. Once broken, a level is used and can never trigger again. Try it.
○ WATCHING 15m levels The wick went through, the close did not. No break.
After the break, the desk waits for the first three-candle gap in the same direction, on the break candle or within the next ten. The limit rests at the gap's near edge (the midpoint is an option) and lives ten minutes. The candles must be adjacent in time.
The third candle's low is above the first candle's high by at least a tick: the first gap in the break's direction. The limit rests at its near edge.
Download the indicator (.pine)Download the Strategy Lab (.pine)
Structure: 15-minute pivots with two bars on each side, usable once confirmed. A chart candle must close strictly beyond an unconsumed swing wick; the break is consumed even if a gate blocks it.
Gap: for a bullish gap the current low must exceed the high two bars earlier by at least a tick (bearish mirrors it). Only the first qualifying gap on the break bar or within the next ten bars counts.
Limit: the gap's near edge, and price must still be on the approach side. A fill needs one tick beyond the limit; an exact touch is not enough. Lifetime ten minutes.
Stop: beyond the latest opposing one-minute swing known at the break, plus the greater of one tick and 0.1 ATR. Target: 1R. Entry, stop, target and size never chase later candles.
Risk is in USD. Size accounts for tick size, point value, quantity step, currency conversion, commission, stop slippage and a notional cap. Defaults: a USD 100 budget, USD 2.50 per unit per side, one tick of stop slippage. A gap or live fill can lose more than the estimate.
Both directions are on. Sessions, daily caps and quality filters start Off; at most five reference entries per risk day, which starts at 17:00 New York. Breakeven starts Off.
While a limit waits, three dotted paths show the run to the target, the stop, and no return, each tagged with this chart's most recent resolved setups (30 by default). Counts come first; a percentage appears only once 20 are resolved. It is history on this chart, not a forecast.
The Lab is a separate strategy for TradingView's Strategy Tester. It sends the return limit and its protective bracket together and manages its own emulator position. Its costs live in the strategy's Properties; the indicator's fee inputs do not change them.
Automation is Off by default. The release includes a local, paper-only audit receiver with no broker connection; an accepted message is not a fill. Execution messages require a fresh realtime confirmed close, so a delayed feed is blocked.
Everything is computed on closed candles. Changing the symbol, timeframe, feed or inputs recalculates the history. The desk sees chart candles, not news or your broker's fills. It is research tooling, not financial advice.
What shipped and what changed in Breakaway Desk, newest first. Ask for the next change below; what gets built lands here with a date, and on the lab queue on the front page.
Breakaway Desk v2.0.0 Shipped
A 15-minute level breaks, its first gap becomes a resting limit, and three endings are drawn.
Validation lost money after estimated costs Lab note Breakaway Desk
The author's registered validation lost money after estimated costs on two observed days. The chart's record is its history, not a forecast.
A small friction or a big idea. Tell us what would make this tool work better for you.
Requests for a new tool go on the same queue: see what is asked for and what is being built.
Breakaway Desk is free, open-source charting software by ProEA Lab, MIT licensed. The film is a simulated market with simplified rules. Nothing here is financial advice, and the indicator never places orders. Version 2.0.0.